ECONOMIA AGRO-ALIMENTARE FOOD ECONOMYon Agricultural and Food SystemsAn International Journal 2020, Vol. 22, Issue 1
Economia agro-alimentare / Food Economy 2020, 22 (1) SIEA
FrancoAngeli La passione per le conoscenze ISSN 1126-1668
ISSNe 1972-4802
Economia agro-alimentare /
Food Economy
An International Journal on Agricultural and Food Systems Vol. 22, Iss. 1, Art. 8, pp. 1-23 - ISSN 1126-1668 - ISSNe 1972-4802
DOI: 10.3280/ecag1-2020oa10070
Trade Relationships in the European
Pork Value Chain: A Network Analysis
Eduardo Barberis*,a, Daniela Freddib, Raffaele Giammettic,
Paolo Polidoria, Désirée Teobaldellia, Elena Viganòa
a Università degli Studi di Urbino Carlo Bo, Italy
b Ires Emilia-Romagna, Italy
c Università Politecnica delle Marche, Italy
* Corresponding author: Elena Viganò - Full Professor - Department of Economics, Society, Politics - University of Urbino Carlo Bo - Via Saffi, 42 - 61029 - Urbino (PU), Italy - Tel. +39 0722 305510 - E-mail: [email protected].
Article info
Type: Note Submitted: 06/03/2019 Accepted: 11/05/2020 JEL codes: F14, L66, Q17 Key words: Pig sector European Union Commercial exchanges Network analysisAbstract
This article aims to analyse the European pig sector and its transformations (e.g. vertical integration and phase specialization). In particular, we will both explore the specialization and territorial concentration of pig production, and the significant changes which have taken place in the trade among European Union countries. Using the network analysis (betweenness centrality, node strength and community detection) applied to Eurostat and fao datasets on production and trade in the period 2000-2016, we will show the emergence of national players and international connections that lead to a larger continental market. Finally, this evidence will be used in the discussion and conclusion to raise wider concerning the working of agrifood value chains, in terms of social, economic and environmental sustainability, as well as regulation. This calls for more interdisciplinary analyses of value chains.
Introduction
The internationalization of value chains has involved different sectors at different timings, including the agrifood system. This process has generated deep consequences in the national economic systems, and the various food supply chains, starting from the agricultural and livestock sectors, as well as fostering strong asymmetries in the bargaining power between the oligopolistic companies of the large-scale retail trade and companies in the production and processing segment (Mariani & Viganò, 2013). Despite the existence of considerable variability between countries, productive orders, and company typologies, these sectors face a number of challenges. Among those challenges there is a continuous worsening of the price spread, determined by a fall in the prices of agricultural/livestock goods, along with an increase in production costs linked to the rise of the price of input (European Commission, 2018).
These dynamics also characterize the European pig sector, which plays a strategic role in many EU Member States: as a matter of fact half of the meat produced in the continent comes from this sector (Eurostat, 2019).
In an effort to improve business efficiency and economies of scale, the pig sector has been characterized by an intense structural transformation process that has led to a decrease in the number of firms and an increase in their size (Dolman et al., 2012; Ferretti, 2016; Labajova et al., 2016; Hoste, 2020). In several countries, this process has been accompanied by a specialization in the management of the different phases of the supply chain, which, in turn, has boosted their concentration in specific regions/ countries (Camanzi et al., 2018). The localization of the various production activities, together with the adoption of a specific production model, has had many consequences on the different dimensions of the quality of products and, more generally, on the international division of labour and in labour structure. Choices driven by the need to recover competitiveness by reducing production costs (including those related to procurement and, therefore, at the geographical origin of raw materials) can compromise not only the food safety and organoleptic characteristics of final goods, but also the environmental and social sustainability of the production process (Maples
et al., 2016; De Boni et al., 2016; Viganò et al., 2019). On the one hand, the
pollution of natural resources, the loss of biodiversity, and greenhouse gas emissions, and on the other side, the exploitation of workers, are phenomena often linked to intensive and large-scale farms, concentrated in specific geographical areas, which would require the definition of institutional and governance processes and structures.
Within such a frame, this study aims to explore a specific aspect of these transformations, namely the existence of a relationship between the
specialization/territorial concentration of pig production and evolution of commercial exchanges of processed products among European Union countries.
The paper is structured as follows. Section 2 reports the main conceptual arguments used to analyse the growing interconnections between production systems of different countries. Section 3 presents data and methodology, with a focus on network analysis. The main results obtained are reported and discussed in Section 4. Finally, Section 5 draws general implications for stakeholders and policymakers and also suggests directions for further research.
1. Interconnected production systems and the economics of networks
Over the last decades, advancements in information technology and globalisation processes have helped change the organizational structure of post-industrial economies and brought about the emergence of what Castells (2004) labelled “the network society”. This structural change has been emphasised by the growing public fascination with the complex connectedness of modern society (Rosser, 2003; Gallegati et al., 2006; Delli Gatti et al., 2007; Farmer et al., 2012), and by the development of a new research field in the economic literature: the economics of networks (Economidies, 1996; Goyal, 2007; Jackson, 2008; Bramoullé et al., 2016). Economic networks are webs where nodes represent economic agents (individuals, firms, consumers, organizations, industries, countries, etc.) and links depict market interactions. Economic network analysis applies models from network science (Caldarelli, 2007; Newman, 2010) to the analysis and interpretation of economic phenomena (Schweitzer et al., 2009) with more and more frequent applications in many different fields, especially after the crisis (Chinazzi & Fagiolo, 2013).
In the agri-food system, the network analysis was applied with various objectives as, for example, to describe the relational dimension of a production/social system at a local level (Chiffoleau & Touzard, 2014; Crespo
et al., 2014; Brinkley, 2017; Focacci et al., 2018) or examine the relationships
between each stakeholder in the supply chain, either in terms of the flow of goods or of information (Barsing et al., 2018).
One of the most promising applications of network analysis is the study of trade and global value chains. In these networks the nodes are countries, regions or sectors and the edges are goods and services flow at a sectoral or product level. By employing trade and production network techniques, the economic literature has investigated international trade relationships (Fagiolo
production structures (Zhu et al., 2015; Amador & Cabral, 2016; Criscuolo & Timmis, 2018; Giammetti et al., 2020), shock propagations (Alatriste-Contreras & Fagiolo, 2014; Carvalho et al., 2016), and macroeconomic fluctuations (Acemoglu et al., 2012).
In the present study, we build on this research strand in order to disentangle the complex structure of the pork value chain. In particular, we made use of three typical network statistics: the betweenness centrality, the node strength and community detection. The betweenness centrality is a measure of centrality which detects the amount of influence a node has over the flow of information in a graph (Newman, 2010). It is often used to find nodes that serve as a bridge from one part of a graph to another. Here we utilize this measure to identify countries brokering different markets. The node strength sums weights of both inward and outward links in trade connections. The analysis of centrality and strength will contribute to cluster our cases in densely knitted groups: community detection has been conducted running the Louvain algorithm (Blondel et al., 2008) in order to identify groups of interacting nodes in the network depending upon their structural properties (Yang et al., 2013; Kelley et al., 2012). The Louvain method detects communities by evaluating how much more densely connected the nodes within a community are, compared to how connected they would be in a random network.
2. Data and Methodology
In this study, we employ two main datasets – namely the Eurostat dataset and the fao dataset. In particular, data used to depict the pig population by regions and the number of agricultural holdings with pig livestock are from the Eurostat dataset, whereas data employed to build the bilateral trade networks and to describe the overall import-export relationships of pig meat and pig meat products are from the fao dataset. The observed period used for this analysis covers data from 2000 to the last available year (usually 2016).
Livestock and meat statistics are collected by EU Member States under Regulation (EC) No 1165/2008, which covers bovine, pig, sheep and goat livestock. Livestock surveys cover sufficient agricultural holdings to account for at least 95% of the national livestock population, as determined by the last survey on the structure of agricultural holdings. Pig livestock statistics are produced twice a year, with reference to a given day in May/June and a given day in November/December. Livestock surveys may be conducted independently by livestock category or as a sub-set of items surveyed with a wider scope (livestock survey as a whole, farm production survey, annual census) or recorded with a wider objective in the case of registers
(every animal owner). Depending on the design, some over-coverage can be observed. Livestock population is accounted for by categories that capture their rearing, either for fattening then slaughter, or for herd renewal, i.e. for breeding and/or milking.
Data concerning the number of agricultural holdings with pig livestock are collected from the Farm structure survey, which is carried out every 3 or 4 years by all EU Member States. Specifically, EU Member States collect information from individual agricultural holdings covering land use, livestock numbers, rural development, management and farm labour input. The survey unit is the agricultural holding (farm). An agricultural holding with pig livestock is a single unit, in both technical and economic terms, operating under a single management, which undertakes agricultural activities within the economic territory of the European Union, either as its primary or secondary activity.
As already mentioned, the data concerning the trade in live pigs, pig meat and pig meat products are collected from the food and agricultural trade dataset, which is processed and disseminated by fao according to the standard International Merchandise Trade Statistics Methodology. The trade database includes the following variables: export quantity, export value, import quantity and import value, and includes all food and agricultural products imported/exported annually by all the countries in the world.
To build our trade networks we focus on bilateral trade data expressed in quantity (namely heads for live pigs and tonnes for pig meat and pig meat products). The bilateral trade network in live pigs includes trade in domestic pig and excludes non-domesticated wild boars. The bilateral trade network in pig meat and pig meat products includes trade in pig meat, offal, bacon and ham, fat, lard, sausages, and cooked pig meat.
In our analysis regarding the overall import/export trade relationships, we distinguish between trade in pig meat and trade in pig meat products. The former category includes meat with the bone in, of domestic or wild pigs (e.g. wild boars), and pig’s edible offal whether fresh, chilled or frozen. In the latter, we grouped together bacon and ham, unrendered slaughter fats of pigs, rendered pig fat, pig sausages, and pig meat and offal that are boiled, steamed, grilled, fried, roasted or otherwise cooked.
The relative importance of a country within the pork value network is based on node strength. In this study, the sum of weights attached to the edges belonging to a node is respectively the heads amount of live pigs and the tonnes amount of pig meat and pig meat products in bilateral trade. In our networks, community detection is based on grouping countries within the pork value chain that are more densely connected to one another than to other countries. As we shall see, in compliance with international trade theory, gravity plays a key role: the probability to belong to the same community is higher for neighbouring countries.
3. Analysis of results
In the last few years, the different stages of the supply chain, starting from breeding, have undergone a differential concentration and specialization in different European countries and regions. In what follows, we analyse the EU-28 pig sector by showing the population distribution of live pigs in Europe in order to identify its regional density and characteristics (par. 3.1.). Then we provide a descriptive analysis of EU-28 net exports and its trend by differentiating between fresh/frozen meat and transformed products (par. 3.2.1.). Finally, we develop the network analysis of EU-28 trade relationships by looking at live pigs flows as well as pig meat and products flows (par. 3.2.2.).
3.1. Regional analysis
The pig sector represents an important component for European agricultural production, although almost three quarters of the EU’s pigs are located in Spain (20.8%), Germany (17.8%), France (9.3%), Denmark (8.5%), the Netherlands (8.1%), and Poland (7.4%) (Eurostat, 2019).
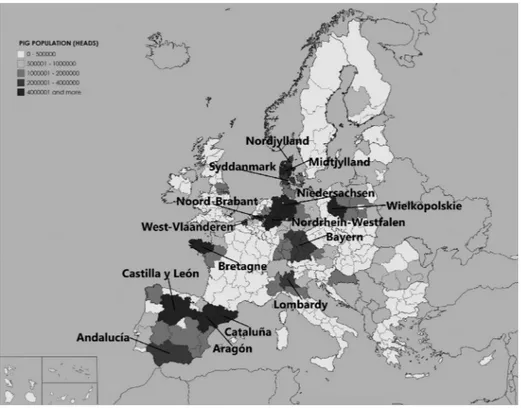
The population distribution of live pigs in Europe in the year 2017 shows that pig breeding (and, in particular, intensive farming) is characterized by a strong territorial concentration.
In figure 1, the darker the colour, the larger the pig populations. The figure shows that the production is distributed over a large part of the national territory, although with different intensity in the countries with the highest number of bred animals (Spain and Germany, but also in Denmark and the Netherlands). In Spain, the highest density of live animals is found in the northern regions (Catalonia, Castilla, Aragon, Andalucia), and in Germany the eastern regions (Bayern). In other countries, the production is localized in a few regions, like Lombardy (in Italy), Wielkopolskie (in Poland) and Brittany (in France).
In these regions, the number of pigs reared ranges between 2 and 4 million and in some areas this number exceeds 4 million units. Areas with a medium intensity of production have values between 1 and 2 million head, while the remaining regions characterized by a lower production intensity produce less than a million heads per year.
The chart is interesting if matched with the social network analysis of pig production carried out in the next section, as of the relations between breeding and market exchanges.
Figure 1 - Pig population in the European Union (1,000 heads; 2017)
Source: elaborations on Eurostat.
3.2. Analysis of trade relationships in European Union
3.2.1. Net Export of Pig Meat and Pig products in European Union
Tables 1 and 2 focus on trade relationships of the EU-28 countries by differentiating between fresh/frozen pig meat (table 1) and transformed pig products (table 2). In particular, Panel C of table 1 reports the variation of pig meat net exports for the EU-28 countries for the period 2000-2016, while the same data for the sub-periods 2000-2010 and 2010-2016 are displayed in Panels A and B respectively. The first column of each panel reports the absolute variation per country in millions of tonnes; the second column refers to the relative variation (%) of net exports for the EU-28 as a whole (specifically, the ratio between the variation in net export of the country and the variation for the whole EU-28).
Ta bl e 1 - Tr ad e re la ti on sh ip s: E U N et E xp or t P ig M ea t P anel A P anel B P anel C Country Δ net exports 2000-2010 Country Δ net exports 2010-2016 Country Δ net exports 2000-2016 million tons % million tons % million tons % German y 620.897 74,27 Spain 573.135 33,01 German y 1.059.587 41,19 Spain 293.948 35,16 German y 438.690 25,26 Spain 867.083 33,71 France 188.923 22,60 Denmark 291.502 16,79 Denmark 459.891 17,88 Denmark 168.389 20,14 Netherlands 198.809 11,45 Belgium 281.563 10,95 Belgium 141.463 16,92 Belgium 140.100 8,07 France 225.960 8,78 Austria 29.216 3,49 Ireland 102.075 5,88 Netherlands 147.696 5,74 Greece 27.671 3,31 United Kingdom 66.182 3,81 Ireland 95.228 3,70 Sweden 10.721 1,28 Romania 41.241 2,38 Austria 20.426 0,79 Finland 7.307 0,87 France 37.037 2,13 Portug al 20.381 0,79 Cyprus 2.212 0,26 Portug al 18.850 1,09 Finland 12.450 0,48 Portug al 1.531 0,18 Lithuania 13.685 0,79 Lux embour g 3.619 0,14 Lux embour g 965 0,12 Finland 5.143 0,30 Sweden 1.868 0,07 Estonia 777 0,09 Latvia 3.891 0,22 Estonia 986 0,04 Malta 73 0,01 Lux embour g 2.654 0,15 Malta 99 0,00 Ireland –6.847 –0,82 Italy 2.426 0,14 Greece –1.677 –0,07 Croatia –8.159 –0,98 Hung ary 2.424 0,14 Cyprus –4.262 –0,17 Latvia –16.544 –1,98 Estonia 209 0,01 Latvia –12.653 –0,49
P anel A P anel B P anel C Country Δ net exports 2000-2010 Country Δ net exports 2010-2016 Country Δ net exports 2000-2016 million tons % million tons % million tons % Slo venia –17.900 –2,14 Malta 26 0,00 Croatia –18.593 –0,72 Hung ary –23.433 –2,80 Slo venia –2.172 –0,13 UK –19.607 –0,76 Bulg aria –31.076 –3,72 Cyprus –6.474 –0,37 Slo venia –20.072 –0,78 Lithuania –35.142 –4,20 Bulg aria –7.156 –0,41 Hung ary –21.009 –0,82 Slo vakia –38.904 –4,65 Austria –8.790 –0,51 Lithuania –21.457 –0,83 Czechia –48.886 –5,85 Sweden –8.853 –0,51 Bulg aria –38.232 –1,49 Netherlands –51.113 –6,11 Croatia –10.434 –0,60 Romania –44.815 –1,74 United Kingdom –85.789 –10,26 Greece –29.348 –1,69 Slo vakia –80.756 –3,14 Romania –86.056 –10,29 Czechia –38.028 –2,19 Czechia –86.914 –3,38 Poland –93.513 –11,19 Slo vakia –41.852 –2,41 Italy –112.305 –4,37 Italy –114.731 –13,72 Poland –48.587 –2,80 Poland –142.100 –5,52 EU28 836.000 100,00 EU28 1.736.385 100,00 EU28 2.572.385 100,00 So urc e: el ab or at ion s on E ur os ta t. Ta bl e 1 - C on ti nu ed
Ta bl e 2 - Tr ad e R el at io ns hi ps : E U N et E xp or t P ig pr od uc ts P anel A P anel B P anel C Country Δ net exports 2000-2010 Country Δ net exports 2010-2016 Country Δ net exports 2000-2016 million tons % million tons % million tons % German y 1.065.072 128,16 Denmark –381.671 84,46 German y 1.164.666 307,17 Spain 430.841 51,84 Belgium –201.010 44,48 Spain 585.044 154,30 Austria 59.266 7,13 France –98.213 21,73 Austria 59.866 15,79 Denmark 26.124 3,14 Netherlands –80.186 17,74 Poland 49.855 13,15 Portug al 26.124 3,14 Hung ary –33.840 7,49 Portug al 44.116 11,64 Belgium 25.889 3,12 Croatia –32.244 7,14 Greece 20.665 5,45 Greece 3.455 0,42 Czechia –20.329 4,50 Italy 6.229 1,64 Estonia 2.822 0,34 Lithuania –13.390 2,96 Estonia 2.937 0,77 Netherlands 722 0,09 Slo vakia –12.929 2,86 Slo venia 2.284 0,60 Finland –772 –0,09 Finland –10.948 2,42 Lux embour g –3.111 –0,82 Slo venia –951 –0,11 Cyprus –3.007 0,67 Cyprus –5.203 –1,37 Cyprus –2.196 –0,26 Latvia –2.411 0,53 Malta –5.617 –1,48 Lux embour g –3.151 –0,38 Malta –2.256 0,50 Finland –11.720 –3,09 Malta –3.361 –0,40 Bulg aria –35 0,01 Ireland –14.141 –3,73 Latvia –14.098 –1,70 Lux embour g 40 –0,01 Latvia –16.509 –4,35 Ireland –15.326 –1,84 Estonia 115 –0,03 Sweden –23.727 –6,26 Croatia –18.303 –2,20 Austria 600 –0,13 Lithuania –34.083 –8,99
P anel A P anel B P anel C Country Δ net exports 2000-2010 Country Δ net exports 2010-2016 Country Δ net exports 2000-2016 million tons % million tons % million tons % Lithuania –20.693 –2,49 United Kingdom 1.023 –0,23 Croatia –50.547 –13,33 Italy –27.937 –3,36 Ireland 1.185 –0,26 Slo vakia –65.010 –17,15 Sweden –31.866 –3,83 Slo venia 3.235 –0,72 Bulg aria –70.491 –18,59 Poland –47.258 –5,69 Romania 5.970 –1,32 Netherlands –79.464 –20,96 Slo vakia –52.081 –6,27 Sweden 8.139 –1,80 Romania –91.019 –24,01 Bulg aria –70.456 –8,48 Greece 17.210 –3,81 Hung ary –108.992 –28,75 Hung ary –75.152 –9,04 Portug al 17.992 –3,98 Czechia –117.844 –31,08 France –95.613 –11,51 Italy 34.166 –7,56 United Kingdom –134.530 –35,48 Romania –96.989 –11,67 Poland 97.113 –21,49 Belgium –175.121 –46,19 Czechia –97.515 –11,73 German y 99.594 –22,04 France –193.826 –51,12 United Kingdom –135.553 –16,31 Spain 154.203 –34,12 Denmark –355.547 –93,77 EU28 831.044 100,00 EU28 –451.884 100,00 EU28 379.160 100,00 So urc e: el ab or at ion s on E ur os ta t. Ta bl e 2 - C on ti nu ed
Table 1 – Panel C shows that the EU-28 has increased its pig meat net exports to about 2,572,385 million tonnes from 2000 to 2016. Germany is the country that has contributed most to such variation (40%, i.e. more than 1 billion); Spain also contributed substantially to the EU-28 increase of net exports as it has raised net export by about 34% (again relative to the whole EU-28 area). Denmark, Belgium and France also provided a positive contribution by increasing their net exports of about 18, 11 and 9 percent of the EU-28, respectively. By contrast, the variations of the remaining countries are rather more limited.
Panels A and B of table 1 show that the whole EU-28 area increased its pig meat net exports of 836,000 million tonnes of pig meat from 2000 to 2010, and of 1,736,385 from 2010 to 2016. Germany, Spain, Denmark and Belgium have experienced a raise in pig meat net exports in both sub-periods, while the increase in net exports of France has taken place mostly from 2000 to 2010. From Panel A we observe a reduction in net exports of more than 10% (relative to the increase for the EU28) in Italy, Poland, Romania and the United Kingdom. In the period 2010-2016, there are no countries with a significant reduction of net exports.
Table 2 shows the variation of pig products net exports for the EU-28 countries; Panel C refers to the period 2000-2016, while the data for the sub-periods 2000-2010 and 2010-2016 are reported in Panels A and B, respectively. From Panel C we observe that the whole EU-28 area has increased its pig products net exports of about 379,160 million of tonnes from 2000 to 2016. Germany is the country that has contributed more to such variation by increasing its net exports of more than three times of this amount, i.e. of 1,164,666 million of tonnes, while the increase of net exports by Spain account for about one and a half times the amount of the EU-28 area. Austria, Poland and Portugal also contributed positively to the increase of net exports as their net exports increase account for about 16, 13, 12 percent of the one of the EU-28. On the contrary, Denmark, France and Belgium have experienced the largest reductions of pig products net exports: the size of such decrease is about 94, 51 and 46 percent of the
EU-28, respectively1.
Again, the other two panels of table 2 show that the variation of net exports for the whole EU-28 area has been positive in the period 2000-2010 and negative in the period 2010-2016. In particular, the EU-28 has increased the net export of pig products by 831,044 million of tonnes from 2000 to
1. The countries that have experienced a reduction of net exports larger than ten percent of the one of the EU-28 are: the UK, Czechia, Hungary, Romania, Netherlands, Bulgaria, Slovakia and Croatia. The variations of the remaining countries are within ten percentage points (positive or negative) of the EU-28.
2010 (see Panel A), while it has experienced a reduction of 451,884 million of tonnes from 2010 to 2016 (see Panel B). In Panel A, we can observe that Germany and Spain are the countries with the largest increase in net exports, while the UK, Czechia, Romania and France are the countries with the largest reductions of net exports (i.e. more than ten percentage points relative to the size of the positive variation of the EU-28). Panel B shows that the reductions of net exports of the EU-28 is mainly due to Denmark, Belgium, France and the Netherlands: their net exports dropped by about 84, 44, 22 and 18 percent of the EU-28, respectively. Conversely, Spain, Germany and Poland provided a positive contribution to the net exports of pig products: their numbers grew more than twenty percent of the (negative) size of the variation for EU-28.
This analysis shows that Germany has the most diversified value chain: it is characterized by a relevant activity in breeding, fattening, slaughtering and processing, mainly due to the large dimensions of some German multinationals that integrate and control the entire value chain (Barberis et
al., 2020). Also, Germany is a great exporter of final products, followed by
Spain. Poland seems to follow the German model, albeit on a smaller scale and is more focused on the transformation phase. Denmark exports all kinds of outputs: not only live pigs and pig meat, as it is considerably specialised in the slaughtering phase, but also pig meat products.
3.2.2. Network analysis
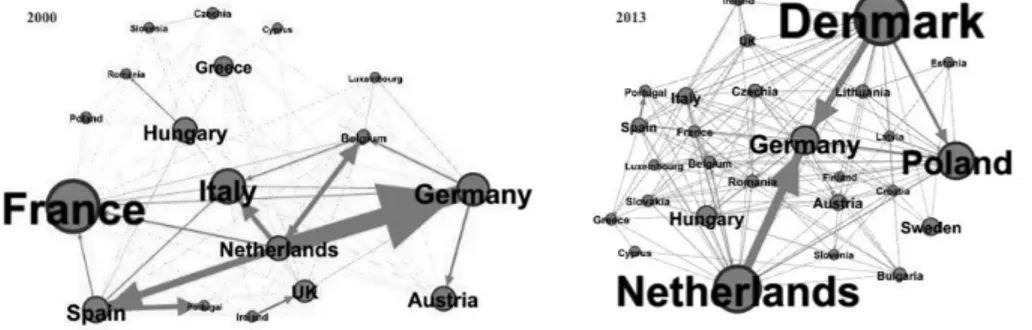
Figure 2 and 3 show the results of the social network analysis applied to the EU-28 countries trade relationships. In particular, in figure 2 the EU-28 trade relationships relative to live pigs are analysed, whereas figure 3 depicts the EU-28 trade relationships relative to pig meat (fresh/frozen) and pig meat products. These networks are built from bilateral commercial matrices considering both export and import flows (whether it is quantity, heads or tonnes, or value in $) (Barberis et al., 2020).
In these graphic representations, the dimension of the circle points provides a measure of the role-centrality in trade relationships: the larger the points, the higher are the connections with other countries. Arrows represent trade flows. For instance, an arrow from Belgium pointing to Italy indicates an export flow from Belgium to Italy. The dimension of the arrows is a proxy of the volume of exchanges: the more consistent the flow, the thicker the arrow. The direction indicates the movement of goods (i.e., live pigs or pig meat and products). The colours of the circles represent the “communities”: countries belonging to one community tend to have more exchanges within the community rather than with other countries.
This network analysis focussed on two types of analysis referred to market exchanges and their evolution during the reference periods. First, the “community detection” allows us to identify the main “communities” on the map. That is, clusters of countries with more exchange relationships. Distance often plays a key role: usually neighbouring countries – in geographical, historical and cultural terms – end up in the same community. Different communities are associated with different colours of nodes and arrows. Second, we focussed on betweenness centrality, aimed at identifying nodes (in our case: countries) with a primary role in the network. Countries with a higher betweenness centrality value are the most important nodes for the connection of the whole network, and differ from the others because they have a bigger dimension (i.e. larger size of the circle).
Figure 2 represents live pig trade relationships in 2000 and 2013, and shows an increased network complexity: exchanges among EU countries intensified, and more countries are now part of the continental pork value chain. Significant changes affected most countries – more in terms of connections than in volumes: for example, countries like Denmark, the Netherlands and, to a lesser extent, Poland, that were marginal in 2000, became central in 2013. On the other hand, France and Italy lost their relevance.
Looking at the directions of the arrows, we can see that the Netherlands maintain its role of supplier of live pigs (especially for Germany), but also extended exports towards other countries (mainly in Central and Eastern Europe). Denmark is mostly related to Germany and Poland, plus some other smaller trade relationships with Northern European and Baltic countries. Poland gains a central trade role, mainly receiving live pigs from a large number of countries.
To sum up, the Netherlands and Denmark have become great producers and exporters of live animals – fattened and slaughtered in other countries, for which the slaughtering phase is consequently particularly important: in fact the main destinations are Germany and Poland).
The single market has clearly played a key role in facilitating trade between neighbouring countries, allowing a connection between live pig networks and pork meat networks (i.e. between production and transformation).
Figure 3 represents the pig meat and pig products trade relationships in 2000 and 2016. The trade here is driven by two elements: the fresh or frozen meat that comes from the slaughtering phase and moves to the transformation industries in other countries, and the import-export movements of final meat products.
Here again, the network analysis suggests that the value chains have become much more complex in that 16-year span. Countries like Belgium and Greece, playing a central role in the EU-28 exchanges in 2000, are no longer market leaders in 2016. Poland and Denmark, which are central to the live
Figure 2 - Trade relationships: live pigs (heads; 2000-2013)
Source: elaboration on fao Statistics, reproduced from Barberis et al. (2020).
Figure 3 - Trade relationships: pig meat and pig meat products (tonnes; 2000-2016)
Source: elaboration on fao Statistics, reproduced from Barberis et al. (2020).
pig market, seem to be not so relevant in the trade of pork meat. In contrast, countries like Italy and Spain, which had a minor role in 2000, seem to be among the leading countries in 2016.
The experience of these latter two countries is interesting, as it may mirror significant structural changes in this sector. Interestingly, in 2000 Italy and Spain were central in the live pig trade and had a subordinate role in the meat market. Later on in 2013 and 2016 the situation was reversed: these two countries lost positions in the trade of live pigs and became more relevant in the pig meat trade. Both countries are key producers of traditional foods (Antonelli & Viganò, 2018), also registered as Protected Designation of Origin (pdo). The Spanish industrial production is specialised in ham and pig population at the same time: as a consequence, Spain retains legs of pork for
the production of Jamon Serrano, and exports the left over carcasses to the rest of Europe for other kinds of processing. This is probably the reason why, in figure 3, Spain has more arrows, which include the distribution of both pig meat products (mainly Jamon Serrano) and pork meat as an intermediate product. The case of Italy is somehow different, as it imports a great amount of fresh/frozen pig meat (mainly from Germany and Spain) to produce different products (not only pdo), that are then exported. So, as opposed to Spain, Italy has a larger circle in the graph.
Looking at the wider picture, we can describe four communities: one is very large and includes Northern, Central, and Eastern countries; two, much smaller, are headed by Italy and Spain; the last one is very small and includes the UK and Ireland. If we look at the volume of trade (the dimension of the arrows), we can see high volumes of pig meat and pig meat products from Denmark to Germany and the UK, and from Germany to Italy.
4. Discussion and conclusions
The analysis presented in this article shows a quite fast and extensive transformation of the pork chain in Europe, with an increase in connections and evolving specializations. Different forms of market integration are in the running: from a territorial point of view, at interregional and international level (plus, in the frame of more and more globalizing intercontinental markets not
analysed here, see Szymańska, 2017). While from an organizational point of
view, there are vertical and horizontal forms of integration.
In the pig supply chain, this led to a review of the procurement strategies of companies, with consequent exchanges in trade between countries, highlighted by the network analysis that shows an increase of live pig exchanges among a major number of EU countries in the period considered. In particular, it is interesting to note that some countries, important producers of quality goods, such as Italy and Spain, have changed their position in the trade network, adopting different strategies. Spain somehow maintains the production of raw material for national processing (exporting only the lowest quality pieces), while Italy imports a great amount of fresh/frozen meat (mainly from Germany and Spain) to produce different products, which are then exported. This has several implications for business strategies, for example, for communication strategies. Changes in procurement would, in fact, require action to reduce the information asymmetry of consumers, as the geographical origin of raw materials is particularly important for quality products and equally difficult to recognize (Grolleau & Caswell, 2006; Antonelli & Viganò, 2009; Verbeke et al., 2016). But this is only part of the issue.
The trade changes we observed in this article are part of a more “invasive” restructuration of the sectors: the spread of the industrial agricultural/ livestock model has lead to higher volumes with more intensive production – to the detriment of environmental and social sustainability (Sturla et al., 2019). National and international business integration somehow implies also to jeopardize small scale producers and labour conditions.
Such evidence shall be related with potential ripple effects and patterns in related fields, as they show a tension over the profitability and social, environmental and economic sustainability of this chain – issues that call for further research integrating interdisciplinary perspectives on the economic, sociological and legal dimensions of the chain. In effect, such an international reorganization means that labour, regulation, environment are under constant pressure, and challenge the usual, nation-State-centred governance of the industry.
Analysing how value chains reorganize as they become more and more internationalized, if not globalized, means focussing on one of the most relevant transformations in post-Fordist capitalism, even though we can debate at length if we see a radically new phenomenon or not. Analysing value chains means focussing on networks of inputs and outputs, and the resulting added value in its multifunctional characteristics (Fagioli et al., 2017); on localization processes; on institutional and governance processes and structures influencing production networks (Gereffi & Korzeniewicz, 1994).
Not rarely, business and policy analyses of the internationalization of value chains tend to consider different dimensions of globalization as watertight compartments. On the contrary, mobilities of goods, services, people, money – and even ideas – are mutually and simultaneously constitutive of the new international division of labour (Grieco & Urry, 2016). Changes in production chains do imply changes in labour structure and mobility (as it is particularly evident in the case of posted workers in the pig sector in Europe), and it is a challenge for regulating and managing negative externalities of such market exchanges. Economic networks, while prone to disembedding, are anyway embedded in social and institutional arenas – and need to be such to reduce negative externalities.
While markets seem to be more and more “boundless”, path-dependent institutional legacies and new regulative efforts enter the game, in complex normative landscapes: assembling and disassembling norms, institutions and authorities is part of the globalization processes (Sassen, 2008), making some mobilities easier or harder in specific time-space fixes. This may well apply to markets – and to the market analysed here (regarding the import and export of semi-finished and final products, according to barriers motivated by food safety, commercial reciprocity, and so on), to related environmental concerns, and to the labour force (with the complex stratification of rights
and wages among workers by origin, gender, social class, type of contract, etc.). The evidence of the shifting boundaries in a globalizing sector shown here, have deep implications for the political and economic governance of agri-food sectors. This is because they are continuously being rescaled, making boundaries permeable as well as variable (Brenner, 2004), and this both challenges existing regulations and shows the need for new national and international regulations.
Acknowledgments
Work developed with the financial support from the European Union Meat-up Ffire Project- G.A. no VS/2018/0014. European Commission/Employment, Social Affairs and Inclusion DG/EMPL.A.2-Social Dialogue.
References
Acemoglu, D., Carvalho, V., Ozdaglar, A. & Tahbez-Salehi, A. (2012). The Network Origins of Aggregate Fluctuations. Econometrica, 80(5), 1977-2016, doi: 10.3982/ ecta9623.
Alatriste-Contreras, M. & Fagiolo, G. (2014). Propagation of Economic Shocks in Input-Output Networks: A Cross-Country Analysis. Physical Review E, 90(60), doi: 10.1103/PhysRevE.90.062812.
Amador, J. & Cabral, S. (2016). Networks of Value Added Trade. The World
Economy, 40(7), 1291-1313, doi: 10.1111/twec.12469.
Antonelli, G. & Viganò, E. (2009). L’economia dei prodotti agroalimentari tipici tra vincoli tecnici e sfide organizzative. Italian Journal of Agronomy, 4(3), 125-136, doi: 10.4081/ija.2009.s3.125.
Antonelli, G. & Viganò, E. (2018). Global Challenges in Traditional Food Production and Consumption. In A. Cavicchi & C. Santini (Eds.), Case Studies in the Traditional
Food Sector (pp. 25-46). Elsevier, doi: 10.1016/b978-0-08-101007- 5.00003-8.
Barberis, E., Freddi, D. Giammetti, R., Polidori, P., Teobaldelli D. & Viganò, E. (2020). Structural characteristics of the European pork value chain: a quantitative analysis. In P. Campanella & D. Dazzi (Eds.), MEAT-UP FFIRE Fairness,
freedom and industrial relations across Europe: up and down the meat value chain. Milano: FrancoAngeli.
Barsing, P., Daultani, Y., Vaidya, O.S. & Kumar, S. (2018). Cross-docking Centre Location in a Supply Chain Network: A Social Network Analysis Approach,
Global Business Review, 19(3) suppl.: S218-S234, doi: 10.1177/0972150918757847. Blondel, V.D., Guillaume, J.-L., Lambiotte, R. & Lefebvre, E. (2008). Fast unfolding of communities in large networks. Journal of Statistical Mechanics: Theory and
Bramoullé, Y., Galeotti, A. & Rogers, B. (2016). The Oxford Handbook of the
Economics of Networks. Oxford: Oxford University Press, doi: 10.1093/ oxfordhb/9780199948277.001.0001.
Brenner, N. (2004). New State Spaces. Oxford: Oxford University Press.
Brinkley, C. (2017). Visualizing the social and geographical embeddedness of local food systems. Journal of Rural Studies, 54, 314-325, doi: 10.1016/j. jrurstud.2017.06.023.
Caldarelli, G. (2007). Scale-free Networks: Complex Webs in Nature and Technology. Oxford: Oxford University Press, doi: 10.1093/acprof:oso/9780199211517.001.0001. Camanzi, L., Bartoli, G., Biondi, B. & Malorgio, G. (2018). A Structural-Functional
Theory approach to vertical coordination in agri-food supply chains: insights from the “Gran Suino Italiano” Inter-branch Organisation. Economia Agro-Alimentare/
Food Economy, 20(2), 169-180, doi: 10.3280/ECAG2018-002003.
Carvalho, V.M., Nirei M., Saito, Y.U. & Tahbaz-Salehi, S. A. (2016). Supply Chain Disruptions: Evidence from the Great East Japan Earthquake, Columbia Business
School Research Paper, n. 17-5, doi: 10.2139/ssrn.2883800.
Castells, M., (2004). The Network Society: A Cross-cultural Perspective. Edward Elgar, doi: 10.4337/9781845421663.
Chiffoleau, Y. & Touzard, J. (2014). Understanding local agri-food systems through advice network analysis. Agriculture and Human Values, 31(1), 19-32, doi: 10.1007/s10460-013-9446-6.
Chinazzi, M. & Fagiolo, G. (2013). Systemic risk, contagion, and financial networks: A survey. SSRN Electronic Journal, doi: 10.2139/ssrn.2243504.
Crespo, J., Réquier-Desjardins D. & Vicente, J. (2014). Why can collective action fail in Local Agri-food Systems? A social network analysis of cheese producers in Aculco, Mexico, Food Policy, 46: 165-177, doi: 10.1016/j.foodpol.2014.03.011. Criscuolo, C. & Timmis, J. (2018). gvcs and centrality: Mapping key hubs, spokes
and the periphery. oecd Productivity Working Papers, No. 12, oecd Publishing,
Paris, doi: 10.1787/d4a9bd6f-en.
De Benedictis, L. & Tajoli, L. (2011). The World Trade Network. The World
Economy, 34(8), 1417-1454, doi: 10.1111/j.1467-9701.2011.01360.x.
De Boni, A., Pulina, P. & Roma, R. (2016). Adaptation processes of agro-food companies toward responsibility. Economia Agro-Alimentare/Food Economy, 18(1), 13-38, doi: 10.3280/ECAG2016-001002.
Delli Gatti, D., Gaffeo, E., Gallegati, M., Giulioni, G., Kirman, A., Palestrini, A. & Russo, A. (2007). Complex dynamics and empirical evidence. Information
Sciences, 177(5), 1204-1221, doi: 10.1016/j.ins.2006.08.003.
Dolman, M.A., Vrolijk, H.C.J. & de Boer, I.J.M. (2012). Exploring variation in economic, environmental and societal performance among Dutch fattening pig farms. Livestock Science, 149(1-2), 143-154, doi: 10.1016/j.livsci.2012.07.008. Economidies, N. (1996). The Economics of Networks. International Journal of
Industrial Organization, 14, 673-699.
European Commission (2018). EU Farm Economics Overview based on 2015 (and 2016) fadn data, [https://ec.europa.eu/info/sites/info/files/food-farming-fisheries/ farming/documents/eu-farm-economics-overview-2015_en.pdf].
Eurostat (2019). Agriculture, forestry and fishery statistics, Luxembourg: Publications Office of the European Union [https://ec.europa.eu/eurostat/
documents/3217494/10317767/KS-FK-19-001-EN-N.pdf/742d3fd2-961e-68c1-47d0-11cf30b11489].
Fagioli, F.F., Rocchi, L., Paolotti, L., Słowiński, R. & Boggia, A. (2017). From the farm to the agri-food system: A multiple criteria framework to evaluate extended multi-functional value. Ecological Indicators, 79, 91-102, doi: 10.1016/j. ecolind.2017.04.009.
Fagiolo, G., Reyes, J. & Schiavo, S. (2010). The evolution of the world trade web: a weighted – network analysis. Journal of Evolutionary Economics, 20(4), 479-514, doi: 10.1007/s00191-009-0160-x.
Farmer, J.D., Gallegati, M., Hommes, C., Kirman, A., Ormerod, P., Cincotti, S., Sanchez, A. & Helbing, D. (2012). A complex systems approach to constructing better models for managing financial markets and the economy. The European
Physical Journal Special Topics, 214(1): 295-324, doi: 10.1140/epjst/e2012-01696-9. Ferretti, A. (2016). Il pericolo sovrapproduzione. Suinicoltura, 1, 28-30.
Focacci, M., De Meo, I. & Paletto, A. (2018). Relationship between innovation and networks in chestnut value chain: A case study in Italy, Journal of Forest Science, 64(1), 43-51, doi: 10.17221/104/2017-JFS
Gallegati, M., Keen, S., Lux, T. & Ormerod, P. (2006). Worrying trends in econophysics. Physica A: Statistical Mechanics and its Applications, 370(1), 1-6, doi: 10.1016/j.physa.2006.04.029.
Gereffi, G. & Korzeniewicz, M. (eds.) (1994). Commodity Chains and Global
Capitalism, Praeger: Westoport.
Giammetti, R., Russo, A. & Gallegati, M. (2020). Key Sectors in Input-Output Production Networks: An Application to Brexit. The World Economy, doi: 10.1111/twec.12920.
Goyal, S. (2007). Connections: An Introduction to the Economics of Networks. Princeton University Press.
Grieco, M. & Urry, J. (Eds.) (2016). Mobilities. London: Routledge.
Grolleau, G. & Caswell, J.A. (2006). Interaction Between Food Attributes in Markets: The Case of Environmental Labeling. Journal of Agricultural and
Resource Economics, 31(3), 471-484.
Hoste, R. (2020). International comparison of pig production costs 2018. Wageningen
Economic Research report 2020-007, doi: 10.18174/511876.
Jackson, M.O. (2008). Social and Economic Networks. Princeton NJ: Princeton University Press, doi: 10.1177/02685809100250050902.
Kelley, S., Goldberg, M., Magdon-Ismail, M., Mertsalov, K. & Wallace, A. (2012). Defining and Discovering Communities in Social Networks. In: Thai, M. & Pardalos, P. (Eds), Handbook of Optimization in Complex Networks. Springer Optimization and Its Applications, 57, 139-168, Springer, Boston, MA, doi: 10.1007/978-1-4614-0754-6_6.
Labajova, K., Hansson, H., Asmild, M., Goransson, L., Lagerkvist, C-J. & Neil, M. (2016). Multidirectional analysis of technical efficiency for pig production systems: The case of Sweden, Livestock Science, 187, 168.180, doi: 10.1016/j. livsci.2016.03.009.
Maples, J.G., Lusk, J.L. & Peel, D.S. (2016). Coordinating Supply Chains to
Economics Association’s 2016 Annual Meeting (pp. 1-22), San Antonio, Texas, February, 6‐9.
Mariani, A. & Viganò, E. (2013). Il Commercio equo: un modello replicabile per lo sviluppo sostenibile. Rivista di Studi sulla Sostenibilità, 1, 149-161, doi: 10.3280/ riss2013-001012.
Newman, M. (2010). Networks: An Introduction. New York, NY, usa: Oxford University Press, Inc.
Rosser, J.B. (2003). Complexity in economics. Cheltenham: Edward Elgar.
Sassen, S. (2008). Territory, Authority and Rights. Princeton: Princeton University Press, doi: 10.1515/9781400828593.
Schweitzer, F., Fagiolo, G., Sornette, D., Vega-Redondo, F., Vespignani, A. & White, D.R. (2009). Economic Networks: The New Challenges. Science, 325 (5939), 422-425, doi: 10.1126/science.1173644.
Sturla, A., Viganò, E. & Viganò, L. (2019). The Organic Districts in Italy. An Interpretative hypothesis in the Light of the Common Pool Resources Theory.
Food Economy, 21(2), 429-458, doi: 10.3280/ECAG2019-002013.
Szymańska, E.J. (2017). The Development of the Pork Market in the World in Terms of Globalization. Journal of Agribusiness and Rural Development, 4(46), 843-850, doi: org/10.17306/J.JARD.2017.00362.
Tacchella, A., Cristelli, M., Caldarelli, G., Gabrielli, A. & Pietronero, L. (2012). A New Metrics for Countries’ Fitness and Products’ Complexity. Scientific Reports
2, 723, doi: 10.1038/srep00723, doi: 10.1109/ICDM.2013.167.
Verbeke, W., Guerrero, L., Almli, V.L., Vanhonacker, F. & Hersleth, M. (2016). European Consumers’ Definition and Perception of Traditional Foods. In: K. Kristbergsson & J. Oliveira (Eds), Traditional Foods. Integrating Food Science
and Engineering Knowledge Into the Food Chain (pp. 3-16). Boston, MA: Springer, doi.org/10.1007/978-1-4899-7648-2_1.
Viganò, E., Gori, F. & Amicucci, A. (2019). Value-enhancement of quality food products: the case of truffle. Economia Agro-Alimentare/Food Economy, 21(3), 587-611, doi:10.3280/ECAG2019-003002.
Yang, J., McAuley, J. & Leskovec, J. (2013). Community Detection in Networks with Node Attributes, 2013 IEEE 13th International Conference on Data Mining, Dallas, TX, pp. 1151-1156. 10.1109/ICDM.2013.167.
Zhu, Z., Puliga, M., Cerina, F., Chessa, A. & Riccaboni, M. (2015). Global Value Trees. PLoS ONE, 10(5), e0126699, doi: 10.1371/journal.pone.0126699.
Eduardo Barberis
Department of Economy, Society, Politics, University of Urbino Carlo Bo Via A. Saffi, 15 - 61029 Urbino (PU), Italy
Tel: +39 0722 305745, E-mail: [email protected]
Degree in Sociology (Urbino, 2001), PhD in Urban and Local European Studies (Milan-Bicocca, 2007). Associate Professor in Spatial and Environmental Sociology since August 2019.
Current research interests include the territorial dimension of welfare policy and immigration processes, with particular attention on topics like minority entrepreneurship, discrimination, small-town society and economy.
Daniela Freddi
Ires Emilia-Romagna
Via G. Marconi, 69 - 40122 Bologna, Italy
Tel: +39 051 294011, E-mail: [email protected]
Holds a degree in Political Sciences (Bologna, 2002), MSc in Industry and Innovation Analysis (Sussex, 2005), PhD in Industrial Economics (Ferrara, 2008).
Researcher at Ires Emilia-Romagna since April 2009
Current research interests include innovation, industrial evolution, regional economy.
Raffaele Giammetti
Department of Economics, Marche Polytechnic University Giorgio Fuà Piazzale Martelli, 8 - 60121 Ancona, Italy
Tel: +39 071 2207112, E-mail: [email protected]
Holds a Master of Science in Economics (Marche Polytechnic University, Ancona, 2016) and a PhD in Economics (Marche Polytechnic University, Ancona, 2019). He is Postdoctoral Researcher in Economics at Marche Polytechnic University since 2019.
His main research interests include Economic Networks, the Economics of Money, Banking and Financial Markets, and Structural Change Dynamics, with a particular focus on Growth and Distribution, and Economic Divergences.
Paolo Polidori
Department of Law, University of Urbino Carlo Bo Via G. Matteotti 1 - 61029 Urbino (PU), Italy.
Tel: +39 0722 303200, E-mail: [email protected]
Degree in Economics (University of Urbino, 1989), PhD in Political Economy (Marche Polytechnic University, Ancona, 1994), Master’s degree in Environmental Economics (University College London, 1992).
Associate Professor of Public Finance Science since 2004.
He teaches Public Finance and Analysis and Evaluation of Public Policies.
His research activity has focused on public policy, theory of local public services, theory of evaluation, economic analysis of law and recently on immigration policies.
Désirée Teobaldelli
Department of Law, University of Urbino Carlo Bo, Italy Via G. Matteotti, 1 - 61029 Urbino (PU), Italy
Tel: +39 0722 303208, E-mail: [email protected]
Holds a Master of Science in Economics (Marche Polytechnic University, Ancona, 2004) and a PhD in Economics (Marche Polytechnic University, Ancona, 2007). Associate Professor of Public Finance since 2019.
Her main research interests include Federalism, Shadow Economy, Tax Morale, Corruption and Identity, with particular focus on understanding the role of institutional quality in shaping economic outcomes and behaviour of individuals.
Elena Viganò
Department of Economics, Society and Politics, University of Urbino Carlo Bo Via A. Saffi, 42 - 61029 Urbino (PU), Italy
Tel: +39 0722 305510, E-mail: [email protected]
Degree in Agricultural Sciences (Perugia, 1987), Diploma of specialization in Agricultural Economics (Portici, 1991), PhD in Agricultural Economics and Politics (Napoli, 1995).
Researcher at the University of Naples “Federico II” (1994-1998) and at University of Urbino Carlo Bo (1998-2001). Full professor since 2019.
Current research interests include the analysis of strategies and politics for the sustainability of the agri-food system, with specific topics regarding environmental impacts of agricultural production, quality and food safety, organic farming, ethical and fair trade.