ScienceDirect
Available online at Available online at www.sciencedirect.comwww.sciencedirect.com
ScienceDirect
Energy Procedia 00 (2017) 000–000
www.elsevier.com/locate/procedia
1876-6102 © 2017 The Authors. Published by Elsevier Ltd.
Peer-review under responsibility of the Scientific Committee of The 15th International Symposium on District Heating and Cooling.
The 15th International Symposium on District Heating and Cooling
Assessing the feasibility of using the heat demand-outdoor
temperature function for a long-term district heat demand forecast
I. Andrić
a,b,c*, A. Pina
a, P. Ferrão
a, J. Fournier
b., B. Lacarrière
c, O. Le Corre
caIN+ Center for Innovation, Technology and Policy Research - Instituto Superior Técnico, Av. Rovisco Pais 1, 1049-001 Lisbon, Portugal bVeolia Recherche & Innovation, 291 Avenue Dreyfous Daniel, 78520 Limay, France
cDépartement Systèmes Énergétiques et Environnement - IMT Atlantique, 4 rue Alfred Kastler, 44300 Nantes, France
Abstract
District heating networks are commonly addressed in the literature as one of the most effective solutions for decreasing the greenhouse gas emissions from the building sector. These systems require high investments which are returned through the heat sales. Due to the changed climate conditions and building renovation policies, heat demand in the future could decrease, prolonging the investment return period.
The main scope of this paper is to assess the feasibility of using the heat demand – outdoor temperature function for heat demand forecast. The district of Alvalade, located in Lisbon (Portugal), was used as a case study. The district is consisted of 665 buildings that vary in both construction period and typology. Three weather scenarios (low, medium, high) and three district renovation scenarios were developed (shallow, intermediate, deep). To estimate the error, obtained heat demand values were compared with results from a dynamic heat demand model, previously developed and validated by the authors.
The results showed that when only weather change is considered, the margin of error could be acceptable for some applications (the error in annual demand was lower than 20% for all weather scenarios considered). However, after introducing renovation scenarios, the error value increased up to 59.5% (depending on the weather and renovation scenarios combination considered). The value of slope coefficient increased on average within the range of 3.8% up to 8% per decade, that corresponds to the decrease in the number of heating hours of 22-139h during the heating season (depending on the combination of weather and renovation scenarios considered). On the other hand, function intercept increased for 7.8-12.7% per decade (depending on the coupled scenarios). The values suggested could be used to modify the function parameters for the scenarios considered, and improve the accuracy of heat demand estimations.
© 2017 The Authors. Published by Elsevier Ltd.
Peer-review under responsibility of the Scientific Committee of The 15th International Symposium on District Heating and Cooling.
Keywords: Heat demand; Forecast; Climate change
Energy Procedia 122 (2017) 475–480
1876-6102 © 2017 The Authors. Published by Elsevier Ltd.
Peer-review under responsibility of the scientific committee of the CISBAT 2017 International Conference – Future Buildings & Districts – Energy Efficiency from Nano to Urban Scale
10.1016/j.egypro.2017.07.295
10.1016/j.egypro.2017.07.295
© 2017 The Authors. Published by Elsevier Ltd.
Peer-review under responsibility of the scientific committee of the CISBAT 2017 International Conference – Future Buildings & Districts – Energy Efficiency from Nano to Urban Scale
1876-6102 Available online at www.sciencedirect.com
ScienceDirect
Energy Procedia 00 (2017) 000–000
www.elsevier.com/locate/procedia
1876-6102 © 2017 The Authors. Published by Elsevier Ltd.
Peer-review under responsibility of the scientific committee of the CISBAT 2017 International Conference – Future Buildings & Districts – Energy Efficiency from Nano to Urban Scale.
CISBAT 2017 International Conference – Future Buildings & Districts – Energy Efficiency from
Nano to Urban Scale, CISBAT 2017 6-8 September 2017, Lausanne, Switzerland
Calculation procedure to improve the assessment of photovoltaic
generation in solar maps
Luigi Schibuola
a, Massimiliano Scarpa
a*, Chiara Tambani
aaUniversity IUAV of Venice, Dorsoduro 2206, Venice 30123, Italy
Abstract
The Zero Energy Building (ZEB) target and the higher affordability of photovoltaic (PV) systems are pushing Governments and large Companies operating in electricity generation and distribution network management to develop tools able to better define the potential productivity of PV systems on a large scale, such as solar maps. However, solar maps mainly consider phenomena related to weather and geometry, with a low level of detail on second order effects. This research aims at the integration of additional technical aspects into solar maps, by means of diagrams able to increase the reliability in the assessment of potential electricity generation. For this purpose, more technical factors are taken into account, such as the variation of PV panel efficiency with cell temperature, the shadow cast by the preceding PV panel array, here including the action of by-pass diodes, and the ratio of active area over the area available for installation.
© 2017 The Authors. Published by Elsevier Ltd.
Peer-review under responsibility of the scientific committee of the scientific committee of the CISBAT 2017 International Conference – Future Buildings & Districts – Energy Efficiency from Nano to Urban Scale.
Keywords: PV generation; solar maps; by-pass diode. 1. Introduction
This paper proposes a calculation procedure that may be used by urban planners and energy managers to assess the potential generation of electricity from PV systems installed on flat roofs. This calculation procedure starts from
* Corresponding author. Tel.: +39-0412571321.
E-mail address: [email protected]
Available online at www.sciencedirect.com
ScienceDirect
Energy Procedia 00 (2017) 000–000
www.elsevier.com/locate/procedia
1876-6102 © 2017 The Authors. Published by Elsevier Ltd.
Peer-review under responsibility of the scientific committee of the CISBAT 2017 International Conference – Future Buildings & Districts – Energy Efficiency from Nano to Urban Scale.
CISBAT 2017 International Conference – Future Buildings & Districts – Energy Efficiency from
Nano to Urban Scale, CISBAT 2017 6-8 September 2017, Lausanne, Switzerland
Calculation procedure to improve the assessment of photovoltaic
generation in solar maps
Luigi Schibuola
a, Massimiliano Scarpa
a*, Chiara Tambani
aaUniversity IUAV of Venice, Dorsoduro 2206, Venice 30123, Italy
Abstract
The Zero Energy Building (ZEB) target and the higher affordability of photovoltaic (PV) systems are pushing Governments and large Companies operating in electricity generation and distribution network management to develop tools able to better define the potential productivity of PV systems on a large scale, such as solar maps. However, solar maps mainly consider phenomena related to weather and geometry, with a low level of detail on second order effects. This research aims at the integration of additional technical aspects into solar maps, by means of diagrams able to increase the reliability in the assessment of potential electricity generation. For this purpose, more technical factors are taken into account, such as the variation of PV panel efficiency with cell temperature, the shadow cast by the preceding PV panel array, here including the action of by-pass diodes, and the ratio of active area over the area available for installation.
© 2017 The Authors. Published by Elsevier Ltd.
Peer-review under responsibility of the scientific committee of the scientific committee of the CISBAT 2017 International Conference – Future Buildings & Districts – Energy Efficiency from Nano to Urban Scale.
Keywords: PV generation; solar maps; by-pass diode. 1. Introduction
This paper proposes a calculation procedure that may be used by urban planners and energy managers to assess the potential generation of electricity from PV systems installed on flat roofs. This calculation procedure starts from
* Corresponding author. Tel.: +39-0412571321.
E-mail address: [email protected]
Integration of Renewable Energy in the Built Environment (Electricity,
Heating and Cooling)
476 2 Luigi Schibuola at al. / Energy Procedia 00 (2017) 000–000 Luigi Schibuola et al. / Energy Procedia 122 (2017) 475–480
available data of solar radiation and corresponding outdoor air temperature and calculates additional phenomena that can be consistently determined by means of geometry considerations. In particular, given the azimuth and minimum spacing of the PV arrays, this calculation procedure defines the PV module tilt to maximize electricity generation.
Nomenclature Symbols A Area [m²] C Multiplier coefficient [-] d Length or distance [m] E Energy [kWh/(m2·y)]
G Solar radiation (yearly) [kWh/(m2·y)]
h Solar altitude [°]
IAM Incidence Angle Modifier [-] α Angle [°] β Tilt [°] η Efficiency [-] θ Incidence angle [°] (τα) Transmittance-absorptance product [-] Subscripts
Beam Pertaining to the beam solar radiation Diff Pertaining to the diffuse solar radiation El Electric
n With reference to incidence angle normal to the PV module Optβ Referred to the optimum tilt
Pan Pertaining to the PV panel
PVGen Pertaining to PV electricity generation R Ratio
Sh Pertaining to the shadow Sky Pertaining to the sky
Sp Referred to spacing between PV arrays Surf Referred to the module surface Unsh Referred to the unshaded condition View Pertaining to the optical view
θ With reference to actual incidence angle with respect to the PV module
The assessment of the optimum tilt angle aimed at the maximization of solar energy exploitation is still subject of interest, since several authors still actively work on this topic. For instance, Yadav and Chandel [1], Duffie and Beckman [2], Lunde [3], Gunerhan and Hepbasli [4] and other authors suggest complex algorithms (Genetic Algorithms, Simulated Annealing techniques, Particle Swarm Optimization or Artificial Neural Networks,…) for this purpose. However, even if very complex algorithms are used to assess the best tilt angle from a theoretical point of view, just a very small enhancement is given over the near tilt angle values. Moreover, phenomena consequent to other technical factors imply higher effects on actual electricity generation.
This paper focuses specifically on PV arrays and takes into account phenomena such as: (i) the effect of transmission and absorption of sunrays through the glass cover of the PV modules (to achieve higher accuracy in the calculation of solar radiation at low sun altitudes), (ii) the decay in the performance consequent to the increase of cell temperature and (iii) the operation of bypass diodes. In fact, this paper focuses on PV modules installed on parallel arrays and considers shaded PV modules. The design procedure here proposed takes advantage of a large set of parametric simulations to provide the best tilt of PV arrays according with the given constraints, i.e. PV array azimuth and minimum spacing between the PV arrays. In particular, the PV arrays spacing may vary based on PV
module size and service area, as well as on fire safety issues. On this regard, Byrne et al., in [5], consider service area as a function of the tilt of PV modules. Moreover, safety issues should be considered as well, with relevant indications given in the International Fire Code (IFC) [6]. Currently, calculation procedures for solar maps consider roof-integrated PV panels, but PV panels are often installed on flat roofs, hence the optimal PV module tilt and the optimal spacing between contiguous PV module arrays should be determined. In this regard, the assessment of area available for PV installation is critical for the reliable calculation of the electricity generation expectable from a PV system installed on a flat roof. Moreover, in common design procedures, the PV module tilt is usually 10° lower than local latitude [7], but, because of possible shading and need for service area, optimal PV module tilt should be properly assessed by including also the significant effect of bypass diodes operation on the total PV generation. Finally, PV manufacturers often provide just general recommendations about PV array spacing, with no specific indication about PV module tilt in roof-mounted multi-array configurations. This paper will answer this question by recommending optimal tilt as a function of PV array spacing and installation azimuth. As a result, the use of the proposed design procedure may imply higher detail in the assessment of PV generation potential, for the development of solar maps. The proposed design procedure is rapid, easy-to-implement, prone to extension into PV generation projections at urban or regional level too and deals with all of these phenomena.
Other context-related phenomena could be considered in this research, such as the accumulation of dust on PV modules, but their effects are low in most of cities. In fact, while in desert zones Hasan and Sayigh [8] showed average reductions of solar transmittance of 64%. 48%, 38%, 30%, and 17% at PV module tilt angles equal to 0°, 15°, 30°, 45°, and 60° respectively, in usual climates the decrease in efficiency consequent to soiling is much lower. In fact, Mejia et al. [9] analysed 186 PV sites from the San Francisco Bay Area to the United States-Mexico border and assessed average losses due to soiling equal to about 0.051% per day after a rain event.
The proposed design procedure is described in Section 2, whereas the results are shown and discussed in Section 3.
2. Methods
2.1. Calculation of the solar radiation impinging on the PV module
The solar radiation impinging on the collector surface was calculated applying the basic equations described in [8] and using the diffuse solar radiation model by Perez et al. [10], according with authors identifying the model by Perez as one of the most accurate, as shown in [11], [12], and [13]. Further calculations were performed, in order to account for shading conditions due to the preceding PV array. The related definitions are resumed from (1) to (5), through symbols and abbreviations suggested by standard ISO 9488:1999 [14] and with reference to Fig. 1. In particular: (1) is the length of the shadow cast by the preceding PV array; (2) is the PV module area shaded by the preceding PV array; (3) is the PV module area receiving solar beam radiation; (4) is the ratio of PV panel area to roof area; (5) is the PV module view factor to the sky.
Fig. 1. Scheme of the symbols involved in the assessment of the shading conditions for the PV module.
tg
h sin d dSh Pan Surf (1)
d d
tg
tg
h
AR Sh Sp 1 Surf (2)
Sh Pan
Pan
Surf Pan
Beam , R d d d cos d A 1 (3)
d d cosh
dAR,Diff Pan Sp Pan (4)
Surf Pan Surf
Sp Pan
Surf Surf
Dif , View , Sky ,
R f archtgd Sin d d cos
478 Luigi Schibuola et al. / Energy Procedia 122 (2017) 475–480
4 Luigi Schibuola at al. / Energy Procedia 00 (2017) 000–000
2.2. Calculation of the PV array performance
The performance of the PV array is calculated by taking into account the following main parameters and phenomena, better discussed in the next subsections: (1) the reflection and absorption of sunrays owing to the glass cover and (2) the effect of by-pass diodes. Phenomenon 1 causes PV performance deterioration common to all PV modules, independent of their characteristics, because the most of PV panels have similar glass covers, whereas phenomenon 3 may affect the PV performance within a wide range of variation, depending on the design quality level of the specific PV panel model. In fact, depending on the designer’s choice, the PV panel may be provided with one or more by-pass diodes, to increase the PV panel performance.
2.2.1. Reflection and absorption of sunrays owing to the glass cover
These phenomena may give significant decays in the PV electricity yield when sunrays are far from the direction normal to the glass cover. The reflection effect is given by the IAM (Incidence Angle Modifier), defined as the ratio of the transmittance-absorptance product (τα) at a given angle of incidence θ to that at normal incidence (τα)n, as
made explicit in (6). Symbol (τα) represents the share of solar radiation reaching the PV cells, relative to the one impinging on the glass cover external surface. In this research activity, the solar radiation impinging on the glass cover was split into the beam and diffuse components (whereas the reflected radiation is neglected because of the presence of preceding PV array) and IAM were calculated for each component (i.e. beam and diffuse solar radiation components). In particular, as regards the calculation of sky diffuse solar radiation, 60 is assumed as the representative value for isotropic solar radiation from all over the sky [15]. For this purpose, a typical profile of the IAM against the angle of incidence was used.
nIAM (6)
2.2.2. Operation of PV module diode by-passes
The shadow cast by the preceding PV array shades part of the PV panels, thus it determines two areas of the PV panel: the lighted area, i.e. the area receiving beam and diffuse solar radiation, and the shaded area, i.e. the area receiving just diffuse solar radiation. Lighted and shaded areas differ in the maximum specific PV generation, but, due to the connection of PV cells in series, the actual generation of electricity from the PV module must be consistent with the behaviour of the PV module as a whole. In this paper, the action of two bypass diodes was considered and the consequent decay in PV electricity generation was calculated. For this purpose, at each hour of the year, the voltage for lighted and shaded cells was calculated at various current intensities and the voltage of shaded cells was compared with the by-pass diode voltage, to determine the occurrence of by-pass diodes action.
2.3. Boundary conditions
The calculations were referred to Venice (Latitude: 45.44°N; Longitude: 12.34°E), in Italy.
The simulations performed covered PV panel tilts from 0° to 90° (step: 1°), PV panel azimuthes from 0° to 180° (step: 22.5°) and array spacings (in terms of ratio rSp = dSp/dPan) from 0.0 to 4.0 (step: 0.5).
2.4. The proposed design procedure
The calculation procedure proposed by the authors is described as follows:
Choice of the azimuth of the PV module arrays, usually according with architectural constraints. Choice of the minimum PV array spacing, according with maintenance and fire safety issues. Assessment of the best tilt, aimed at one among the following strategies:
A. Achievement of the maximum PV generation over the roof area;
B. Achievement of the maximum PV generation over the PV panel area, to achieve the economic optimization. Assessment of the achievable PV generation, through multiplier coefficient CPVGen, as shown in (7). Depending
on the strategy chosen above, this coefficient is given in Fig. 3.a (for strategy A) and Fig. 3.b (for strategy B). PVGen Pan Unsh , Opt PVGen , El G C E (7)
3. Results and discussion
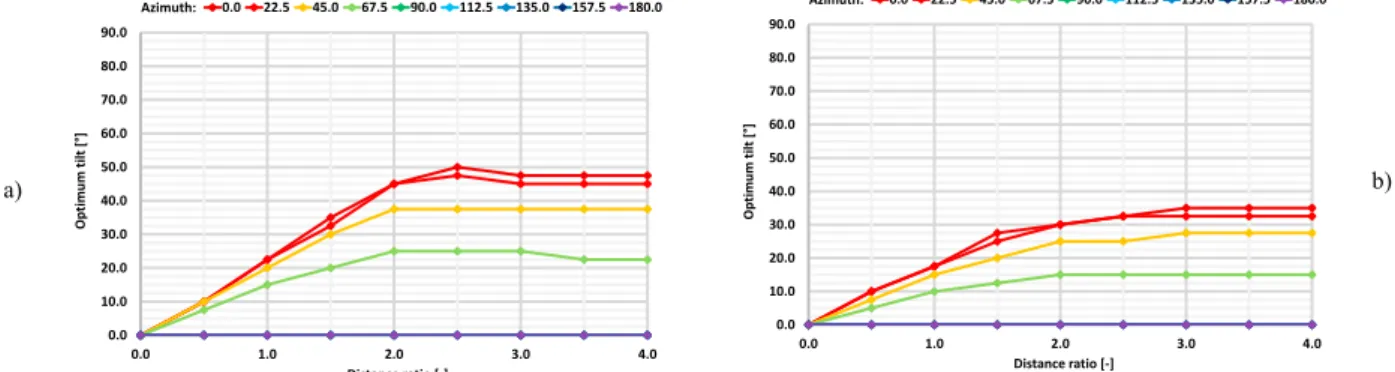
The main results from the parametric simulations performed are shown from Fig. 2 to Fig. 5. In particular, Fig. 2 shows the tilt of the PV panels recommended to achieve the maximum PV electricity generation over the roof area (a) or over the PV panel area (b), depending on azimuth and array spacing, which is expressed in terms of distance ratio dSp/dPan (Fig. 1). Fig. 3 shows corresponding values of coefficient CPVGen. It is clear that the optimum tilt of PV
modules increases with the value of PV distance ratio, up to a value equal to 2.5 times the PV module length and keeps constant at about 45°, when aiming at the maximum PV electricity generation over the roof area. Instead, in case of maximum PV electricity generation over the PV panel area, the optimum tilt increases progressively up to 35°, which is the optimal tilt for unshaded PV arrays in Venice. Moreover, relevant differences among the various azimuth angles take place, recommending horizontal installation for high azimuth angles. Even if the difference between the optimum tilts for strategies A and B is significant, Fig. 3 does not show such high differences in CPVGen.
a) b)
Fig. 2. PV panels tilt, depending on azimuth and distance ratio, for maximum PV generation over the roof area (a) or over the PV panel area (b).
a) b)
Fig. 3. CPVGen depending on azimuth and distance ratio, aimed at the maximum PV generation over the roof area (a) or over the PV panel area (b).
a) b)
Fig. 4. Comparison between the PV generation achieved by the chosen configuration of shaded PV modules and the PV generation achievable in case of unshaded PV modules, in case of control strategy A (a) and B (b).
0.0 10.0 20.0 30.0 40.0 50.0 60.0 70.0 80.0 90.0 0.0 1.0 2.0 3.0 4.0 Op timu m tilt [ °] Distance ratio [-] 0.0 22.5 45.0 67.5 90.0 112.5 135.0 157.5 180.0 Azimuth: 0.0 10.0 20.0 30.0 40.0 50.0 60.0 70.0 80.0 90.0 0.0 1.0 2.0 3.0 4.0 Op timu m tilt [ °] Distance ratio [-] 0.0 22.5 45.0 67.5 90.0 112.5 135.0 157.5 180.0 Azimuth: 0% 10% 20% 30% 40% 50% 60% 70% 80% 90% 100% 0.0 1.0 2.0 3.0 4.0 Coe ffici en t [ -] Distance ratio [-] 0.0 22.5 45.0 67.5 90.0 112.5 135.0 157.5 180.0 Azimuth: 0% 10% 20% 30% 40% 50% 60% 70% 80% 90% 100% 0.0 1.0 2.0 3.0 4.0 Coe ffici en t [ -] Distance ratio [-] 0.0 22.5 45.0 67.5 90.0 112.5 135.0 157.5 180.0 Azimuth: 0% 10% 20% 30% 40% 50% 60% 70% 80% 90% 100% 0.0 1.0 2.0 3.0 4.0 Coe ffici en t [ -] Distance ratio [-] 0.0 22.5 45.0 67.5 90.0 112.5 135.0 157.5 180.0 Azimuth: 0% 10% 20% 30% 40% 50% 60% 70% 80% 90% 100% 0.0 1.0 2.0 3.0 4.0 Coe ffici en t [ -] Distance ratio [-] 0.0 22.5 45.0 67.5 90.0 112.5 135.0 157.5 180.0 Azimuth:
480 Luigi Schibuola et al. / Energy Procedia 122 (2017) 475–480
6 Luigi Schibuola at al. / Energy Procedia 00 (2017) 000–000
a) b)
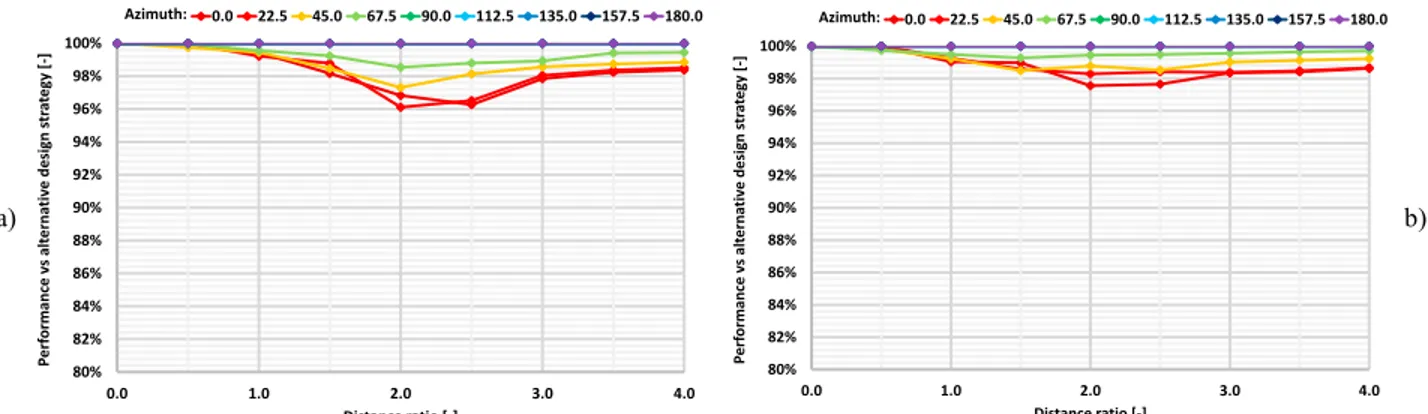
Fig. 5. Comparison between the PV overall efficiency achieved by the configuration chosen via strategy A against the one achievable via optimum configuration consequent to strategy B (a) and comparison between the PV generation achieved by the configuration chosen via strategy B against
the one achievable via optimum configuration consequent to strategy A (b).
After this assessment, one could be interested in the estimation of the difference in PV generation and overall efficiency consequent to the choice of the specific design strategy, with reference to unshaded PV modules (Fig. 4), as well as comparing the performance of configurations chosen via strategy A against the ones consequent to strategy B (Fig. 5). It is clear that the differences between the two strategies are very low (maximum: about 5%).
4. Conclusions
This paper proposes a calculation procedure that may be used by urban planners and energy managers to assess the optimum tilt and consequent PV electricity generation for shaded PV modules installed on flat roofs, depending on the azimuth and PV array spacing. Through coefficient CPVGen, the proposed calculation procedure assesses the
actual PV generation of shaded PV modules aiming at maximizing electricity generation over the roof area (A) or over the PV panel area (B). The resulting diagrams show that, while the optimum tilt is significantly different depending on the chosen strategy (A or B), the actual difference in PV generation is low.
References
[1] A. K. Yadav and S. S. Chandel, “Tilt angle optimization to maximize incident solar radiation: A review,” Renew. Sustain. Energy Rev., vol. 23, pp. 503–513, 2013.
[2] J. A. Duffie and W. A. Beckman, Solar engineering of thermal processes. New York: John Willey & Sons, 2013. [3] P. Lunde, Solar thermal engineering: Space heating and hot water systems. New York, 1980.
[4] H. Gunerhan and A. Hepbasli, “Determination of the optimum tilt angle of solar collectors for building applications,” Build. Environ., vol. 42, no. 2, pp. 779–783, Feb. 2007.
[5] J. Byrne, J. Taminiau, L. Kurdgelashvili, and K. N. Kim, “A review of the solar city concept and methods to assess rooftop solar electric potential, with an illustrative application to the city of Seoul,” Renew. Sustain. Energy Rev., vol. 41, pp. 830–844, Jan. 2015.
[6] International Code Council, International Fire Code 2012, vol. 53, no. 9. 2011.
[7] J. Schallenberg-Rodríguez, “Photovoltaic techno-economical potential on roofs in regions and islands: The case of the Canary Islands. Methodological review and methodology proposal,” Renew. Sustain. Energy Rev., vol. 20, pp. 219–239, Apr. 2013.
[8] A. Hasan and A. A. M. Sayigh, “The effect of sand dust accumulation on the light transmittance, reflection, and absorbance of the PV glazing,” in Renewable Energy, Technology and Environment, 1992, pp. 461–466.
[9] F. A. Mejia and J. Kleissl, “Soiling losses for solar photovoltaic systems in California,” Sol. Energy, vol. 95, pp. 357–363, Sep. 2013. [10] R. Perez, R. Stewart, C. Arbogast, R. Seals, and J. Scott, “An anisotropic hourly diffuse radiation model for sloping surfaces: Description,
performance validation, site dependency evaluation,” Sol. Energy, vol. 36, no. 6, pp. 481–497, 1986.
[11] D. T. Reindl, W. A. Beckman, and J. A. Duffie, “Evaluation of hourly tilted surface radiation models,” Sol. Energy, vol. 45, no. 1, pp. 9–17, 1990.
[12] P. G. Loutzenhiser, H. Manz, C. Felsmann, P. A. Strachan, T. Frank, and G. M. Maxwell, “Empirical validation of models to compute solar irradiance on inclined surfaces for building energy simulation,” Sol. Energy, vol. 81, no. 2, pp. 254–267, Feb. 2007.
[13] A. M. Noorian, I. Moradi, and G. A. Kamali, “Evaluation of 12 models to estimate hourly diffuse irradiation on inclined surfaces,” Renew.
Energy, vol. 33, no. 6, pp. 1406–1412, Jun. 2008.
[14] ISO, “ISO 9488:1999 - Solar Energy - Vocabulary,” 1999.
[15] J. A. Duffie and W. A. Beckman, Engineering of Solar Thermal Processes, 4th Editio. 2013. 80% 82% 84% 86% 88% 90% 92% 94% 96% 98% 100% 0.0 1.0 2.0 3.0 4.0 Pe rf orman ce vs alt erna tiv e d esign str at egy [-] Distance ratio [-] 0.0 22.5 45.0 67.5 90.0 112.5 135.0 157.5 180.0 Azimuth: 80% 82% 84% 86% 88% 90% 92% 94% 96% 98% 100% 0.0 1.0 2.0 3.0 4.0 Pe rf orman ce vs alt erna tiv e d esign str at egy [-] Distance ratio [-] 0.0 22.5 45.0 67.5 90.0 112.5 135.0 157.5 180.0 Azimuth: