Sustainable Development
in the
Mediterranean
Report 2020
Transforma*ons to achieve the
Sustainable Development
in the Mediterranean
Report 2020
Transformations to achieve the
Sustainable Development Goals
September 2020 © Sustainable Development Solutions Network Mediterranean This report has been prepared by the team of independent experts at SDSN Mediterranean, hosted by the University of Siena – Santa Chiara Lab. As a dedicated edition focused on Mediterranean countries, it is based on data and elaborations of the Sustainable Development Report 2020, prepared by the Bertelsmann Stiftung and the Sustainable Development Solution Network (SDSN) and published by Cambridge University Press.
Acknowledgements
The 2020 Report on Sustainable Development in the Mediterranean presents an overview of results achieved for 24 Mediterranean countries extracted from the Sustainable Development Report 2020. It was prepared by a team of experts of the University of Siena – Santa Chiara Lab, as the hosting institution of the Sustainable Development Solutions Network for the Mediterranean Area (SDSN-Mediterranean). The report was coordinated by Riccardo M. Pulselli under the direction of Angelo Riccaboni (SDSN Mediterranean) and the supervision of Jeffrey Sachs (SDSN). Lead writers are Riccardo M. Pulselli, Massimo Gigliotti, Simone Cresti, Angelo Riccaboni (SDSN Mediterranean) and Jeffrey Sachs (SDSN).
The Mediterranean Countries Edition is based on indices and indicators presented in the Sustainable Development
Report 2020 (Sachs et al. 2020) and partially replicates tables and figures with a specific focus on Mediterranean
countries. Compared to the original document, it provides substantial integrations concerning the interpretation of results in the Med Area, their visualisation in the form of maps, and specific recommendations and policies for the implementation of Sustainable Development Goals (SDGs) referring to the Six Transformations Framework by Sachs et al. (2019).
Scope of the report is to facilitate the reading of the Sustainable Development Report 2020 through the optic of Mediterranean countries in order to share knowledge on current trends towards SDGs and drive common action. To cite this report, please mention the following reference: Riccaboni, A., Sachs, J., Cresti, S., Gigliotti, M., Pulselli, R.M. (2020): Sustainable Development in the Mediterranean. Report 2020. Transformations to achieve the Sustainable Development Goals. Siena: Sustainable Development Solutions Network Mediterranean (SDSN Mediterranean).
Table of Contents
Foreword
5
Executive Summary
6
1. Overview of the Mediterranean context
8
2. The SDG Index and Dashboards
10
2.1 The SDG Dashboards 113. Six Transformations to achieve the SDGs and challenges
14
3.1 Transformation 1. Education, gender and inequality 16 3.2 Transformation Health, Wellbeing and Demography 27 3.3 Transformation Energy, Decarbonisation and Sustainable Industry 38 3.4 Transformation Sustainable Food, Land, Water and Sea 48 3.5 Transformation Sustainable Cities and Communities 61 3.6 Transformation Digital Revolution for Sustainable Development 714. Recommended policies to achieve the SDGs
75
4.1 Transformation 1. Policies for Education, gender and inequality 76 4.2 Transformation 2. Policies for Health, Wellbeing and Demography 79 4.3 Transformation 3. Policies for Energy, Decarbonisation and Sustainable Industry 83 4.4 Transformation 4. Policies for Sustainable Food, Land, Water and Sea 89 4.5 Transformation 5. Policies for Sustainable Cities and Communities 95 4.6 Transformation 6. Policies for Digital Revolution for Sustainable Development 1015. Conclusion
103
References
104
Foreword
We are pleased to launch the second edition of the report on the Sustainable Development in the Mediterranean - Transformations to achieve the Sustainable Development Goals. It focuses on 24 Mediterranean countries hosting a population of over 520 million people to show the current level of achievement of the SDGs in the Mediterranean region. The report builds on the Sustainable Development Report 2020, prepared jointly by the Bertelsmann Stiftung and the Sustainable Development Solutions Network (SDSN). The SDG index, the indices per each SDG and the entire set of indicators are taken from the Sustainable Development Report 2020. Maps (one per each indicator) and additional raw data (when relevant) have been specifically produced to facilitate the understanding of current trends and drive common action in the Mediterranean area. This initiative has been undertaken by the University of Siena - Santa Chiara Lab, hosting institution of the SDSN Mediterranean, together with SDSN, to raise awareness on the SDGs and foster the implementation of transformation strategies.In particular, these strategies should follow the Six Transformations Framework presented by Sachs et al. (2019). Statistical data has been therefore aggregated and interpreted with the aim of showing the current state and progress per each transformation: 1. Education, Gender and Inequality; 2. Health, Wellbeing and Demography; 3. Energy Decarbonisation and Sustainable Industry; 4. Sustainable Food, Land, Water and Oceans; 5. “Sustainable Cities and Communities”; 6. Harnessing the Digital Revolution for Sustainable Development. Given the complexity and wide range of topics, highly interconnected to each other, the report proposes an innovative operational methodology, starting from the aggregation and visual representation of indicators, to the identification of main challenges and the definition of policies to inform action addressed to governments, businesses and other stakeholders.
In the foreword of previous edition, co-authored with Jeffrey Sachs, we anticipated that the review process would have possibly become more systematic and been further improved by engaging thematic experts from centres of excellence in Southern Europe, Middle East and North Africa, to identify and share possible solutions according to their expertise. In line with it, in the 2020 edition, we started a cooperative work with 6 Mediterranean hubs, one per each transformation, called to propose suitable policies for the accomplishment of the six transformations.
This method makes the Mediterranean edition of the SDSN report more than a monitoring report, but rather a decision-support tool dealing with the six transformations and four geographical areas: Europe west, Europe east (Southern Europe), Middle East and North Africa (MENA).
The SDSN Sustainable Development Report 2020 dedicates a consistent section to the sanitary emergency induced by the COVID 19. Sachs and co-authors analyse the real and potential negative impacts to the SDGs, besides its dramatic effects in terms of lives lost. The approach followed in the SDSN Report is suitable also to the Mediterranean context. Relevant damages can be expected in many of the monitored indicators and increasingly difficult challenges will relate with poverty rates, social and gender inequalities, educational systems, community building and international partnerships. Besides social and economic impacts, despite of temporary good effects on the environment recorded during the lock-down, a decreased attention to climate and environmental issues can be also expected. These alarming scenarios must be avoided and urgently handled by promoting the SDGs as the most promising wayout to rebuild a sustainable and healthy society, the only available plan.
The Mediterranean region in general presents high environmental, social and cultural challenges. Transnational partnerships, although complicated, are key to deal with them. To this aims, the SDGs analysis can be useful to identify common strategies and share best practices and policies, keeping in mind that gradual progress and policy changes are not enough and deep transformations are urgent. We have a very long way to go. Proactive behaviours by governments, businesses, citizens and all the stakeholders in the Mediterranean region to finally close the gap between rhetoric and action are needed. We hope that our focus on transformations supports such collective efforts.
Angelo Riccaboni Director Mediterranean Sustainable Development Solutions Network Jeffrey Sachs Director Sustainable Development Solutions Network
Executive Summary
The 2020 Report, Sustainable Development in the Mediterranean, presents the SDG Index and Dashboards for the 24 countries of the Mediterranean area, a complex environment, shared by three continents, seriously affected by global warming, being the most vulnerable to climate change in the world, after the Artic (section 1). The scores, meant as general measures of the distance to SDG targets, have been reported per country and assessed in the four aggregated regions (values weighted by population) and in the all Mediterranean area (section 2).As a result, given a general score of 73.5 of the Mediterranean area (meaning that SDG targets are achieved by 73.5%), the SDG index shows better performance in Europe West (78.5) and lower values in Europe East (74.8), North Africa (70.2) and Middle East (70.2). Nevertheless, the spillover index looks inversely proportional to the SDG index, since better performing countries tend to negatively impact on other countries (e.g. financial, trade, environmental issues), often compromising their efforts for improvements. In order to unpack the SDG indices and properly understand results, this report presents a systematic methodology to represent and interpret any single indicator and provide a comprehensive current state picture of the Mediterranean area (section 3). To this regard, the Six Transformations proposed by Sachs et al. (2019) have been taken as the reference operative framework to inform and drive action. In particular, the SDSN indicators, made spatially explicit through dedicated maps, have been gathered based on their relevance for the monitoring and assessment of the six transformations and used to determine the main challenges to be faced per each transformation.
Once identified and briefly described, challenges became the basic reference for determining sets of policies addressed to various stakeholders to implement actions for improvement and increase the capacity of countries to accomplish the six transformations (section 4). At this stage, the SDSN Mediterranean has selected six reference institutions based on their expertise, one per each transformation. The six Mediterranean hubs shared information and cooperated to assemble the basic guidelines to foster concrete changes towards the SDGs. As for the Mediterranean overview, indices and disaggregated indicators provide a comprehensive information on the current state and trends towards the SDGs. In general, all the 24 Mediterranean countries are far from achieving the SDGs and must improve their performance. Considering average incomes, almost 50 million people (12%) in the Med area are at risk of #poverty, including 27 million Europeans. This picture refers to the period before the pandemic crisis and can be supposed to dramatically worsen after the lockdown and the subsequent economics crisis.
#woman rights and opportunities for #woman emancipation must be improved,
especially considering rates of scholarship, participation in labour force and policy (e.g. seats held by women in national parliaments: 37% in Europe; 18% in MENA).
The #job market looks stagnant. Unemployment rates are around 11% in average in MED, with homogeneity in the four regions. The number of NEET (youth not in employment, education or training) is increasing in OECD countries involving almost 20% of young people.
Wrong #food habits impact on health and the healthcare system. Obesity affects from 18 to 35% of the Mediterranean population (almost 95 million in total), namely 34 million people in Europe west, 34 million in North Africa and 24 million in the Middle East. #sustainable agriculture is among the most desirable practices to deploy with positive effects on social healthiness and the environment.
#water management is a crucial issue, also depending on the relevant effects of
climate change in the Mediterranean area. Especially MENA countries, poor in water, risk to further compromise the access to basic drinking water and sanitation services, besides the risks for agriculture practices being farmers major users of
Regarding #water quality, basic services of wastewater treatment are performed in Europe West at 78%, in Middle East at 36%, in North Africa at 31% and in Eastern Europe only at 29%. This has also impacts on seawater quality, highlighted as a critical issue in the Mediterranean basin that needs to enlarge and enforce
#environmental protection in marine and maritime areas.
#air quality in urban areas needs careful monitoring. In particular, the percentage
of med population exposed to high rates of PM2.5 is high especially in the MENA countries. Values in Europe are lower but not negligible. Considering the high rate of urbanisation in Med (over 70% population leaves in cities) and the related respiratory diseases (higher vulnerability to the COVID 19), this represents an urgent problem to handle.
The share of renewable energy and the quantity of carbon emission per unit of electricity are promising factors in Europe, although improvements are still needed. Nevertheless, investments towards #sustainable energy systems in MENA countries need a consistent acceleration. This is even more important considering the high vulnerability of the Mediterranean area to climate change.
Quality of Higher Education University is medium-high in Europe west and Middle East, with lower performance in Europe east and North Africa. Nevertheless, investments in #R&I should consistently increase, especially looking at the expenditures of countries in research activities: 1.6% in Europe west, 0.3% in Europe east, 1.9% in Middle East and 0.5% in North Africa.
Regarding the protection of marine environment, capture #fisheries are often based on unsustainable practices and need more stringent regulations and monitoring. Moreover, aquaculture can be an alternative solution, provided that it is sustainably performed. #environmental protection through protected areas (including freshwater and lands) is still insufficient and needs to be further enlarged; seawater quality also needs constant monitoring in all MED countries. Mainly focusing on urban areas, but without neglecting rural areas, #accessibility to services such as public transport and #waste management must be improved in all the Mediterranean region. #digital infrastructures should also guarantee higher accessibility rates to internet (80% in Europe and only 57% in MENA).
Among the forms of #crime, the perception of corruption is high in most of Mediterranean countries and #press freedom should be safeguarded in every country as essential factor of fairness and equality. High levels of inequality in
#wealth distribution (family income) are recorded in the all Mediterranean area,
with highest values in the Middle East. The #weapon market, especially concerning exports of conventional weapons, is prosperous in Europe west and need special attention.
The general overview on the Mediterranean area presented in this report is based on SDSN indices and indicators published in the Sustainable Development Report 2020 (Sachs et al. 2020) and, although wide and articulated enough, is anyhow partial and not exhaustive. In some cases, indicators have been coupled with raw data allowing for a better interpretation of results but many details still miss and, sometimes, due to the complexity of the Mediterranean environment, can bring to contradictions and statistical weaknesses. The suggested framework looks useful to understand the current situations regarding the SDG targets and it demonstrated to be an effective method to share information and let a group of Mediterranean hubs cooperate for the identification of concrete strategies and policies to be promoted among governments, communities and other stakeholders. A general roadmap emerging from this
1. Overview of the Mediterranean Context
The Mediterranean Sea identifies a unique area shared by three different continents. The 24 countries analysed - divided into four macro-areas: Western Europe, Eastern Europe, Middle East, North Africa – show many differences from the cultural, religious, social and economic viewpoints. Countries have various spatial dimensions, their own history, traditions and peculiarities, and also different approaches in the global network; they are deeply interconnected through the sea, nowadays scene of socio-political compromises, human migrations, trade and energy exchanges.
Figure 1 | Mediterranean countries aggregated in the four regional areas.
In addition to the 21 countries directly facing the Mediterranean Sea, Portugal, North Macedonia and Jordan have been included considering their geo-political influence in the Mediterranean area. The population of the 24 countries has more than doubled since 1960 (+114%), and host nowadays more than 500 million people, with different growth trends in the four macro-areas: +33% in South Europe and +250% in the Middle East and North Africa (MENA). In the decade 2008-2018 the Mediterranean population has increased by 11%, with rates of over 2% in Western Europe, almost 18% in Middle East and 20% in North Africa, and a decrease of 3% in Eastern Europe. The population currently living in urban areas is on average 70%; this follows a growing depopulation of the rural areas. Urbanization has increased by 38% since 1990, while employment in the agricultural sector has decreased by 44% (World Bank data). The Mediterranean area is a climate hotspot, where temperatures have already increased by 1.5 C°, while the world average increase is 1.1 C°. The warming effect in the Mediterranean is now more intense than in most of the world, with increasing risks associated to climate change (Cramer et al. 2018; MedECC 2019). Projections indicate that temperature could rice up to 2.2 C° in 2040 and 3.8 C° in 2100, besides a progressive reduction in precipitation (-10% in European countries and -30% in the Middle East and North Africa). At the same time, extreme rainfall events, heat
SLOVENIA
CROATIA
BOSNIA & HERZEGOVINA
MONTENEGRO ALBANIA NORTH MACEDONIA CYPRUS TURKEY SYRIA LEBANON ISRAEL PALESTINE JORDAN MOROCCO ALGERIA TUNISIA LIBYA EGYPT
E
UROPEE
ASTE
UROPEW
ESTN
ORTHA
FRICAM
IDDLEE
ASTMALTA FRANCE ITALY SPAIN PORTUGAL GREECE
Due to climate change and increased consumption, freshwater reserves are expected to decrease by 2% to 15% in the Mediterranean region. The risk of damaging water resources is among the highest in the world. The current situation of the Mediterranean population is classified as "poor in water" with less than 1,000 m3/year per capita; nevertheless,
water availability in some locations, such as South-eastern Spain and North Africa, is further decreasing and could fall into a condition of “water scarcity” (below 500 m3/year per capita), affecting around 250 million people in 2040. Water availability is a crucial issue that risks to cause political instability, new conflicts, increased migration, and crisis in the agricultural sector (irrigation represents 50-90% of the demand for water in the Mediterranean countries). The surface temperature of the Mediterranean has been increasing by 0.4 C ° every 10 years between 1985 and 2006 (+0.3 C ° in the western part and +0.5 C ° in the eastern part of the basin). Projections to 2100 indicate a possible increase from +1.8 to +3.5 C ° in seawater temperature compared to the 1961-1990 average, with a consequent rise in sea level which is already taking place in a progressive and worrying way: from 0.7 mm/year in 1945-2000, and 1.1 mm/year in 1970-2006, to 3 mm/year recorded in 2006-2019. This also affects marine currents with ecological decompensation. Risks due to sea level rise include the saline intrusion near the deltas of the most important Mediterranean river basins (Nile, Ebro, Rodano and Po) and the loss of important agricultural areas.
Food security and the internal production capacity, compared to imports, are directly influenced by increasing water scarcity and soil degradation, both medium-long term effects of climate change. Saladini et al. (2018) presented a comprehensive diagnosis of the Water-Energy-Food Nexus in the Mediterranean region and pointed attention to the alarming trends towards food imbalance (e.g. import of cereals), scarcity of water resources (70% of which is used for agriculture) and the increased demand for energy for the extraction, treatment and supply of water, especially in some MENA countries.
The Mediterranean Sea is subject to overfishing. Estimates indicate that only 50% of the current fish-stock will be available by 2050, while fishing activity will decrease by at least 20% on the southern Mediterranean coast in the coming years. Aquaculture is currently the source of 50% of commercialized fish and plays an important role in the economy of some coastal communities, with an increase of 112% by 2030 compared to 2010 values in European Mediterranean countries.
2. The 2020 SDG Index and Dashboards
The SDG Index tracks country performance towards the SDGs. All 17 goals are weighted equally in the Index and the score signifies a country’s position between the worst (0) and the best or target (100) outcomes. Table 1 shows the SDG Index and world rank for 24 Mediterranean countries, classified according to region and income group. As a comprehensive system, hosting 520 million people, the Mediterranean region has an average index score of 73.5, hypothetically corresponding to the 50th position of the world rank. This suggests that the Mediterranean region is on average over 73% of the way to the fully achievement of the 17 SDGs comprehensively.Among the 24 Mediterranean Countries, most of European countries perform well on the Index score. Among the four Mediterranean regions, values of mean index (weighted by population) are variable, being 78.5 (ideally corresponding to the world rank 18) in Europe West, 74.8 in Europe East (world rank 38), 70.2 in North Africa and the Middle East (world rank 72). However, even European countries at the top of the list perform significantly below the maximum score of 100 and need significant improvements. Libya and Palestine are not included in the SDG index list being most of data unavailable; nevertheless, they are both included in the discussion concerning the indicators.
Values of the Spillover Index have been also reported in the table. They measure transboundary impacts generated by one country on others, which may in turn undermine the other countries’ capacities to achieve the SDGs. The assessment refers to statistics on financial spillovers (e.g., financial secrecy, profit shifting), environmental and social impacts embodied into trade and consumption (e.g., imported CO2 emissions, imported biodiversity threats, accidents at work embodied into
trade), and security/development cooperation (ODA, weapons exports). Index score ranges from 0 (poor performance, i.e., significant negative spillovers) to 100 (good performance, i.e., no significant negative spillovers). It is clear how the spillover index scores are often inversely proportional to the SDG index. In other words, impacts of countries in Europe West, with higher income and negative spillover effects, are partially imposed upon other countries and risk to compromise their performance and chances for improvement. Table 1 | SDG Index, Global rank and Spillover index (values of aggregated regions are weighted per population). Income group Population SDG INDEX score Global rank Spillover index
France E west HIC 65,273,512 81.1 4 51.1
Greece E west HIC 10,423,056 74.3 43 69.4
Italy E west HIC 60,461,828 77.0 30 69.0
Malta E west HIC 441,539 76.0 32 56.3
Portugal E west HIC 10,196,707 77.6 25 66.7
Spain E west HIC 46,754,783 78.1 22 61.3
EUROPE West E west _ 193,551,425 78.5 18 61.0
Albania E east UMIC 2,877,800 70.8 68 94.3
Bosnia and Herzegovina E east UMIC 3,280,815 73.5 50 95.8
Croatia E east HIC 4,105,268 78.4 19 83.1
Cyprus E east HIC 1,207,361 75.2 34 59.9
Montenegro E east UMIC 628,062 70.2 72 68.9
North Macedonia E east UMIC 2,083,380 71.4 62 93.8
Slovenia E east HIC 2,078,932 79.8 12 66.4
EUROPE East E east _ 16,261,618 74.8 38 84.6 SOUTHERN EUROPE E _ 209,813,043 78.2 20 62.8 Israel ME HIC 8,655,541 74.6 40 66.7 Jordan ME UMIC 10,203,140 68.1 89 89.2 Lebanon ME UMIC 6,825,442 66.7 95 78.8 Palestine ME _ 6,825,442 _ _ _ Syria ME LIC _ 59.3 126 98.4 Turkey ME UMIC 84,339,067 70.3 70 93.3 MIDDLE EAST ME _ 116,848,632 70.2 72 89.9 Algeria NA UMIC 43,851,043 72.3 56 97.4 Egypt NA LMIC 102,334,403 68.8 83 98.5 Libya NA _ _ _ _ _ Morocco NA LMIC 36,910,558 71.3 64 98.1 Tunisia NA LMIC 11,818,618 71.4 63 94.2 NORTH AFRICA NA _ 194,914,622 70.2 72 97.9 ME & NA MENA _ 311,763,254 70.2 72 95.0 MEDITERRANEAN AREA MED _ 521,576,297 73.5 50 81.9 Countries & regions
2.1 The SDG Dashboards
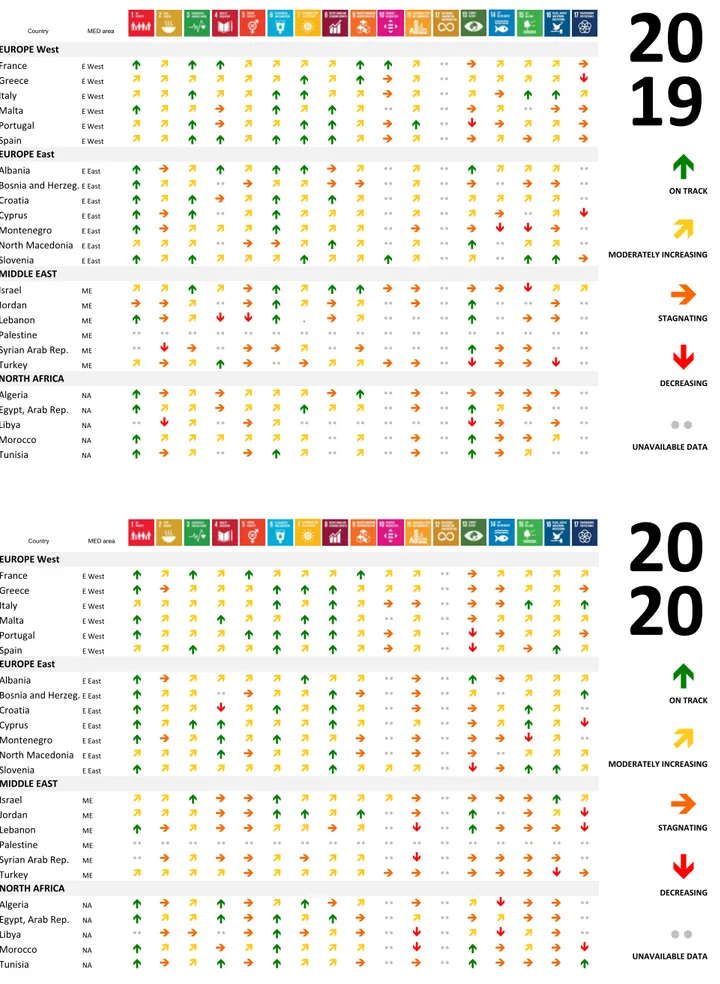
The SDG dashboards visually highlight strengths and weaknesses of each country on the 17 SDGs. The graphic representation is based on a four colours scale, from green to yellow, orange and red. The SDG indices are based on the set of indicators of each goal that are the same for all countries, except for a few additional data available for the OECD countries only. Nevertheless, colours represented in dashboards do not refer to an average but depends on the two worst indicators under each goal (this is the reason why traffic lights do not exactly match with index values). The SDG Dashboards for the Mediterranean region have been composed by assembling the results per each of the 24 countries. Despite minor changes occurred in the set of indicators and assessment methods with respect to the 2019 edition, Figure 2 and 3 show both the 2019 and 2020 values, combined with the SDG index scores. For comparison, black arrows in the 2020 dashboard of Figure 2 show increased or decreased results compared to 2019. The SDG indices, displayed in dashboards, show that the road to achieve the 17 goals of the 2030 Agenda is still long. In general, the dashboards allow for highlighting the magnitude of the challenges to be faced and help raise awareness on the urgent need for action. Nevertheless, since indices and dashboards result from aggregated parameters, they do not provide exhaustive information for making choices. Hotspots and needs cannot be easily determined based on the score of the SDG index and the indices per each goal. A backward disaggregation into source variables is necessary for a proper understanding of current dynamics. Moreover, specific thresholds should be set considering local instead of global conditions in order to provide more reliable and site-specific evaluations (for example, the poverty line should relate to each specific country instead of setting a world-based threshold). Aiming at understanding the factors that can determine real changes in a country’s performance, indices should be investigated through their component indicators and the data sources underlying the indicators. The desired outcome of monitoring the SDGs is to be able to indicate the road to take, anticipating possible actuation scenarios, estimating the effects of a series of possible actions and judging the degree of penetration these actions need to have in order to make progress towards the goal, namely, a transition from a red light situation to an orange, yellow then green light situation. The following section provides a new representation of the SDG dashboard through a sequence of maps, one per each indicator, of 24 Mediterranean countries. Each indicator has been analysed and interpreted to determine the state of the art in the Mediterranean region and try to plan possible scenarios of improvement towards the achievement of the SDGs.
Country MED area SDG index World rank Income 1 2 3 4 5 6 7 8 9 10 11 12 13 14 15 16 17
EUROPE West
France E West 81.5 4 HIC
Greece E West 71.4 50 HIC
Italy E West 75.8 30 HIC
Malta E West 76.1 28 HIC
Portugal E West 76.4 26 HIC
Spain E West 77.8 21 HIC
EUROPE East
Albania E East 70.3 60 UMIC
Bosnia and Herzeg. E East 69.4 69 UMIC
Croatia E East 77.8 22 HIC
Cyprus E East 70.1 61 HIC
Montenegro E East 67.3 87 UMIC
North Macedonia E East 69.4 70 UMIC
Slovenia E East 79.4 12 HIC
MIDDLE EAST Israel ME 71.5 49 HIC Jordan ME 68.1 81 UMIC Lebanon ME 65.7 94 UMIC Palestine ME _ _ UMIC Syrian Arab Rep. ME 58.1 123 LIC Turkey ME 68.5 79 UMIC NORTH AFRICA Algeria NA 71.1 53 UMIC Egypt, Arab Rep. NA 66.2 92 LMIC Libya NA UMIC Morocco NA 69.1 72 LMIC Tunisia NA 70.0 63 LMIC SDG ACHIEVEMENT CHALLENGES REMAIN SIGNIFICANT CHALLENGES MAJOR CHALLENGES UNAVAILABLE DATA
20
19
Country MED area Income 1 2 3 4 5 6 7 8 9 10 11 12 13 14 15 16 17
EUROPE West
France E West 81.1 ! 4 " HIC
Greece E West 74.3 # 43 # HIC
Italy E West 77.0 # 30 " HIC
Malta E West 76.0 ! 32 ! HIC
Portugal E West 77.6 # 25 # HIC
Spain E West 78.1 # 22 ! HIC
EUROPE East
Albania E East 70.8 # 68 ! UMIC
Bosnia and Herzeg. E East 73.5 # 50 # UMIC
Croatia E East 78.4 # 19 # HIC
Cyprus E East 75.2 # 34 # HIC
Montenegro E East 70.2 # 72 # UMIC
North Macedonia E East 71.4 # 62 # UMIC
Slovenia E East 79.8 # 12 " HIC
MIDDLE EAST Israel ME 74.6 # 40 # HIC Jordan ME 68.1 " 89 # UMIC Lebanon ME 66.7 # 95 ! UMIC Palestine ME _ _ UMIC Syrian Arab Rep. ME 59.3 # 126 ! LIC Turkey ME 70.3 # 70 # UMIC NORTH AFRICA Algeria NA 72.3 # 56 ! UMIC Egypt, Arab Rep. NA 68.8 83 # LMIC Libya NA _ _ UMIC Morocco NA 71.3 # 64 # LMIC Tunisia NA 71.4 # 63 " LMIC
SDG index World rank
20
20
SDG ACHIEVEMENT CHALLENGES REMAIN SIGNIFICANT CHALLENGES MAJOR CHALLENGES UNAVAILABLE DATAFigure 3 | Compared 2019-2020 SDG Trend Dashboards for Mediterranean countries towards 2030.
Country MED area 1 2 3 4 5 6 7 8 9 10 11 12 13 14 15 16 17
EUROPE West France E West ! " ! ! " " " " ! ! " ## $ " " " $ Greece E West " " " " " " ! " ! $ " ## " " " " % Italy E West " " ! " " ! ! " " $ " ## " $ ! ! " Malta E West ! " " $ " ! " ! " ## " ## $ " ## $ $ Portugal E West " " ! $ " " ! ! " $ ! ## % $ " " $ Spain E West " " ! ! " ! ! ! " $ " ## $ " $ " $ EUROPE East Albania E East ! $ " ! " ! ! $ " ## " ## ! " " " ## Bosnia and Herzeg.E East ! " " ## $ " " $ $ ## " ## $ ## $ $ ## Croatia E East ! " ! $ " ! " ! " ## " ## " " " " ## Cyprus E East ! $ ! ## " ! " " " ## " ## " $ ## " % Montenegro E East ! $ " " " ! " " " ## $ ## $ % % $ ## North Macedonia E East " " " ## $ $ " ! " ## " ## ! ## " " ## Slovenia E East ! " ! " " " ! " " ! " ## " ## ! ! $ MIDDLE EAST Israel ME " " ! " $ ! " ! ! $ $ ## $ $ % " " Jordan ME $ $ " ## $ ! " $ " ## $ ## ! ## ## $ ## Lebanon ME ! $ " % % ! . $ " ## ## ## ! ## $ $ ## Palestine ME ## ## ## ## ## ## ## ## ## ## ## ## ## ## ## ## ## Syrian Arab Rep. ME ## % $ ## $ $ " ## $ ## ## ## ! $ $ ## ## Turkey ME " $ " ! $ ## $ " " $ $ ## % $ $ % ## NORTH AFRICA Algeria NA ! $ " $ " " " $ ! ## $ ## $ $ $ $ ## Egypt, Arab Rep. NA ! " " $ " " ! " " ## $ ## ! " $ ## ## Libya NA ## % " ## $ " ## ## ## ## ## ## % $ ## $ ## Morocco NA ! " " " " " " ## " ## $ ## ! $ $ " ## Tunisia NA ! $ " ## $ ! " ## " ## $ ## ! $ " ## ##
!
"
#
$
%%
20
19
ON TRACK MODERATELY INCREASING STAGNATING DECREASING UNAVAILABLE DATACountry MED area 1 2 3 4 5 6 7 8 9 10 11 12 13 14 15 16 17
EUROPE West France E West ! " ! " ! " " " ! " " ## $ " " " " Greece E West ! $ " " " ! ! ! " " " ## $ $ " " $ Italy E West " " " " " ! " ! " $ $ ## $ $ ! " ! Malta E West ! " " ! " " ! ! " ## " ## $ " " " " Portugal E West ! " " " ! ! ! ! " $ " ## % $ " " $ Spain E West " " ! " " ! " ! " $ " ## % " $ ! " EUROPE East Albania E East ! $ " " " " ! " " ## $ ## ! $ " " " Bosnia and Herzeg.E East ! " " ## $ " " ! $ ## $ ## " ## " " ! Croatia E East ! " " % " ! " ! " ## $ ## $ " ! " ## Cyprus E East ! " ! ! " " " ! " ## " ## $ " ! " % Montenegro E East ! $ " ! " ! " " $ ## $ ## $ $ % " ## North Macedonia E East " " " ! $ " " ! $ ## $ ## $ ## " " " Slovenia E East ! " " " " " " ! " " " ## % $ ! ! " MIDDLE EAST Israel ME " " ! $ $ ! " " " " $ ## $ $ $ ! " Jordan ME " " " $ $ ! ! " ! ## $ ## ! ## $ " % Lebanon ME ! $ " $ $ " " $ " ## % ## ! $ $ $ % Palestine ME ## ## ## ## ## ## ## ## ## ## ## ## ## ## ## ## ## Syrian Arab Rep. ME ## $ " $ $ " $ " " ## % ## $ $ $ $ ## Turkey ME " " " " $ " " " " $ $ ## $ $ $ % $ NORTH AFRICA Algeria NA ! $ " ! $ " ! $ " ## $ ## " % $ $ ## Egypt, Arab Rep. NA ! " " ! $ ! " ! $ ## " ## $ " $ $ ## Libya NA ## $ $ ## $ ! $ " $ ## % ## " % " $ ## Morocco NA ! " " $ " ! " " " ## % ## ! $ " $ % Tunisia NA ! $ " ! $ ! " " $ ## $ ## ! $ $ $ !
20
20
!
"
#
$
%%
ON TRACK MODERATELY INCREASING STAGNATING DECREASING UNAVAILABLE DATA3. Six Transformations to achieve the SDGs and challenges
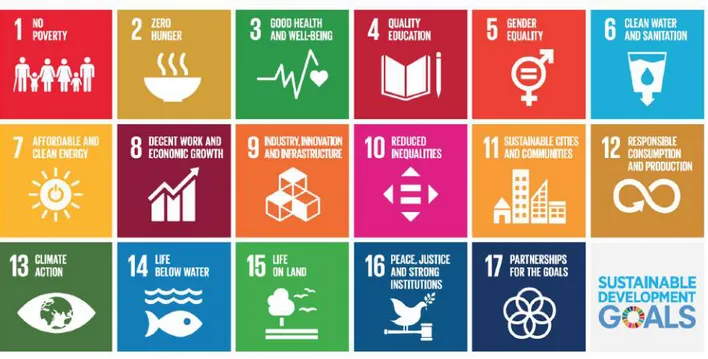
The 2030 Agenda is composed of 17 Sustainable Development Goals (SDGs) and represents the common international political program that the 193 UN member countries have set themselves to reach by 2030. It was officially adopted on September 25, 2015, at a UN Summit attended by over 150 heads of state. The 17 SDGs (Figure 4) are subdivided and better specified by 169 targets and the Agenda also includes recommendations on how nations should proceed in the implementation of the goals. It represents an international opportunity of transformation for humanity, a global vision for prosperity, people and the planet, which considers the three pillars of sustainable development: environmental protection, social inclusion and economic development.
With the 2030 Agenda and the Sustainable Development Goals countries have committed themselves to time-bound targets for Prosperity, People, Planet, Peace, and Partnership (United Nations 2015). They recognize that ending poverty must go hand-in-hand with strategies that build economic growth and address a range of social needs including education, health, social protection, and job opportunities, while tackling climate change and environmental protection. The Paris Agreement, which is part of the SDG framework, requires every country to achieve net zero greenhouse gas emissions by mid-century. Figure 4 | 17 Sustainable Development Goals – SDGs. Aiming at identifying driving principles to share and make action, an operative framework to meet the 17 SDGs and the underlying 169 targets has been proposed by Sachs et al. (2019), organized into six broad Transformations. These are intended as sets of potential interventions to accomplish “deep, deliberate, long-term structural changes in resource use, infrastructure, institutions, technologies and social relations” to be undertaken in a short period of time. Any transformation would require guidelines adapted to any specific context, such as the Mediterranean region and its 24 countries, and interpreted according to site-specific social, environmental and economic backgrounds.
Figure 5 lists the six Transformations and their potential interactions with the SDGs, given that each transformation contributes to several SDGs and, similarly, the outcomes for each SDG require contributions from more than one Transformation. The benefit of the Transformations is that they group SDG interventions in ways that promote effective implementation strategies by governments, business, and civil society.
This section of the report is therefore structured into 6 paragraphs, one per each transformation. Significant indicators have been selected and, based on their interpretation, a set of the main challenges has been identified. Each challenge is shown in a dedicated record, including values of reference indicators and, when necessary, additional raw data for a clearer understanding of the observed phenomena. Moreover, each indicator has been represented in the form of maps, through the colour scale from green, to yellow, orange and red.
Maps make the SDG indicators spatially explicit and provide a comprehensive at-a-glance view of the current state and any progress of Mediterranean countries towards the SDGs (Maps made through datawrapper.de). The indicators mapped are also listed in the tables and grouped by geographic area: Western Europe (WE), Eastern Europe (EE), Middle East (ME) and North Africa (NA). Raw data helps to understand the relevance and magnitude of the phenomena monitored, for example in terms of the number of people affected. Tables and maps provide a clear picture of current state and allow for determining priorities and most urgent actions to be shared by the 24 countries. This systematic approach has a double role. First it aims at processing indices and dashboards and make them work as an effective decision support tool to achieve the SDGs in the Mediterranean area. Second, it constitutes an hexagonal operational framework to engage six reference institutions in the Mediterranean area, namely MED hubs, and let cooperate to implement and monitor SDGs.
Six MED hubs have been selected and assigned one per each transformation. Their role in the reporting process was to evaluate the state of the art as shown in this section and contribute to determine policies and best practices to accomplish the six transformations (next session). The six MED hubs are led by six SDSN National and Regional networks operating in the Mediterranean region: SDSN France hosted by CY Cergy Paris Université, Kedge Business School, and PSL University; SDSN Spain hosted by the Universidad Autónoma de Madrid; SDSN Greece hosted by the International Center for Research on the Environment and the Economy and the Political Economy of Sustainable Development Lab in Athens; SDSN Mediterranean hosted by the University of Siena; SDSN Turkey hosted by the Boğaziçi University in Istanbul; SDSN Cyprus hosted by The Cyprus Research and Educational Foundation (CREF) in partnership with the Neapolis University and the Frederick University.
The policies are addressed to governments and other stakeholders to determine how to organize interventions – such as improved policies, public and private investments, and regulation – and also useful to promote participatory practices and perform cooperative decision processes, in line with the SDSN statement: “achieving the SDGs requires deep changes to policies, investments, and technologies. But success will not be possible without social activism that mobilizes stakeholders and changes norms to enable the SDG Transformations. Similarly, international diplomacy and international collaboration are critical underpinnings of achieving the SDGs, particularly to address international spillover effects, including international development finance where needed” (Sachs et al 2019a). Figure 5 | 6 SDG Transformations and the reference Mediterranean Hubs. EDUCATION GENDER INEQUALITY HEALTH, WELLBEING DEMOGRAPHY ENERGY DECARBONISATION SUSTAINABLE INDUSTRY SUSTAINABLE FOOD, LAND, WATER, OCEANS SUSTAINABLE CITIES and COMMUNITIES HARNESSING the DIGITAL REVOLUTION
SDSN France
SDSN Spain
SDSN Greece
SDSN Med (Italy)
SDSN Turkey
SDSN Cyprus
3.1 Transformation 1. Education, gender and inequality
A set of indicators has been selected as the most relevant to report on the current state, highlight hotspots and track the progress towards the Transformation 1. This aims to expand and transform the educational systems of countries achieving universal standards of learning outcomes, to reduce inequalities through anti-discrimination measures and social safety nets and to definitely overcome gender inequalities (Sachs et al. 2019).Figure 3.1 | Selected indicators and challenges in the transformation 1. Education, gender and inequality.
Figure 3.1 shows the 21 representative indicators and the corresponding Goals, that allowed for identifying 10 main challenges to be faced to accomplish the transformation. The following records, one per each challenge, show values of the indicators and their spatially explicit representation into maps. Indicators in the tables are often coupled with the corresponding absolute values, such as the number of people involved, and, when useful, other additional data for their interpretation. References for all indicators and additional data (namely, Add.) are listed in captions.
GOALS INDICATORS CHALLENGES
1 - No poverty Map 1.2 Poverty headcount ratio at $3.20/day (% population) Poverty Map 4.1 Net primary enrolment rate (%) Map 4.2 Lower secondary completion rate (%) Map 4.4 OECD only: Participation rate in pre-primary organized learning (% ages 4-6) Map 4.5 OECD only: Population age 25-34 with tertiary educational attainment (%) Map 4.3 Literacy rate of 15-24 year olds, both sexes (%) Map 4.8 OECD only: Underachievers in science (% 15 years old) Map 4.9 OECD only: Resilient students in science (% 15 years old) Map 5.1 Demand for family planning satisfied by modern methods (%) Map 5.2 Ratio of female to male mean years of education received of population age 25+ Map 5.3 Ratio of female to male labour force participation rate Map 5.4 Seats held by women in national parliaments (%) Map 5.5 OECD only: Gender wage gap (Total, % male median wage) 9 - Industry, innovation
and infrastructure Map 9.10 OECD only: Women in science and engineering (%)
Map 8.4 Unemployment rate (% total labor force)
Map 8.7 OECD only: Youth not in employment, education or training (NEET) (%)
Map 8.2 Victims of Modern Slavery (per 1,000 population)
Map 16.7 Children 5–14 years old involved in child labour (%)
Map 16.9 Press Freedom Index (best 0 - 100 worst) Press Freedom
10 - Gender equality Map 10.1 Gini Coefficient adjusted for top income (1-100) Wealth distribution
17 - Parnership for the
goals Map 17.1 Government spending on Health and Education (% GDP) Domestic policy
Literacy Women emancipation 16 - Peace, Justice and strong institutions Labor rights 8 - Decent work and economic growth Job market 4 - Quality education Scholarship 5 - Gender equality Women rights
EDUCATION
GENDER
INEQUALITY
01
C
HALLENGEP
OVERTYOver 14 million people in the MENA area live with less than $ 3.20 per day. Despite almost 0.5 million people came out of absolute poverty compared to 2019 (from 17.4 to 16.9), mainly in the Middle East, considering the median income, there are almost 50 million people (12%) in the Med area at risk of poverty, including 28 million Europeans.
Data source: 1.2– World data lab (2019) 1.1 Add: Proportion of people living below 50 percent of median income (%) – World Bank (2019)
% mln % mln France E West 0.30 0.20 10.10 6.75 Greece E West 2.42 0.25 14.90 1.60 Italy E West 1.78 1.08 16.00 9.69 Malta E West 0.16 0.00 9.40 0.04 Portugal E West 0.89 0.09 11.00 1.13 Spain E West 1.32 0.62 16.10 7.50 1.15 2.23 13.67 26.72 Albania E East 4.35 0.13 12.00 0.34 Bosnia and Herzegovina E East 0.23 0.01 - -Croatia E East 1.14 0.05 13.20 0.54 Cyprus E East 0.08 0.00 8.50 0.10 Montenegro E East 0.08 0.00 20.50 0.13 North Macedonia E East 8.10 0.17 17.70 0.37 Slovenia E East 0.22 0.00 6.40 0.13 2.18 0.35 12.49 1.62 1.23 2.59 13.59 28.34 Israel ME 0.62 0.05 21.20 1.85 Jordan ME 9.19 0.94 - -Lebanon ME 0.06 0.00 - -Palestine ME 9.40 0.64 12.80 0.57 Syrian Arab Republic ME - - - -Turkey ME 0.33 0.28 15.60 12.65 1.09 1.92 15.99 15.07 Algeria NA 1.97 0.86 - -Egypt, Arab Republic NA 9.46 9.68 5.20 5.02 Libya NA - - - -Morocco NA 4.53 1.67 - -Tunisia NA 2.15 0.25 10.40 1.19 6.40 12.47 5.75 6.20 4.41 14.39 10.52 21.27 3.13 16.97 12.08 49.61 Countries and regions 1.2 Goal 1people living below 50% of median income MIDDLE EAST & NORTH AFRICA (11) MEDITERRANEAN AREA (24) Units EUROPE West (6) EUROPE East (7) SOUTHERN EUROPE (13) MIDDLE EAST (6) NORTH AFRICA (5)
S
CHOLARSHIPThe primary school enrollment looks similar in the four areas of the Med but the pupil/teacher ratio shows differences. MENA countries should improve the lower secondary completion rate. Some OECD countries need pre-primary and tertiary educational improvements. Trends are positive compared to 2019.
Data source: 4.1 – UNESCO (2020) 4.2 – UNESCO (2019) 4.4, 4.5 – OECD (2019) 4.1 Add: Pupil-teacher ratio, primary – UNESCO (2020)
4.1 pup./teach., primary 4.2
% - % % mln people left % mln people left France E West 99.75 - 99.75 99.82 0.01 46.94 4.24 Greece E West 97.48 9.38 97.48 92.74 0.04 42.82 0.71 Italy E West 97.62 11.48 97.62 93.90 0.17 27.73 4.76 Malta E West 99.54 12.94 100.44 x x x x Portugal E West 98.59 12.35 98.59 99.32 0.00 35.08 0.74 Spain E West 97.19 13.13 97.19 93.18 0.17 44.26 2.93 98.29 11.98 93.10 96.24 0.39 39.77 13.38 Albania E East 94.53 17.57 96.34 x x x x Bosnia and Herzegovina E East - 16.93 - x x x x Croatia E East 88.04 13.51 93.09 x x x x Cyprus E East 97.49 12.04 97.61 x x x x Montenegro E East 96.55 - 99.40 x x x x North Macedonia E East 94.89 14.91 88.09 x x x x Slovenia E East 97.96 13.80 97.96 94.08 0.01 40.71 0.15 93.44 15.10 94.50 - - - -97.99 12.32 93.19 - - - -Israel ME 96.96 12.07 96.96 99.09 0.01 48.03 0.62 Jordan ME 80.86 18.54 59.03 x x x x Lebanon ME 86.30 12.48 52.41 x x x x Palestine ME 91.70 24.45 78.20 x x x x Syrian Arab Republic ME 67.97 - 53.81 x x x x Turkey ME 99.03 16.98 99.03 67.64 2.18 33.28 8.51 92.42 16.76 86.59 - - - -Algeria NA 97.64 24.32 84.64 x x x x Egypt, Arab Republic NA 97.03 23.68 84.58 x x x x Libya NA - - - x x x x Morocco NA 99.10 26.80 64.92 x x x x Tunisia NA 97.80 16.87 77.38 x x x x 97.61 24.00 80.36 - - - -95.49 21.29 82.91 - - - -96.49 18.38 87.02 - 2.58 - 22.67 4.4 4.5 Countries and regions Goal 4 MIDDLE EAST & NORTH AFRICA (11) MEDITERRANEAN AREA (24) Units EUROPE West (6) EUROPE East (7) SOUTHERN EUROPE (13) MIDDLE EAST (6) NORTH AFRICA (5)
C
HALLENGEL
ITERACYAlmost 2.7 million of youths in MENA do not show good literacy levels. Scientific skills of students should be much improved also in some OECD countries. Educational opportunities become available also for students from low income families.
Data source: 4.3 – UNESCO (2019) 4.8 – OECD (2019) 4.9 – OECD (2019)
4.8 4.9 % mln people left % % France E West - - 20.50 28.93 Greece E West 99.16 0.01 31.74 19.53 Italy E West 99.93 0.00 25.88 27.41 Malta E West 99.30 0.00 x x Portugal E West 99.66 0.00 19.56 41.12 Spain E West 99.72 0.01 21.28 37.34 99.76 0.03 22.92 30.60 Albania E East 99.33 0.00 x x Bosnia and Herzegovina E East 99.66 0.00 x x Croatia E East 99.72 0.00 x x Cyprus E East 99.82 0.00 x x Montenegro E East 99.11 0.00 x x North Macedonia E East 98.60 0.00 x x Slovenia E East 99.80 0.00 14.56 37.74 99.47 0.01 - -99.72 0.04 - -Israel ME - - 33.10 15.96 Jordan ME 99.34 0.01 x x Lebanon ME 99.75 0.00 x x Palestine ME 99.40 0.01 x x Syrian Arab Republic ME 92.45 0.24 x x Turkey ME 99.75 0.03 25.15 48.22 92.66 0.29 - -Algeria NA 97.43 0.16 x x Egypt, Arab Republic NA 88.19 1.99 x x Libya NA 99.60 0.00 x x Morocco NA 97.73 0.13 x x Tunisia NA 96.21 0.06 x x 92.56 2.35 - -92.60 2.64 - -94.12 2.68 - -4.3 Countries and regions Goal 4 MIDDLE EAST & NORTH AFRICA (11) MEDITERRANEAN AREA (24) Units EUROPE West (6) EUROPE East (7) SOUTHERN EUROPE (13) MIDDLE EAST (6) NORTH AFRICA (5)
W
OMAN RIGHTSWoman rights must be carefully monitored e.g. performances look good enough in terms of opportunities for family
planning (except for low demands for assistance recorded in Eastern Europe and the Middle East) and rate of scholarship (with a few countries performing below 80%). Further improvements are desirable anyhow.
Data source: 5.1 – UNDESA (2018) 5.2 – UNESCO (2019)
5.1 5.2 % % France E West 95.50 96.55 Greece E West 62.00 95.37 Italy E West 68.20 95.24 Malta E West 74.80 94.83 Portugal E West 79.10 100.00 Spain E West 84.50 97.00 81.76 96.36 Albania E East 4.90 97.06 Bosnia and Herzegovina E East 21.90 78.90 Croatia E East 61.50 90.83 Cyprus E East - 98.36 Montenegro E East 42.80 88.43 North Macedonia E East 22.30 90.20 Slovenia E East 78.60 99.19 37.01 90.85 78.42 95.93 Israel ME 71.10 100.00 Jordan ME 56.70 95.33 Lebanon ME 63.80 95.51 Palestine ME 64.80 95.70 Syrian Arab Republic ME 53.30 82.14 Turkey ME 59.70 82.14 59.68 85.29 Algeria NA 77.20 92.77 Egypt, Arab Republic NA 80.00 83.75 Libya NA 24.00 111.11 Morocco NA 68.60 71.88 Tunisia NA 73.20 81.01 74.68 84.25 68.60 84.68 72.11 90.01 Countries and regions Goal 5 MIDDLE EAST & NORTH AFRICA (11) MEDITERRANEAN AREA (24) Units EUROPE West (6) EUROPE East (7) SOUTHERN EUROPE (13) MIDDLE EAST (6) NORTH AFRICA (5)
C
HALLENGEW
OMAN EMANCIPATIONOpportunities for women should be further supported e.g. in terms of participation in labour force (almost 78% in Europe vs. 34% in MENA) and policy (e.g. seats held by women in national parliaments: 37% in Europe; 18% in MENA) and wage gaps in OECD countries. Rates of women in leading positions are very low in west Europe and MENA.
Data source: 5.3 – ILO (2019) 5.4 – IPU (2019) 5.5 – OECD (2020) 9.10 – OECD (2018) 5.4 Add: Firms with female top manager (% of firms) – World Bank (2020)
Goal 9 5.3 5.4 Firms with F top manager 5.5 9.10 % % % % % France E West 84.10 39.51 - 13.00 29.21 Greece E West 74.82 20.67 17.20 4.50 -Italy E West 68.71 35.71 15.30 5.60 -Malta E West 65.54 13.43 11.30 x x Portugal E West 83.98 40.00 14.00 14.80 38.10 Spain E West 81.79 44.00 - 11.50 27.10 78.24 38.34 6.46 9.97 -Albania E East 72.71 29.51 18.10 x x Bosnia and Herzegovina E East 60.77 21.43 16.60 x x Croatia E East 78.81 19.21 27.00 x x Cyprus E East 85.50 19.64 8.20 x x Montenegro E East 75.20 29.63 15.00 x x North Macedonia E East 63.44 40.00 21.30 x x Slovenia E East 85.30 27.78 18.80 5.00 31.05 73.14 25.58 19.66 - -77.83 37.38 7.50 - -Israel ME 85.84 25.00 - 21.80 -Jordan ME 22.21 15.38 3.10 x x Lebanon ME 33.15 4.69 - x x Palestine ME 27.40 - 0.90 x x Syrian Arab Republic ME 16.83 12.40 - x x Turkey ME 46.22 17.32 3.90 6.90 30.73 41.55 16.37 2.74 - -Algeria NA 22.21 25.76 - x x Egypt, Arab Republic NA 31.33 15.10 4.90 x x Libya NA 32.60 15.96 - x x Morocco NA 30.41 20.51 5.40 x x Tunisia NA 34.33 24.88 - x x 29.42 19.03 3.49 - -34.23 17.98 3.19 - -51.18 25.84 4.87 - -Countries and regions Goal 5 MIDDLE EAST & NORTH AFRICA (11) MEDITERRANEAN AREA (24) Units EUROPE West (6) EUROPE East (7) SOUTHERN EUROPE (13) MIDDLE EAST (6) NORTH AFRICA (5)
J
OB MARKETThe job market looks stagnant. Unemployment rates are around 11% in average in MED, with alarming values in Western Europe (13 million) and MENA (24 million) and almost 39 million in total. The NEET phenomenon is increasing in all OECD countries involving almost 8 million youths.
Data source: 8.4 – ILO (2019) 8.7 – OECD (2019)
% mln % mln France E West 8.43 3.50 16.10 1.25 Greece E West 17.24 1.19 21.46 0.23 Italy E West 9.89 3.82 23.86 1.39 Malta E West 3.47 0.01 x x Portugal E West 6.33 0.42 11.58 0.12 Spain E West 13.96 4.31 19.06 0.86 10.61 13.25 18.98 3.85 Albania E East 12.33 0.24 x x Bosnia and Herzegovina E East 18.43 0.42 x x Croatia E East 6.94 0.18 x x Cyprus E East 7.27 0.06 x x Montenegro E East 14.88 0.06 x x North Macedonia E East 17.76 0.26 x x Slovenia E East 4.20 0.06 9.67 0.02 9.51 1.29 - -10.52 14.53 - -Israel ME 3.86 0.21 13.35 0.18 Jordan ME 14.72 0.91 x x Lebanon ME 6.23 0.29 x x Palestine ME 26.80 0.71 x x Syrian Arab Republic ME 8.37 0.91 x x Turkey ME 13.49 7.43 26.48 3.55 12.34 10.44 - -Algeria NA 11.70 3.14 x x Egypt, Arab Republic NA 10.76 6.46 x x Libya NA 18.56 0.83 x x Morocco NA 9.02 2.14 x x Tunisia NA 16.02 1.25 x x 11.25 13.82 - -11.69 24.26 - -11.23 38.79 - 7.60 8.4 8.7 Goal 8 Countries and regions MIDDLE EAST & NORTH AFRICA (11) MEDITERRANEAN AREA (24) Units EUROPE West (6) EUROPE East (7) SOUTHERN EUROPE (13) MIDDLE EAST (6) NORTH AFRICA (5)
C
HALLENGEL
ABORR
IGHTSNumbers show an unexpected scenario with almost 2 million workers overexploited or underpaid in the MED area, including European countries (almost 500,000). The exploitation of child labor involves 340 million children, 11 million of which in Europe. Rates of “regular” workers with proper contracts should be improved (68% in MENA).
Data source: 8.2 – Walk Free Foundation (2018) 16.7 – UNICEF (2017) 8.2 Add: Wage and salaried workers, total (% of total employment) – ILO (2020) Wage and salaried workers n./103 n. people % % mln France E West 2.01 134,577 88.36 0.00 0.00 Greece E West 7.91 84,899 66.63 0.00 0.00 Italy E West 2.43 146,908 77.08 0.00 0.00 Malta E West - - 85.96 - -Portugal E West 2.48 25,540 83.34 3.40 3.41 Spain E West 2.27 105,923 84.08 0.00 0.00 2.55 497,847 82.34 0.16 3.41 Albania E East 6.87 19,695 44.63 5.10 1.80 Bosnia and Herzegovina E East 3.42 11,374 78.91 5.30 1.86 Croatia E East 5.99 24,504 88.00 - -Cyprus E East 4.23 5,025 86.77 - -Montenegro E East 5.86 3,647 78.41 12.50 0.97 North Macedonia E East 8.66 18,040 76.69 12.50 2.89 Slovenia E East 2.17 4,492 85.02 0.00 0.00 5.34 86,778 76.00 6.21 7.53 2.77 584,625 81.83 0.50 10.93 Israel ME 3.86 34,309 87.64 0.00 0.00 Jordan ME 1.80 17,961 84.99 1.70 3.80 Lebanon ME 1.72 11,760 63.77 1.90 2.24 Palestine ME - - 69.84 5.70 6.17 Syrian Arab Republic ME - - 62.94 4.00 14.94 Turkey ME 6.50 534,914 68.50 5.90 78.97 5.55 598,943 69.98 4.59 106.13 Algeria NA 2.66 112,116 68.39 5.00 35.37 Egypt, Arab Republic NA 5.52 543,200 68.75 7.00 132.08 Libya NA - - 93.17 - -Morocco NA 2.45 88,127 49.83 8.30 51.53 Tunisia NA 2.18 25,177 72.95 2.10 3.51 4.08 768,621 66.18 6.58 222.49 4.62 1,367,564 67.73 5.77 328.61 3.85 1,952,189 73.31 4.30 339.55 16.7 8.2 Goal 16 Goal 8 Countries and regions MIDDLE EAST & NORTH AFRICA (11) MEDITERRANEAN AREA (24) Units EUROPE West (6) EUROPE East (7) SOUTHERN EUROPE (13) MIDDLE EAST (6) NORTH AFRICA (5)
P
RESSF
REEDOMBased on a survey on the degree of freedom available to journalists, countries in the MENA area show the most critical limitations, with an average value of the index higher than 50. The average for Europe is almost 23 points. Initiatives to safeguard freedom of press as well as to increase professionalism of journalists are desirable.
Data source: 16.9 – Reporters sans Frontièrs (2019)
Goal 16 16.9 -France E West 22.21 Greece E West 29.08 Italy E West 24.98 Malta E West 29.74 Portugal E West 12.63 Spain E West 21.99 22.91 Albania E East 29.84 Bosnia and Herzegovina E East 29.02 Croatia E East 29.03 Cyprus E East 21.74 Montenegro E East 32.74 North Macedonia E East 31.66 Slovenia E East 22.31 28.27 23.34 Israel ME 30.80 Jordan ME 43.11 Lebanon ME 32.44 Palestine ME -Syrian Arab Republic ME 71.78 Turkey ME 52.81 52.34 Algeria NA 45.75 Egypt, Arab Republic NA 56.47 Libya NA 55.77 Morocco NA 43.98 Tunisia NA 29.61 50.25 51.06 40.19 Countries and regions MIDDLE EAST & NORTH AFRICA (11) MEDITERRANEAN AREA (24) Units EUROPE West (6) EUROPE East (7) SOUTHERN EUROPE (13) MIDDLE EAST (6) NORTH AFRICA (5)
C
HALLENGEW
EALTHD
ISTRIBUTIONValues are correlated to the GINI index measuring the level of inequality in family incomes. Inhomogeneity is recorded in the all MED area with highest values in the Middle East. It is an alarming phenomenon also in Europe and with consequent risks of unfair economies and social instability.
Data source: 10.1 – Chandy L., Seidel B. (2017) Goal 10 10.1 -France E West 33.31 Greece E West 45.14 Italy E West 38.83 Malta E West 29.61 Portugal E West 42.14 Spain E West 38.55 37.39 Albania E East 41.68 Bosnia and Herzegovina E East 34.15 Croatia E East 36.58 Cyprus E East 33.95 Montenegro E East 40.50 North Macedonia E East 44.01 Slovenia E East 27.38 36.71 37.33 Israel ME 43.21 Jordan ME 41.06 Lebanon ME 36.17 Palestine ME -Syrian Arab Republic ME 46.47 Turkey ME 49.04 46.94 Algeria NA 31.52 Egypt, Arab Republic NA 49.60 Libya NA -Morocco NA 39.75 Tunisia NA 40.00 43.04 44.62 41.60 Countries and regions MIDDLE EAST & NORTH AFRICA (11) MEDITERRANEAN AREA (24) Units EUROPE West (6) EUROPE East (7) SOUTHERN EUROPE (13) MIDDLE EAST (6) NORTH AFRICA (5)
D
OMESTICP
OLICYTotal general (local, regional and central) government expenditure on health and education ranges from 11% of GDP in Europe West to around 7% in Europe East and MENA. Much higher effort is needed to support and guarantee the provision of essential services in this fields.
Data source: 17.1 – UNESCO (2019); WHO (2019)
Goal 17 17.1 % of GDP France E West 13.25 Greece E West 8.88 Italy E West 10.48 Malta E West 10.88 Portugal E West 10.82 Spain E West 10.60 11.61 Albania E East 6.73 Bosnia and Herzegovina E East -Croatia E East 10.10 Cyprus E East 9.20 Montenegro E East -North Macedonia E East 8.03 Slovenia E East 10.92 7.61 10.31 Israel ME 10.42 Jordan ME 7.30 Lebanon ME 6.27 Palestine ME -Syrian Arab Republic ME 6.72 Turkey ME 7.00 6.36 Algeria NA 7.36 Egypt, Arab Republic NA 5.30 Libya NA -Morocco NA 7.78 Tunisia NA 10.59 7.04 6.51 6.77 Countries and regions MIDDLE EAST & NORTH AFRICA (11) MEDITERRANEAN AREA (24) Units EUROPE West (6) EUROPE East (7) SOUTHERN EUROPE (13) MIDDLE EAST (6) NORTH AFRICA (5)
3.2 Transformation Health, Wellbeing and Demography
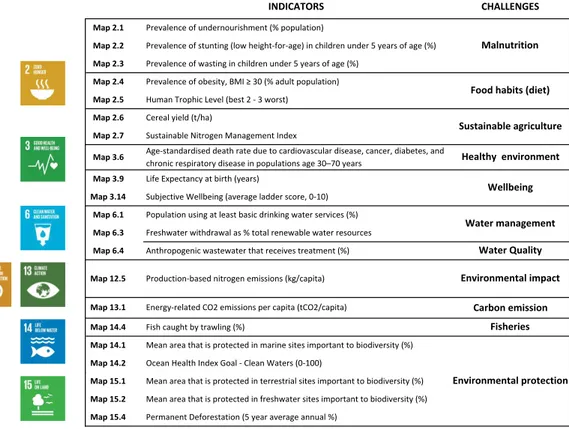
A set of indicators has been selected as the most relevant to report on the current state, highlight hotspots and track the progress towards the Transformation 2. This aims to promote initiatives and investments for health and wellbeing, starting from the principal output of a universal health coverage and publicly financed health systems that integrates prevention, therapeutic and palliative services, disease surveillance and control. Community health programs, including policies to raise the quality of life and promote healthy lifestyles, can improve health outcomes significantly (Sachs et al. 2019). Figure 3.2 | Selected indicators and challenges in the transformation 2. Health, Wellbeing and Demography.
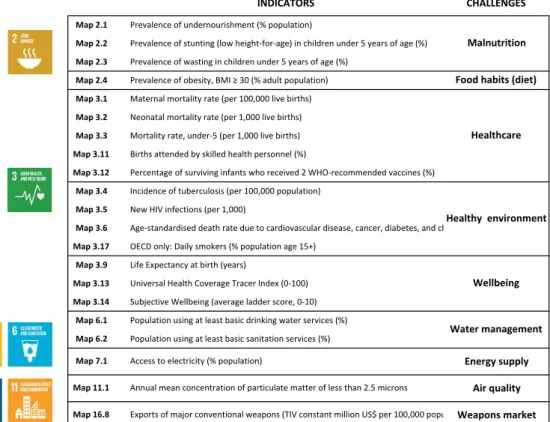
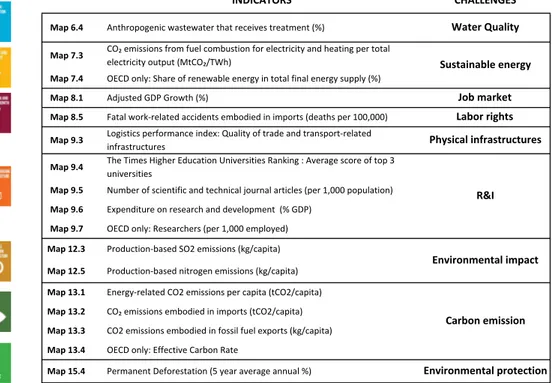
Figure 3.2 shows the 21 representative indicators and the corresponding Goals, that allowed for identifying the 9 challenges to be faced to accomplish the transformation. The following records, one per each challenge, show values of the indicators and their spatially explicit representation into maps. Indicators in the tables are often coupled with the corresponding absolute values, such as the number of people involved, and, when useful, other additional data for their interpretation. References for all indicators and additional data (namely, Add.) are listed in captions.
HEALTH WELLBEING DEMOGRAPHY
02
INDICATORS CHALLENGES Map 2.1 Prevalence of undernourishment (% population) Map 2.2 Prevalence of stunting (low height-for-age) in children under 5 years of age (%) Map 2.3 Prevalence of wasting in children under 5 years of age (%)Map 2.4 Prevalence of obesity, BMI ≥ 30 (% adult population) Food habits (diet)
Map 3.1 Maternal mortality rate (per 100,000 live births) Map 3.2 Neonatal mortality rate (per 1,000 live births) Map 3.3 Mortality rate, under-5 (per 1,000 live births) Map 3.11 Births attended by skilled health personnel (%) Map 3.12 Percentage of surviving infants who received 2 WHO-recommended vaccines (%) Map 3.4 Incidence of tuberculosis (per 100,000 population) Map 3.5 New HIV infections (per 1,000) Map 3.6 Age-standardised death rate due to cardiovascular disease, cancer, diabetes, and chronic respiratory disease in populations age 30–70 years Map 3.17 OECD only: Daily smokers (% population age 15+) Map 3.9 Life Expectancy at birth (years) Map 3.13 Universal Health Coverage Tracer Index (0-100) Map 3.14 Subjective Wellbeing (average ladder score, 0-10) Map 6.1 Population using at least basic drinking water services (%) Map 6.2 Population using at least basic sanitation services (%)
Map 7.1 Access to electricity (% population) Energy supply
Map 11.1 Annual mean concentration of particulate matter of less than 2.5 microns Air quality
Map 16.8 Exports of major conventional weapons (TIV constant million US$ per 100,000 population)Weapons market Water management
Malnutrition
Healthcare
Healthy environment