UNIVERSITY OF PISA
BIOS Research Doctorate School in BIOmolecular Science
PROGRAM IN EXPERIMENTAL AND MOLECULAR ONCOLOGY
XXV CYCLE (2010-2012)
Research Doctorate Thesis
ROLE OF MOLECULAR DETERMINANTS IN
PREDICTING RESISTANCE TO TRASTUZUMAB IN
PATIENTS DIAGNOSED WITH OVEREXPRESSING HER-2
METASTATIC BREAST CANCER
Supervisor Candidate
Prof. Generoso Bevilacqua Dr. Mazhar Salim AL-Zoubi
Tutor
Dedication
To my father, mother, brothers and sister for their love and support.
To my lovely wife Neda for her support, kindness and patience, and to my children Mona and Saba.
Acknowledgements
It was my pleasure and honor to be supervised by Professor Generoso Bevilacqua to do my Ph.D. degree. He gave me the opportunity of my life to do exciting research in the field of Molecular Oncology. I will not forget his guidance and support which was always available and invaluable. I am very thankful to Professor Bevilacqua for having me in his lab; I learned a lot of research skills and techniques that could not be gained without his support. Moreover, I appreciate his support to send me to Thomas Jefferson University-USA as a visiting scholar.
This dissertation would not be finished without the support, encouragement and help of many people who I appreciate.
My tutors’ Dr. Katia Zavaglia and Dr. Chiara Maria Mazzanti never stop encouraging, guidance and support every time I needed. Their continuous support was the spirit that guided me during my research especially when was difficult. I would like to thank everybody in my lab personally; Ms Maria Pia for her help, colleagues Mohammad, Valerio, Federica, Sara F., Francesca, Sara T., Alessandro, Claudia, and Evana for their technical help, scientific discussions and continuous support.
I am very grateful to Professor Allegrini for collaboration and the fruitful scientific discussion that significantly influences my thesis.
I would like to express my love and gratitude to my beloved families; for their understanding, endless love and priceless support during my study.
Table of Contents
ABSTRACT... …..9
OBJECTIVES ... …..11
INTRODUCTION: ... 12
PRECLINICAL STUDIES HAVE PROPOSED SOME MECHANISMS OFTRASTUZUMAB RESISTANCE ... 20
Obstacles for Trastuzumab binding to HER2 ... 21
Upregulation of HER2 downstream signallingpathways... 23
Signallingthrough multiple alternate pathways ... 25
Failure to trigger immune-mediated mechanisms to destroy tumor cells26 Other proposed mechanisms for Trastuzumab resistance... 28
Cyclin E ... 28
MIRNA ... 28
INFs : ... 29
HERCEPTIN(TRASTUZUMAB) SIDEEFFECTS... 30
ECONOMIC ANDCLINICALISSUES... 30
MATERIALS ANDMETHODS... 32
Specimen collection ... 32
DNA Extraction and evaluation... 32
RNA Extraction ... 33
cDNA Synthesis... 33
Primers and PCR... 34
PCR Reaction cleanup ... 34
DNA Sequencing ... 34
Sequencing Reaction Cleanup ... 34
Mutational analyses on HER-2, PTEN, PIK3CA and AKT1 genes; Polymorphism of FcγRII ... 35
qPCR... 37
Pyro-sequencing... 37
RESULTS ... 38
HER2 Mutational Analysis ... 38
PIK3CA mutational analysis ... 39
Akt1 mutations ... 42
PTEN Mutations ... 43
FcγRIIa R131H polymorphism ... 47
FcγRIIIa V158 F polymorphism ... 48
Impact of all mutations and polymorphisms on the OS and PFS-I .. 52
IGF1-R Expression Analysis ... 56
DISCUSSION:... 57
CONCLUSIONS:... 66
APPENDIX A:... 67
APPENDIX B:... 70
Table of Figures and Tables
Figure 1: Location of HER2/neu gene on chromosome-17 ... 13
Figure 2: HER-2 structure consists of 3 major regions ... 13
Figure 3: HER-2 is a member of 4 EGFR family of tyrosine kinase receptor14 Figure 4: Activation of ErbB receptors... 15
Figure 5: Signal transduction by ErbB receptors... 16
Figure 6: The structure of human sHER2 and Herceptin-Fab ... 17
Figure 7: Trastuzumab binding and dimerization... 18
Figure 8: Trastuzumab action and ADCC action... 19
Figure 9: Proposed mechanisms of Trastuzumab resistance ... 22
Figure 10: Antibody dependant cytotoxic cell ADCC and involvement of Fc receptors in Trastuzumab action ... 27
Figure 11: Histogram of HER2-exon 17... 38
Figure 12: Ile625Val polymorphism and survival ... 39
Figure 13: PIK3CA/Akt1 mutations and Overall survival (OS)... 41
Figure 14: PIK3CA/AKT1 mutations and Progression free survival–I41 Figure 15: Percentage of PIK3CA mutations in each group of the patients 42 Figure 16: PTEN mutations and Overall survival ... 45
Figure 17: PIK3CA/AKT1/PTEN mutations and Overall survival .. 45
Figure 18: PIK3CA/AKT1/PTEN mutations and PFS-I ... 46
Figure 19: Genotypic distribution of H131H, H131R and R131R polymorphisms of FcγRIIa ... 47
Figure 20: Phenotypic distribution of V158V, F158V and F158F polymorphisms of FcγRIIIa ... 48
Figure 21: Pyro-sequencing and HRM results of FcγRIIIa ... 49, 50 Figure 22: FcγRIIIa and FcγRIIa polymorphisms and Overall survival 51 Figure 23: FcγRIIIa and FcγRIIa polymorphisms and Progression free survival ... 52
Figure 24: PIK3CA/AKT1/PTEN mutations and Cox-Proportional Hazard Regression of OS ... 53
Figure 25: PIK3CA/AKT1/PTEN mutations and FcγRIIIa and FcγRIIa SNPs and Overall survival ... 54 Figure 26: PIK3CA/AKT1/PTEN mutations and FcγRIIIa and FcγRIIa SNPs and Progression free survival ... 55 Figure 27: IGF1-R expression in HER-2 positive metastatic breast cancer patients ... 56 Figure 28: Potential ERBB2 targets for anticancer therapy ... 63
Table 1: Sets of Primers that are used for PCR amplification of specific genes ... 36, 37
Table 2: Mutations of exons 9 and 20 of PIK3CA gene ... 40 Table 3: Mutations of exon 4 of Akt1 gene ... 43 Table 4: PTEN gene mutations ... 44
ABSTRACT:
Breast cancer (BC) is the second most cause of death worldwide. In Italy there are approximately 40,000 new cases per year and 11,000 deaths, representing one of the major causes of morbidity and mortality cancer in females. In Tuscany it has been estimated, in 2010 approximately 4100 breast cancer cases will be diagnosed and 850 deaths. Many preclinical and clinical trials have been performed to investigate and establish effective treatments.
HER2 receptor is overexpressed in 20–30 % of BC and it has been chosen to be an effective therapeutic target. Trastuzumab (Herceptin), a humanized monoclonal antibody, has been approved by FDA to be anti-HER2 therapy, but the mechanism by which Trastuzumab exerts its antitumor activity is not fully understood. Nevertheless, Trastuzumab has been suggested to induce antibody-dependent cellular cytotoxicity (ADCC), inhibit HER2 extracellular domain cleavage, or inhibit PI3K/ AKT survival signalling, either by down-regulating HER2 signalling or by increasing PTEN membrane localization and phosphatase activity, leading to a decline in PI3K/AKT pathway activation and inhibition of proliferation. In spite of this, it is still largely unclear why almost half of the breast cancer patients overexpressing HER2 are initially do not respond to Trastuzumab based therapy even when combined with chemotherapy, or eventually become resistant to Trastuzumab during treatment. Mutational defects in HER2/PIK/AKT/PTEN signalling pathway and Fc--receptors polymorphisms have been suggested to be involved in Trastuzumab resistance. In addition, activation of HER-related receptors, such as insulin-like growth factor I receptor (IGF-R1) has been suggested in preclinical studies to increase PI3K/AKT signalling pathway, resulting in limited Trastuzumab efficacy. We proposed the involvement of PIK/AKTl/PTEN pathway and ADCC immune response in the mechanism of Trastuzumab resistance. We collected 77 samples of HER-2 positive metastatic breast cancer (MBC) patients. Mutational analysis have been performed on hot spots exons 9 and 20 of PIK3CA, exon 4 of AKT1 and exons 5, 7 and 8 of PTEN genes. Furthermore, F158V and R131H polymorphisms of FcγRIIIa and FcγRIIa genes have been performed. Our results showed a highly
significant impact of PIK3CA/AKT1/PTEN pathway gaining mutation on overall survival (OS) of the study population (P<0.0001) and a high significant relationship between PIK3CA mutations and (PFS-I) (P=0.0001). Homozygous SNPs V158V/H131H of FcγRIIIa and FcγRIIa are significantly related with better OS of our study population (P=0.0037). In conclusion, our results suggest the important role of PIK3CA gene mutation and FcγRIIIa polymorphisms in the patient’s OS, which could be used as a molecular predicting marker for the Trastuzumab resistance. Moreover, we found that IGF1-R expression is related with patient’s response to Trastuzumab (p < 0.05).
An understanding of Trastuzumab resistance mechanisms would be a helpful tool in the development of rational drug combinations to circumvent resistance and allow better selection of patients likely to respond.
OBJECTIVES:
This study aims to analyze some molecular determinants of resistance to Trastuzumab “Herceptin” such mutations in PTEN, PI3K/Akt and HER2 genes, overexpression of IGF-R1, and polymorphisms of FcγRIIIa and FcγRIIa following Trastuzumab therapy, in order to find a predictive pattern of mutations, polymorphisms and gene expression that is related with Trastuzumab resistance in HER2 positive metastatic breast cancer patients. Formalin Fixed Paraffin Embedded (FFPE) samples have been collected for 77 patients of HER2+ metastatic breast cancer (MBC) treated with Trastuzumab. Obtained results have been correlated with the clinical outcome of these patients. The gold standard will be the development of clinical assay permitting accurate diagnosis of implicated resistance mechanism in each subset of patients, which may help in the design of more efficient treatment protocols.
INTRODUCTION:
Breast cancer (BC) is the second most cause of death worldwide [1]. In Italy there are approximately 40,000 new cases per year and around 11,000 deaths, representing one of the major causes of morbidity and mortality cancer in females [2]. In Tuscany it has been estimated, in 2010 approximately 4100 breast cancer cases will be diagnosed and 850 deaths [3]. Many preclinical and clinical trials have been performed to investigate and establish effective treatments [4, 5].
In the last four decades the development of new strategies to treat breast cancer has been focused on designing of specific therapy for certain known signaling molecules that are involved in signaling pathways of cell proliferation, migration and angiogenesis. Understanding of regulation and expression mechanisms of cell signaling is very helpful in the development of specific therapies for certain targets [6]. Due to this fact, HER2 has been identified as a target in certain cancers. Her2 (erbB2/neu) gene encodes an epidermal growth factor receptor type 2 (EGFR2) (ErbB2) or HER2 a tyrosine kinase receptor, HER2/neu gene located on chromosome 17 (q21.1) (1, 21) (Figure. 1). HER2 cell surface protein has been targeted in patients with metastatic breast cancer MBC, because it is significantly overexpressed in about 20 – 30 % of invasive breast cancers [7-12]. HER2 overexpression has also been associated with aggressive tumor phenotype and reduced survival rate [13]. Moreover, inappropriate activation of HER2 has been associated with the development and severity of many cancers [14].
Figure 1: Location of HER2/neu gene on chromosome 17. (A) Normal gene’s copy number and estimated protein level of expression (B) amplified HER2/neu gene copies and estimated protein expression level in HER2 positive breast cancer.
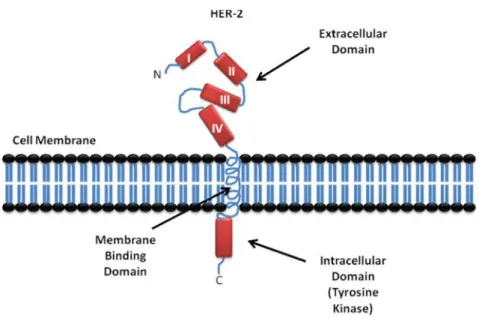
HER2 is a 185-kDa transmembrane oncoprotein (p185) (Figure. 2) [9]. Despites mouse’s 44 KD ligand, human HER2 has no known stimulatory ligand, but there is a suspicious 30 KD ligand [15].
Figure 2: HER-2 structure consists of 3 major regions, Tyrosine Kinase domain in the intracellular side, membrane binding helix domain and the extracullar region (ECD) which is consisting of 4 domains, I, II, III and IV.
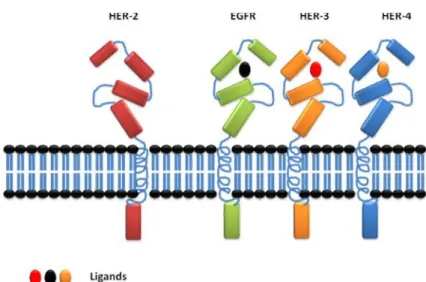
There are four known members in ErbB family of receptor tyrosine kinases (RTKs), epidermal growth factor receptor (EGFR), ErbB2 (HER2), ErbB3 (HER3), and ErbB4 (HER4). They are typical RTKs with an extracellular ligand binding region, a single membrane-spanning region, and a cytoplasmic tyrosine kinase-containing domain (Figure. 2). EGF-family peptides bind to ErbB receptors based on their receptor specificity; these ligands have been divided into three major groups. The first group includes epidermal growth factor (EGF), transforming growth factor (TGF)-a, amphiregulin (AR), and epigen (EPG), which bind specifically to EGFR; the second group includes betacellulin (BTC), heparin-binding EGF (HB-EGF), and epiregulin (EPR), which exhibit dual specificity, binding both EGFR and ErbB4; and the third group is neuregulins (NRGs), forms two subgroups on the basis of their capacity to bind ErbB3 and ErbB4 (NRG-1 and NRG-2) or only ErbB4 (NRG-3 and NRG-4) (Figure. 3) [16-18].
Figure 3: HER-2 is a member of 4 EGFR family of tyrosine kinase receptor; HER-2 has no known ligand while the other EGFRs have their specific ligands to be activated. The four members share the same main structural features.
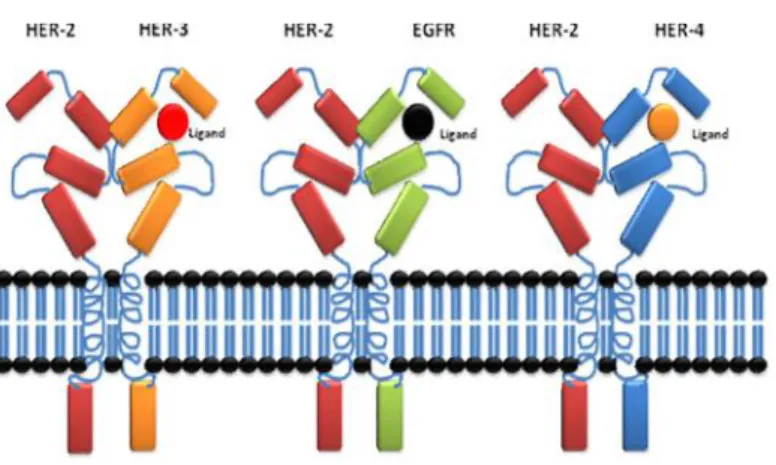
ErbB2 (HER2) is activated via heterodimerization with the other ligand-bound receptors (Figure. 4) [9, 16, 19].
Figure 4: Activation of ErbB receptors. Activation of ErbB receptors requires homodimerization or heterodimerization with HER-2, this dimerization process requires ligand binding to EGFR, ErbB3 and ErbB 4, on the other hand HER-2 does not require ligand binding to dimerize with other EGFRs.
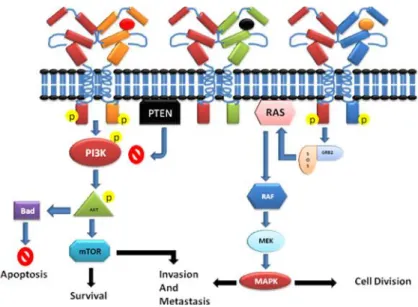
The most studied signaling pathways of HER2, involved the downstream signaling of RAS/RAF/MAPK and/or PI3K/Akt cascades (Figure. 5) [6]. Dimerization of HER2 receptor leads to cross-phosphorylation of the C-terminal, which starts activation of signaling process that involves two cascade pathways, MAPK and PI3K-Akt pathway. MAPK pathway activation leads to transcription of genes that drive cellular proliferation, migration, differentiation and angiogenesis. On the other hand, PI3K-Akt pathway activation leads to cell survival and anti-apoptosis signaling [20].
Figure 5: Signal transduction by ErbB receptors. Activation of ErbB receptors by dimerization induces signal transduction through two major pathways; PIK3CA activation leads to further activation of downstream signaling involved in cell survival, invasion, and metastasis and anti-apoptotic mechanism. An alternative pathway involves activation of MAPK through RAS signaling, which leads to cell division and Invasion.
The first line strategy against HER2 overexpressing tumors has been the production of monoclonal antibodies (mAbs) targeting the extracullar domain. Trastuzumab (Herceptin) a humanized monoclonal antibody has been approved by FDA for the treatment of HER2 overexpressing breast cancer in adjuvant and metastatic setting [7, 21, 22]. Unfortunately, a significant number of HER2 overexpressing breast cancer patients have been reported to develop resistance against Trastuzumab or they may have initial resistance for Trastuzumab therapy [6, 23].
Currently, the optimal duration of Herceptin treatment is unknown. In most patients who initially respond to Herceptin, disease progression begins again within a year. A clearer understanding of the mechanisms that contribute to Herceptin resistance is needed to increase the magnitude and duration of response [13]. Despites the discovery of Domain IV as a Trastuzumab binding site (Figure. 6) [24-26], the exact mechanism of Herceptin action is not fully understood.
Figure 6: The structure of human sHER2 and Herceptin-Fab. Ribbon diagram of the human sHER2 and Herceptin Fab complex showing binding site on domain IV [26].
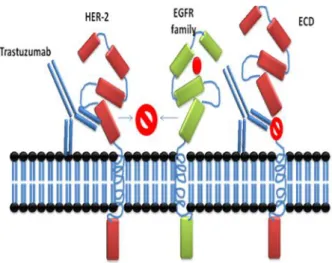
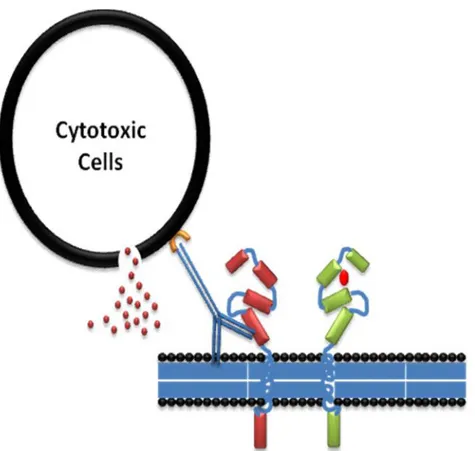
Nevertheless, different mechanisms of Herceptin action have been proposed: Such as internalization and degradation of HER-2, disruption of receptors dimerization, disruption of downstream signaling pathways (Figure. 7), G1 arrest and reduction of proliferation, induction of p27kip1-cdk2 complex formation and apoptosis, inhibition of Akt activity and suppression of angiogenesis because it has been noticed that there is a reduction of tumor vasculature in vivo and reduction of expression of pro-angiogenic VEGF, TGF-a, Ang-1, PAI-1, induction of anti-angiogenic TSP-1, ADCC immune-mediated responses through stimulation of natural killer cells (Figure. 8), inhibition of HER-2 ECD proteolysis and inhibition of DNA repair [13].
Figure 7: Trastuzumab binding and dimerization. Trastuzumab binding is proposed to inhibit the cleavage of HER-2 and prevents dimerization with other EGFR receptors; it has been proposed that the expression of truncated HER-2 (p95) mimics the binding site of Trastuzumab antibody. Proteolytic inhibition by Trastuzumab has been proposed as a mechanism of anti-tumor action.
Figure 8: Trastuzumab action and ADCC action. Trastuzumab action could involve activation of ADCC immune response, two mechanisms could be involved in Trastuzumab action, ADCC and releasing of interferons from cytotoxic cells to kill tumor cells, on the other hand prevention of dimerization has also been proposed.
Since the pharmacokinetics of Trastuzumab is not fully understood, many mechanisms of Trastuzumab resistance have been proposed [6, 27-29].
Preclinical studies have proposed some mechanisms of Trastuzumab resistance
I. Obstacles for Trastuzumab binding to HER2, altered receptor– antibody interaction or steric-hindrance of receptor-antibody interaction
II. Up-regulation of HER2 downstream signaling pathways.
III. Signaling through alternate pathways and compensatory signaling from other HER receptors
IV. Failure to trigger immune-mediated mechanisms to destroy tumor cells.
I. Obstacles for Trastuzumab binding to HER2:
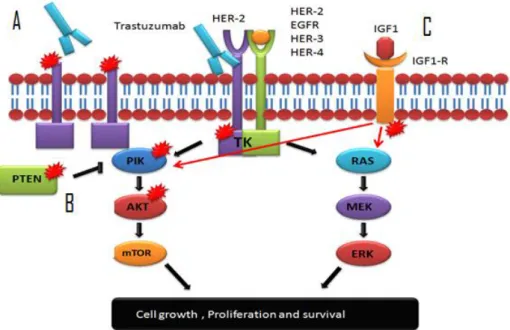
A constitutively active, truncated form of HER2 receptor, p95HER2, has kinase activity but lacks the extracellular domain and the binding site of Trastuzumab (Figure. 9). In-vitro data have suggested Trastuzumab could block p185HER2 cleavage and consequent production of constitutively active p95HER2, a truncated form of complete HER2 receptor [30]. A retrospective study has revealed a strong association between the presence of p95HER2 and clinical resistance to Trastuzumab treatment [31]. In that study, sensitivity to Trastuzumab has been evaluated according to p95HER2 expression measured by immunofluorescence in 46 patients with metastatic breast cancer. Only 1 out of 9 patients (11.1%) expressing p95HER2 responded to Trastuzumab, whereas 19 of the 37 patients (51.4%) with tumors expressing p185HER2 achieved clinical response.
Three models have been suggested to explain p95HER2 production: Protease-mediated generation of p95HER2 [32-34], alternative initiation of translation [35], and alternative mRNA splicing [36-38].
Specific proteases have been found to be involved in HER2 shedding. HER2 shedding has been attributed to various zinc-containing metalloproteases including members of the ADAM (A Disintegrin and Metalloproteases) and MMP (Matrix Metallo Proteases) families [39].
Figure 9: Proposed mechanisms of Trastuzumab resistance: A) Truncated HER-2 oncoprotein prevents Trastuzumab binding, B) Mutations in the PIK/AKT signalling pathway interferes with the action of Trastuzumab, C) Activation of alternative pathway of IGF1-R playing a role in Trastuzumab resistance
Alternative splicing may also produce HER2 ECD. At least two distinct truncated HER2 ECD proteins are encoded by alternative splicing of the HER2 transcript. A 2.3 kb mRNA variant encodes an intracellular 100 kDa protein (stay inside the cell) which is composed of the first 633 amino acids and contains almost the entire HER2 ECD (ECD sub-domains I–IV) [40].
Another HER2 mRNA splicing variant has been identified to encode a soluble truncated 68 kDa sHER2 (also called Herstatin) that includes the first 340 amino acids of HER2 with two ECD sub-domains (I and II) and ends with a unique carboxyl tail sequence at the place of the ECD sub-domain III [41].
Most studies have suggested elevated sHER2 is associated with worse outcome of breast cancer, and it has become clear that HER2 expression in breast
cancer alone does not adequately predict response to HER2-targeted therapy [42]. The recently developed assay to measure sHER2 has been suggested to be used in combination with IHC or FISH to optimize the identification of patients with HER2 over-expression or amplification [40].
Epitope masking has also been investigated as a mechanism of resistance to Trastuzumab. Mucin 4 (MUC4) is large, highly O-glycosylated membrane-associated glycoprotein [43], which may interfere with Trastuzumab binding to HER2. In a preclinical model using the human HER2 positive, JIMT-1 cell line showed resistance to Trastuzumab, it has been observed that MUC4 was associated with Trastuzumab epitope masking and decreased antibody-binding capacity [44]. In that model, JIMT-1 resistance to Trastuzumab could be reversed by MUC4 knockdown. Moreover, CD44 and hyaluronan may also hinder the access of Trastuzumab to HER2 receptor by masking its cognate epitope, and lead to treatment resistance. It has been shown that treating JIMT-1 cells with an inhibitor of the hyaluronan synthesis significantly reduces the hyaluronan levels leading to increased binding of Trastuzumab to HER2 and its subsequent anti-tumoral effects [45].
II. Upregulation of HER2 downstream signaling pathways:
Loss of PTEN function caused by mutation of PTEN itself, or by transcriptional regulation, has been described in several tumors and in up to 50% of breast cancers [46]. PTEN normally inhibits the activation of PI3K. Therefore PTEN loss results in the constitutive upregulation of PI3K/Akt (Figure. 9) [47]. HER2-overexpressing metastatic breast cancer patients with deficient PTEN had significantly poorer responses to Trastuzumab-based therapy than those with tumors expressing normal PTEN [48, 49].
Phosphatase and tensin homolog (PTEN) has been suggested as a key modulator of Trastuzumab sensitivity in HER2-overexpressing breast cancer because PTEN opposes the downstream signaling of phosphoinositide 3-kinase (PI3K) (Figure. 4). PTEN activation has been found to contribute to Trastuzumab antitumor
activity. For instance, Trastuzumab treatment quickly increases PTEN membrane localization and phosphatase activity by reducing PTEN tyrosine phosphorylation via Src inhibition. Moreover, reducing PTEN in breast cancer cells by antisense oligonucleotides conferred Trastuzumab resistance in vitro and in vivo. Moreover, patients with PTEN-deficient breast cancers have shown shorter survival time than the normal PTEN patients [50, 51].
Phosphatidylinositol 3-kinases (PI3Ks) are a group of lipid kinases that regulate signaling pathways involved in cell proliferation, adhesion, survival and motility. The PI3K pathway is considered to play an important role in tumorigenesis. Activating mutations of the p110α subunit of PI3K (PIK3CA) have been identified in a broad spectrum of tumors. Analyses of PIK3CA mutations reveals that they increase the PI3K signal, stimulate downstream Akt signaling, promote growth factor-independent growth and increase cell invasion and metastasis [52].
A large-scale RNA interference screening to discover genes involved in Trastuzumab resistance in breast cancer identified only PTEN as a modulator of drug sensitivity. Furthermore, oncogenic mutants of PIK3CA have also conferred resistance to Trastuzumab in cell culture. In a cohort of 55 breast cancer patients, activation of the PI3K pathway, as judged by the presence of oncogenic PIK3CA mutations or low PTEN expression, has been associated with poor prognosis after Trastuzumab therapy. Combined analysis of PTEN and PIK3CA identified twice as many patients at increased risk for progression compared to PTEN alone [53].
Furthermore, Trastuzumab and Lapatinib have been evaluated in a panel of 18 HER2-amplified cell lines, using both two- and three-dimensional culture. Increased phosphorylation of HER2, epidermal growth factor receptor (EGFR), HER3, and insulin-like growth factor IR have been correlated with response to Lapatinib but not Trastuzumab. Loss of PTEN or the presence of activating mutations in PI3K marked resistance to Trastuzumab, but Lapatinib response was independent of these factors. Concluding, increased activation of the PI3K/AKT pathway correlated with resistance to Trastuzumab, which can be overcome by Lapatinib [54].
PI3K mutations have also been implicated in Trastuzumab resistance through PI3K/Akt pathway activation. PIK3R1 gene encodes the PI3K regulatory subunit p85α; PIK3R1 mutations affect p85 function and induce constitutive activation of the PI3K/Akt pathway [55, 56]. In addition, PIK3CA encodes the catalytic subunit of p100α of PI3K, is also frequently mutated or overexpressed in human cancer [57]. Berns and colleagues have described a significantly improved ability to detect patients with low response to Trastuzumab in a cohort of 55 patients with breast cancer when combining the analysis of low PTEN expression and the presence of oncogenic PIK3CA mutations [53]. Another study has described PIK3CA mutations occur more frequently in elder patients for HER2-positive breast cancer, and suggested PI3K pathway activation resulting from PTEN loss or PIK3CA mutations may lead to drug resistance to Lapatinib and Trastuzumab [58].
Moreover, patients with PIK3CA mutations or increased PI3K pathway activity had a significantly poorer survival despite adequate treatment with adjuvant chemotherapy and Trastuzumab [59]. Microarray analysis has shown the downregulation of PKA-RIIα regulatory subunit, conferred partial Trastuzumab resistance in Her2-positive BT474 and SK-Br-3 cell lines. Forskolin activation of PKA also produced significant protection against Trastuzumab-mediated Akt de-phosphorylation [60].
III. Signaling through multiple alternate pathways:
Signaling through alternative pathways has been linked to Trastuzumab resistance in various preclinical models. Clinical information confirming the importance of most of the identified pathways is needed. For instance, Insulin-like growth factor-I receptor, IGF-1R, another transmembrane TK receptor which stimulates cell proliferation has been found to interact with HER2 in Trastuzumab-resistant cell lines, inducing its phosphorylation (Figure. 9). In those preclinical models, anti-IGF-IR drugs have restored sensitivity to Trastuzumab-resistant cell lines [61]. IGF1R levels have been significantly increased in the
Trastuzumab-resistant model, SKBR3/Tr, compared to the parental SKBR3 cell line. In both, SKBR3/Tr and BT474/Tr cell lines, inhibition of IGF1R expression by siRNA or inhibition of tyrosine kinase activity by NVP-AEW541 significantly increased response to Trastuzumab. The dual targeting approach also improved response in the parental SKBR3 cells but not in the BT474 parental cells [62].
Moreover, Trastuzumab has inhibited the growth of MCF-7/HER2-18 cells, a HER2/neu and IGF-I receptors (IGF-IRs) overexpressing cells, only when IGF-IR signaling was minimized by reducing fetal bovine serum (F-BSA). In SKBR3 cells, a HER2/neu receptor overexpressing cells with few IGF-IRs, Trastuzumab reduced proliferation by 42% regardless of IGF-I concentration. Furthermore, Trastuzumab effect has been reverted in SKBR3 cells when IGFIRs overexpressed and cultured with IGF-I [63].
C-Met receptor is frequently co-expressed with HER2 in some cancer cell lines, and it has been suggested to contribute to Trastuzumab resistance through sustained Akt activation. HER2-overexpressing breast cancer cells respond to Trastuzumab with a rapid upregulation of c-Met receptor expression, and c-Met activation protects cells against Trastuzumab while the loss of c-Met function produced through RNA interference improves the response of these cell lines to Trastuzumab [64]. Moreover, it has been suggested that Met activation protects cells against Trastuzumab by abrogating p27 induction [64].
Moreover, the role of Met receptor in TKI resistance has also been described in NSCLC, Gefitinib-resistant NSCLC cell lines display MET gene amplification and Met receptor appears to couple to the PI3K pathway via ErbB3[65].
IV. Failure to trigger immune-mediated mechanisms to destroy tumor cells:
Antibody-Dependant Cell-Mediated Cytotoxicity ADCC immune response has been suggested to be involved in Trastuzumab action (Figure. 8). Trastuzumab has been found to be involved in induction of ADCC response in HER-2-amplified HCC1954 and SKBR3 cell lines, and in all five of the non-amplified cell lines, which
had low levels of detectable HER-2 (CAL-51, CAMA-1, MCF-7, T47D, and EFM19). On the other hand, Trastuzumab did not induce ADCC in the K562 control cell line or MDA-MB-468, which have very low levels of HER-2.
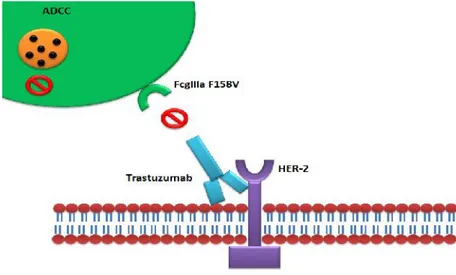
Fcγ receptors have different affinity to antibody types, which suggests their role in Trastuzumab efficacy. Genomic polymorphism that produces Valine (V) or Phenylalanine (F) phenotypes at position 158 of FcγRIIIa has been suggested to influence Trastuzumab affinity to the Fcγ receptor (Figure. 10) [66]. Immune effector cells carrying the FcγRIIIa V/V alleles mediate ADCC of Trastuzumab better than cells bearing the F allele [67]. In the clinic, FcγRIIIa 158V/F polymorphism significantly impairs clinical response rates and progression-free survival (PFS) of patients treated with Trastuzumab in the metastatic setting [68]. Moreover, Fifty-four consecutive patients with HER-2/neu–amplified breast cancer receiving Trastuzumab plus Taxane for metastatic disease have been evaluated for FcγRIIIa-158 Valine/Phenylalanine (V/F), FcγRIIa-131 Histidine/Arginine (H/R), and FcγRIIb-232 Isoleucine/Threonine (I/T) polymorphisms. Strong impact of FcγRIIIa-158 on anticancer treatment has been proposed [69, 70].
Figure 10: Antibody dependant cytotoxic cell ADCC and involvement of Fc receptors in Trastuzumab action. Under the presence of low affinity Fc receptors to Trastuzumab, the efficacy of Trastuzumab is proposed to be reduced in this group of HER2+ MBC patients.
On the other hand, FcγRIIIa and FcγRIIa genotyping has been performed for 1,286 of non-metastatic HER2 positive patients who are enrolled in a trial of adjuvant Trastuzumab-based chemotherapy. No correlation has been found between (Disease Free Survival) DFS and FcγRIIIa/FcγRIIa polymorphisms in Trastuzumab-treated patients [71].
Other proposed mechanisms for Trastuzumab resistance:
Recently, other mechanisms of Trastuzumab resistance have been proposed to reduce the efficacy. Cell cycle controlling proteins and mRNA have been described in some recent works to be involved in Trastuzumab action.
i. Cyclin E
Cyclin E overexpression has been related with Trastuzumab resistance in both
in vivo and in vitro. In a cohort study of 34 HER2+ patients treated with
Trastuzumab-based therapy, cyclin E amplification/overexpression has been associated to worse clinical benefit (33.3% compared with 87.5%, P < 0.02) and lower progression-free survival (6 mo vs. 14 mo, P < 0.002) compared to cyclin E non-overexpressing tumors. Moreover, inhibition of cyclin E activity in cyclin E-amplified Trastuzumab resistant clones, either by knockdown of cyclin E expression or treatment with cyclin-dependent kinase 2 (CDK2) inhibitors, led to a dramatic decrease in proliferation and enhanced apoptosis. Suggesting treatment with CDK2 inhibitors may be a valid strategy in patients with breast tumors with HER2 and cyclin E co-amplification/overexpression [72].
ii. miRNA
miR-21 expression and function has been upregulated and elevated in HER2 BT474, SKBR3, and MDA-MB-453 breast cancer cells that are induced to acquire Trastuzumab resistance by long-term exposure to the antibody, whereas protein expression of the PTEN gene, a 21 target, has been reduced. Blocking of
miR-21 action re-sensitized the resistant cells to the therapeutic activities of Trastuzumab. Moreover, ectopic expression of miR-21 in HER2 breast cancer cells confers resistance to Trastuzumab. In vivo, administering miR-21 antisense oligonucleotides restored Trastuzumab sensitivity in the resistant breast cancer xenografts by inducing PTEN expression, whereas injection of miR-21 mimics conferred Trastuzumab resistant in the sensitive breast tumors via PTEN silence. Up-regulation of miR-21 in tumor biopsies obtained from patients receiving pre-operative Trastuzumab therapy has been associated to poor Trastuzumab response [73].
In another study, micro-RNA profiling analysis has been conducted to screen micro-RNAs that were up- or down-regulated in HER2-positive cells lines only. miR-26a and miR-30b have been identified as a Trastuzumab-inducible micro-RNAs. Transfecting miR-26a and miR-30b induced cell growth suppression in the BC cells. Using the prediction algorithms for micro-RNA targets, cyclin E2 (CCNE2) has been identified as a target gene of miR-30b [74].
iii. IFNs
It has been reported that anti–ErbB-2 mAb therapy is dependent on the release of IFN-I and II but is independent of perforin or FasL, excluding the importance of the classical antibody-dependent lymphocyte-mediated cellular cytotoxicity. It has been demonstrated that anti–ErbB-2 mAb therapy of experimental tumors derived from MMTV-ErbB- 2 transgenic mice triggers MyD88-dependent signaling and primes IFN-γ–producing CD8+ T-cells and independent of IL-1R or IL-17Ra signaling. Moreover, it has been demonstrated that anti–PD-1 or anti-CD137 mAb significantly improve the therapeutic activity of anti–ErbB-2 mAb in immunocompetent mice [75].
Most of Trastuzumab resistance mechanisms have been identified in preclinical models and have not yet been validated in clinical samples. One important goal of this study is to determine which mechanism/s is/are clinically relevant to Trastuzumab resistance in HER2+ metastatic breast cancer patients.
Herceptin (Trastuzumab) Side Effects;
In spite of the therapeutic benefits of Trastuzumab (Trz), cardiotoxic side effects are still an issue. This effect is potentiated particularly when Trz is administered following Doxorubicin (DOX) treatment. Among the various mechanisms that may account for DOX and Trz-induced cardiotoxicity, the role of oxidative stress has gained significant support. The adjuvant use of Trz can potentiate cardiomyocyte damage through a ‘dual-hit’ mechanism, which includes inhibition of the neuregulin-1 survival signaling pathway and angiotensin II-induced activation of NADPH oxidase, with the ability to further increase reactive oxygen species production (ROS). Preventive therapies for DOX- and Trz-induced cardiac dysfunction have eluded investigators, but may include the prophylactic use of angiotensin-converting enzyme inhibitors, beta-blockers and use of antioxidants. Thus, a better understanding of the mechanisms leading to this characteristic drug-induced cardiomyopathy, as well as potential cardio-protective strategies is required [76].
The most common adverse reactions are fever, nausea, vomiting, diarrhea, infections, cough, headache, fatigue, dyspnea, rash, neutropenia, anemia, and myalgia. Serious infusion reactions (angioedema, anaphylaxis) and pulmonary toxicity (pneumonitis, acute respiratory distress syndrome) have also been reported within 24 hours of administration [77, 78].
Economic and Clinical Issues
The average wholesale price for Trastuzumab is $2930 for 440 mg. For 70 kg, each 2 mg/kg dose would cost approximately $1000, and a yearly regimen would cost $50,000. About 5–10 women per 100,000 population have metastatic breast cancer, between 90 and 100 per 100,000 have localized breast cancer, and around 40 per 100,000 have regional breast cancer [79].
Thus, with a US female population of 143,000,000 approximately 7,000– 14,000 women have metastatic breast cancer, 130,000– 140,000 have localized breast cancer, and 60,000 have regional breast cancer. If Trastuzumab is to be a standard part of the adjuvant regimen for HER2-positive patients, the cost of treating this population could increase by almost $1 billion for Trastuzumab alone. There would also be additional cost for treating heart failure associated with administration of the medication [23].
Materials and Methods:
Specimen collection: 77 formalin fixed paraffin embedded (FFPE) tumor samples have been collected from HER2+ patients treated with Trastuzumab for metastatic breast cancer (MBC) disease since 2003 at the Pathology and Medical Oncology Department of the Az-USL5 of Pisa and the Hospital-University of Pisa (Appendix A). HER2 scoring has been evaluated according to the standard protocols at the Pathology and Medical Oncology Department. All patients have been diagnosed as 3 + by IHC assay, moreover, 2 + patients have been confirmed by FISH assay to be HER2 +. The average age at diagnosis of our study group is 55 years, 45 % of the patients are less than 55 years old. Patients have been classified clinically into four major groups according to their response to Trastuzumab. CR: complete response, PR: partial response, SD: stable disease and PD: progressive disease.
DNA extraction and evaluation: DNA and RNA extraction from FFPE tissues has been performed on 3 to 4 sections of 10 m thickness. Each paraffin block has been sectioned under sterile conditions. De-waxing has been performed by adding 1 mL of Xylene, incubated for 5 min at 40 o C, centrifuged at maximum speed, de-waxing has been repeated 3 times. Xylene cleaning has been performed by adding 1 mL absolute ethanol, centrifuged at maximum speed; ethanol washing has been repeated 3 times. All samples have been subjected to air dry for 30-60 minutes under the chemical hood.
DNA Extraction: To extract DNA from dried sections we used an automated system (Helix Extraction System, Diatech) and a commercial kit (Helix DNA Plus, Diatech) according the manufacturer’s instructions.
Manual DNA extraction has been performed by using commercial kit from Qiagen (QIAamp DNA FFPE Tissue Kit). Briefly, 180 µl Buffer ATL has been added to dried pellet, followed by adding 20 µl of proteinase K, mixed and incubated overnight at 56oC. 200 µl AL Buffer added to the sample, and mixed thoroughly by vortex, Then 200 µl of ethanol (96–100%) have been added, and mixed again
thoroughly by vortex. 1.5 ml tube centrifuged to remove drops from the inside of the lid. Carefully the entire lysates have been transferred into the QIAamp MinElute column (in a 2 ml collection tube), and centrifuged at 6000 x g (8000 rpm) for 1 min. QIAamp MinElute column has been placed in a clean 2 ml collection tube, collection tube containing the flow-through has been discarded. 500 µl of Buffer AW1 added to QIAamp MinElute column, centrifuged at 6000 x g (8000 rpm) for 1 min, then the collection tube containing the flow-through discarded. 500 µl of Buffer AW2 has been added and centrifuge at 6000 x g (8000 rpm) for 1 min, then collection tube containing the flow-through has been discarded. Centrifugation at full speed (20,000 x g; 14,000 rpm) has been performed for 2 min to dry the membrane completely. QIAamp MinElute column was placed in a clean 1.5 ml micro-centrifuge tube and 50 µl Buffer ATE has been added to the center of the membrane and incubated at room temperature (15–25°C) for 1 min, followed by centrifugation at full speed (20,000 x g; 14,000 rpm) for 1 min. The quantity/quality of extracted DNA has been estimated by Nanodrop 1000 spectrophotometer by using 1 μl of undiluted DNA solution.
RNA Extraction: RNA have been extracted by using (Helix Extraction System, Diatech) and commercial kit (Helix RNA Plus, Diatech) according the manufacturer’s instructions.
cDNA synthesis: By using (Thermo Scientific RevertAid First Strand cDNA Synthesis Kit, #K1621), 0.5-1µg of RNA have been added into sterile nuclease-free tube on ice, 1µl random hexamer primers has been added and completed to total volume 12µl by adding nuclease-free water, then incubated at 65o C for 5 min. Following reagents have been added as the indicated order: 4µl of 5x reaction buffer, 1 µl of RiboLock 10 RNase inhibitor (20u/ µl), 2 µl of mM dNTP mix, 1 µl of Revert AID M-MuLV reverse transcriptase (200u/ µl) to reach 20 uL total volume, mixed gently and centrifuged, then incubated for 5 min at 25oC, followed by 60 minutes at 42oC, the reaction terminated by heating at 70oC for 5 minutes. The synthesized cDNA used immediately or stored at -20oC for less than a week. For longer storage cDNA samples have been stored at -80oC.
Primers and PCR: All primers have been designed by using Primer3 software and verified by BLAST on Pubmed database for mismatching. PCR reactions for all target sequences has been performed under the following conditions: in 30 µl reaction volume containing 75 mM Tris–HCl, 1.5 mM MgCl2, 50 mM KCl, 20 mM (NH4)2SO4, 0.2 mM of each primer and 1 U of Taq DNA polymerase. PCRs have been done under the following cycling conditions: an initial 7 min of denaturation at 95 Co followed by 45 cycles for 45 sec each at 94 Co, appropriate annealing temp (Table. 1), extension at 72 Co for 1 min and a single final extension step for 10 min at 72 Co.
PCR Reaction cleanup: PCR reaction cleanup has been performed by using Montage PCR filter system (MultiScreen PCR96 Filter Plate) from Millipore. PCR amplified products have been mixed with pure water (30 ul of PCR reaction + 80 uL of pure water) and loaded to 96 wells plate, vacuum aspiration has been applied for 5-10 minutes until wells are dry, washing with pure water has been applied for 3 times (100), final step was performed by adding 40 uL of pure water and agitated for 10 min at 40 rpm and transferred to new clean tubes, purified PCR product used immediately for sequencing reaction or stored at 4oC.
DNA sequencing: Direct DNA sequencing has been performed by using Big Dye Terminator (Ver. 3.1) kit (Applied Biosystems, USA) according to the manufacturer’s instructions. To prepare the reaction mixtures, 4 uL of Terminator Ready Reaction Mix has been mixed with 2 uL Big Dye Sequencing Buffer and 4-6 uL of purified PCR product, 3.2 pmol of primers, up to 20 uL of de-ionized water, mixed and spin. Cycling PCR has been performed under the following conditions (30 cycles for 10 sec at 95oC, 5 sec at 50oC and 3 min at 72oC).
Sequencing Reaction Cleanup: Sequencing reaction cleanup has been performed by using Montage and MultiScreen Sequencing Reaction Cleanup system (Montage SEQ96 Sequencing Reaction Cleanup Kit). PCR Sequencing reaction have been mixed with pure water (20 ul of PCR reaction + 80 uL of pure water) and loaded to 96 wells plate, vacuum aspiration has been applied for 5-10 minutes until
wells are dry, washing with pure water has been applied for 3 times (100), final step was performed by adding 25 uL of pure water and agitated for 10 min at 40 rpm and transferred to new clean tubes and stored at 4oC until applied for sequencing.
Sequencing has been performed by ABI Prism Genetic Analyzer system 3130xl (Applied Biosystems, USA). 8 uL of cleaned sequence reaction product has been mixed with 8 uL of formaldehyde, mixed, denatured at 95o C for 5 min and applied for direct sequencing.
Mutational analyses on HER-2, PTEN, PIK3CA and AKT1 genes;
Polymorphism of FcγRIIa: The mutational analysis of HER-2 (exons 17-21),
PTEN (exons 5, 7 and 8), PIK3CA (exons 9 and 20) and Akt1 (exon 4) genes and FcγRIIa polymorphisms have been performed on DNA by PCR amplification followed by cycling PCR. Cycling PCR product cleaned by Millipore cleaning 96 wells plate according to the manufacturer’s instructions, then sequenced by ABI PRISM 3130XL Genetic Analyzer (Applied Biosystems, USA).
Gene Exon Primer Annealing Co Size (bp) HER-2 17 5’-CTAGCCCTCAATCCCTGACC-3’ 5’-GGCTGGGAGGACTTCACC-3’ 58 203 18 F-5’-GAGGCGGGGTGAAGTCCT-3’ R-5’GGCCCTGACCTTGTAGACTG-3’ 58 210 19 F-5’-CCCACGCTCTTCTCACTCAT-3’ R-5’-AGAGACCAGAGCCCAGACCT-3’ 58 212 20 F-5’-CTCTCAGCGTACCCTTGTCC-3’ R-5’-AGGTGCATACCTTGGCAATC-3’ 58 220 21 F-5’-GACTCTTGCTGGGCATGTG-3’ R-5’-TTCTCCCATGGGCTAGACAC-3’ 58 287 PIK3CA 9
F-5’- CTG TGA ATC CAG AGG GGA AA-3’ R-5’- CCA CAA ATA TCA ATT TAC AAC CAT TG -3’ 58 450 20 F-5’-GCTGAGGTGACCCTTGTCTC-3’ R-5’-ACAGCTTGCAAGGACTCTGG-3’ 58 421 Akt1 4 F-5’-GGTAGAGTGTGCGTGGCTCT-3’ R-5’-CAAATCTGAATCCCGAGAGG-3’ 58 205 PTEN 5 F-5’-TTCTGAGGTTATCTTTTTACCACA-3’ R-5’-TAGGGCCTCTTGTGCCTTTA-3’ 58 308 7 F-5’-AAAATCGTTTTTGACAGTTTGACA-3’ R-5’-TTCATTGGGAGAAATATCCAAAA-3’ 58 278 8 F-5’-TGTTTAACATAGGTGACAGATTTTCT-3’ R-5’-TGGCTTTGTCTTTATTTGCTTT-3’ 57 420 9 F-5’-CAGTAGAGGAGCCGTCAAAT-3’ R-5’-CTGGATCAGAGTCAGTGGTG-3’ 58 437 FcγRIIIa 158 Sequence to analyze: A/CAAGCCCCCTGCAGAAGTAGGAGCCG F-5’- GTTCAAGGAGGAAGACCCTATTCA-3’ R- 5’- AGTGATGGTGATGTTCACAGTCTC-3’ S – 5’- ACACATTTTTACTCCCAA – 3’ 58 16 FcγRIIa 131 F-5’- AAGGACAAGCCTCTGGTCAA-3’ R- 5’-TCTTGGCAGACTCCCCATAC-3’ 58 201
Table 1. Sets of Primers that are used for PCR amplification of specific genes, each set is combined with specific annealing temperature and expected product size.
qPCR : GoTaq® qPCR Master Mix kit from Promega has been used to perform qPCR. Total volume of 25 uL contained 12.5 master mix, 0.2 uM of primers, upto100 ng DNA template and nuclease free water. qPCR setting was: hot-start activation at 95°C for 2 minutes, 40 X of denaturation at 95°C for 15 seconds annealing/extension 60°C for 60 seconds and final step of dissociation at 95°C. qPCR and HRM have been carried out by using (Rotor-Gene Q, QIAGEN).
Pyro-sequencing: PyroMark Q96 ID has been used to analyse FcγRIIIa polymorphisms, while the primers for this analysis have been designed by PyroMark Assay Design SW 2.0.
Data analysis: Statistical analyses have been carried out by specific computer program (GraphPad /Prism 4). All tumour samples have been provided with detailed clinical data which allowed us to perform an association study between genes mutations and patients’ survival and treatment responses by using statistical analysis such as Pearson χ2 test or two-tailed t-test and Kaplan Meier survival analyses.
IGF1R cDN A
F-5’- CTC CTG TTT CTC TCC GCC G -3’
Results:
HER2 Mutational Analysis:
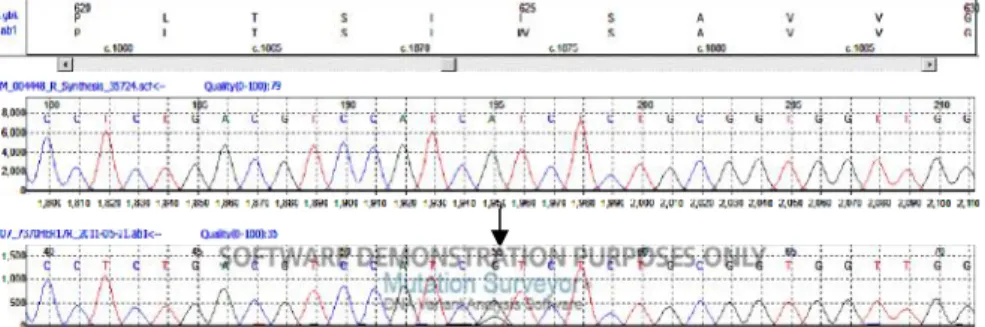
77 samples have been subjected to DNA sequencing of the hot spots of exons 17, 18, 19, 20 and 21 of HER2 gene. None of the analyzed samples showed any mutation on the screened exons 17, 18, 19, 20 and 21. Interestingly, exon 17 of HER-2 gene showed a polymorphism Ile6HER-25Val (Ile6HER-25Val) (Figure. 11), which is not related with the overall survival OS or progression free survival PFS-I of the patients (Figure. 12).
Figure 11: Histogram of HER2-exon 17. Ile625Val (Ile655Val) polymorphism shows change in the codon sequence from ATC to GTC. Upper histogram represents wild type codon and polymorphic codon in the lower histogram sequence.
Figure 12: Ile625Val polymorphism and survival. Kaplan Meier curve represents Ile625Val polymorphism on exon 17 of HER-2/neu gene do not show any significance with patients survival (Blue line 1: Ile655Ile) (Red line2: Ile625Val).
PIK3CA mutational analysis:
We performed DNA sequencing of our 77 samples by using ABI Prism Genetic Analyzer system 3130xl; our results showed PIK3CA is frequently mutated in HER-2 positive metastatic breast cancer patients. Screening of hot spot exons 9 and 20 of PIK3CA gene revealed various point mutations (Table. 2). Sixteen samples have shown mutations in PIK3CA gene representing 21 % of our study group. Seven mutations have been found on exon 9, while nine mutations have been located on exon 20, representing 9 % and 12 % of PIK3CA mutations in the whole study population and 44% and 56% of total PIK3CA mutations, respectively. We reported E545K as the most frequent point mutation in our study population; five samples showed E545K mutations representing 7 % of the whole study population and 31% of total PIK3CA mutations. None of the patients has dual mutations in both exons and all mutations have been reported previously (Appendix A and B).
RESPONSE PIK9 PIK20 PD WT W1057X PD H554R WT PD WT D1018N RC POST-CH WT H1047R RM E542K WT RP WT H1047R RP WT H1047L RP E542K WT RP E545K WT RP N515S WT RP WT M1010I RP WT D1056N SD WT H1047R SD E545K WT SD WT M1004I NA E545K Wt
Table 2. Mutations of exons 9 and 20 of PIK3CA gene, 7 mutations were found on exon 9 while exon 20 showed 9 mutations, detailed sequences of these mutations are in the Appendix. PD: progressive disease, RP: partial response, SD: stable disease, RM: medium response, RC: complete response.
STATGRAPHIC software has been used to perform survival analysis of our study. Kaplan-Meier survival analysis have shown a highly significant reduction in patients overall survival (OS) by gaining PIK3CA mutation (P < 0.0001) (Figure. 13). Moreover, progression free survival (PFS-I) has also been significantly reduced by gaining PIK3CA mutations (P = 0.0001) (Figure. 14). In conclusion, gaining PIK3CA mutations have shown a negative impact on the survival of HER-2 positive metastatic breast cancer patients who are treated with Trastuzumab.
Figure 13: PIK3CA/Akt1 mutations and Overall survival (OS). Kaplan Meier curve shows Overall survival (OS) is significantly reduced by the presence of PIK3CA/AKT1 mutations, P < 0.0001 (--- PIK3CA/Akt1 mutated patients) ( Wt patients).
Figure 14: PIK3CA/AKT1 mutations and Progression free survival –I. Kaplan Meier curve shows Progression free survival -I (PFS-I) is significantly reduced in the presence of PIK3CA/AKT1 mutations, P = 0.0001 (--- PIK3CA/Akt1 mutated patients) ( Wt patients).
Moreover, one of our major aims is to establish a relationship between gaining PIK3CA mutations and Trastuzumab response, in order to use this information to predict patient’s response before starting treatment. In our study, PIK3CA mutations have shown a difference between the progressive group (PD) and the other groups (RP: partial response, SD: stable disease, RC: complete response) of drug response. Our study group has only 7 patients with (PD) but contains the highest percentage of PIK3CA mutations (43 %). On the other hand, the complete response (RC) group has the lowest percentage of PIK3CA mutations (8 %) (Figure. 15).
Figure15: Percentage of PIK3CA mutations in each group of the patients. PD: progressive disease group showed the highest percentage of PIK3CA mutations. PD: progressive disease, RP: partial response, SD: stable disease, RC: complete response.
Akt1 mutations:
Akt1 has shown a very low incidence of mutations on exon 4 in our patients. We reported 2 mutations in 77 patients, representing 2.6 % of the study population. Up to our information; these mutations have not been reported previously (Table. 3). Furthermore, we reported 5 silent mutations on exon 4 of Akt1 gene (Table. 3). Due two low mutation numbers in this gene it is not possible to build Kaplan-Meier curve
for survival analysis, so they have been included in the PIK3CA mutations analysis; totally, PIK3CA and AKT1 mutations have the same impact on the patient’s survival (Appendix A). RESPONSE Akt1 NV L28F,T34T PD Y38Y RC 15522C/T RC V57V RC L28L,V45V RP T34T SD R23Q
Table 3. Mutations of exon 4 of Akt1 gene. Two missense mutations were found on exon 4 while 5 silent mutations have been reported in our population, one mutation has been found in the non-coding region at position 15522C/T. PD: progressive disease, RP: partial response, SD: stable disease, RM: medium response, RC: complete response
PTEN mutations:
We performed mutational analysis on hot spot exons 5, 7 and 8 of PTEN gene. Fourteen samples have shown mutations on the mentioned exons representing 18 % of the study population distributed as the following: 7 (10.2 %), 9 (13.2 %) and 2 (2.9 %) on exons 5, 7 and 8, respectively. Five patients have shown more than one mutation representing 7 % of the whole study population and 36 % of total PTEN mutations (Table. 4) (Appendix A).
Kaplan-Meier Survival analysis didn’t show statistical significant difference by gaining PTEN mutations (Figure. 16), but the whole mutations in PIK3CA, AKT and PTEN have shown a significant effect of these mutations on the OS (P= 0.009) (Figure. 17) but not on the PFS-I (P > 0.05) (Figure. 18).
RESPONSE PTEN PD V217I PD V133I RC G132D,V216M RC Q110X RC C105Y RM Y225C RP P96L, R233* RP P213S,R233* RP R130*, G230E SD Q214* SD C105Y SD H272R SD S227F, E291K SD M134I
Table 4. PTEN gene mutations. 14 mutations have been found on exons 5, 7 and 8. PD: progressive disease, RP: partial response, SD: stable disease, RM: medium response, RC: complete response.
Figure 16: PTEN mutations and Overall survival. Kaplan Meier curve of PTEN mutations do not show any significant relationship with the OS of the study population (P > 0.05).
Figure 17: PIK3CA/AKT1/PTEN mutations and Overall survival. Kaplan Meier curve shows that Overall survival (OS) is significantly reduced in the presence of PIK3CA/AKT1/PTEN mutations, P = 0.009 (---PIK3CA/AKT1/PTEN mutated patients) ( Wt patients).
Figure 18: PIK3CA/AKT1/PTEN mutations and I. Kaplan Meier curve of PFS-I do not show significant relationship with gaining PPFS-IK3CA/AKT1/PTEN mutations, P>0.05 (---PIK3CA/AKT1/PTEN mutated patients) ( Wt patients).
FcγRIIa R131H polymorphism:
R131H polymorphism of FcγRIIa gene has been performed by direct sequencing. Our results have shown the following distribution of the three genotypes: 4 (5 %) patients have H131H, 57 (74 %) patients have R131H and 16 (21 %) patients have R131R polymorphisms (Appendix A) (Figure. 19). Due to the low number of H131H polymorphism in our population we included this polymorphism in the FcγRIIIa F158V survival analysis. Our data shows that H131H and/or V158V homozygous genotypes are significantly related with the OS but not to the PFS-I (Figure. 22).
Figure19: Genotypic distribution of H131H, H131R and R131R polymorphisms of FcγRIIa. H131H homozygous genotype has the lowest percentage in our study population.
FcγRIIIa F158V polymorphism:
By using Pyro-sequencing and High Resolution Melting Point (HRM)-PCR technologies (Figure. 21) we found the following results: 2 (3 %) patients have F158F, 50 (65 %) patients have F158V and 25 (32 %) patients have V158V polymorphisms on FcγRIIIa gene (Figure. 20).
Figure 20: Phenotypic distribution of V158V, F158V and F158F polymorphisms of FcγRIIIa. F158F homozygous polymorphism has the lowest percentage in our study population.
(A)
(B)
(D)
(E)
(F)
Figure 21: Pyro-sequencing and HRM results of FcγRIIIa. (A) A/A homozygous genotype, expressing F/F phenotype, (B) A/C heterozygous genotype, expressing F/V phenotype, (C) C/C homozygous genotype, expressing V/V phenotype. E, F and G representing the HRM results of FcγRIIIa polymorphisms.
Kaplan-Meier survival analyses of FcγRIIa and FcγRIIIa polymorphisms have shown a significant relationship with the patient’s overall survival OS (Figure. 22) but not to the PFS-I. Patients with V/V and H/H homozygous genotype have shown better survival than other polymorphisms. Our results show a strong impact of V/V and H/H on the patient’s survival.
Figure 22: FcγRIIIa and FcγRIIa polymorphisms and Overall survival. Kaplan Meier curve shows that Overall survival (OS) is significantly improved in patients with V/V and H/H homozygous polymorphisms of FcγRIIIa and FcγRIIa genes P = 0.0037 (Line 1: V/V or H/H patients) (Line 2:---F/R carrier patients).
Figure 23: FcγRIIIa and FcγRIIa polymorphisms and Progression free survival. Kaplan Meier curve of Progression free survival (PFS-1) is not significantly related with V/V and H/H homozygous polymorphisms of FcγRIIIa and FcγRIIa genes P < 0.05 (Line 1: V/V or H/H patients) (Line 2:---F/R carrier patients).
Impact of all mutations and polymorphisms on the OS and PFS-I:
To determine the possible interacting role of all mutations and polymorphisms together to predict or affect the OS or PFS-I of HER+ metastatic breast cancer patients under the treatment of Trastuzumab, we performed Cox-Proportional Hazard Regression analysis for PK3CA, AKT1, and PTEN mutations, Cox-regression analyses have shown a highly significant impact of all these factors P = 0.0009 (Figure. 24).
Figure 24: PIK3CA/AKT1/PTEN mutations and Cox-Proportional Hazard Regression of OS. Cox-Proportional Hazard Regression analysis of OS is significantly related with the presence of PIK3CA/AKT1/PTEN mutations P < 0.0001 (---PIK3CA/Akt1 mutated patients) ( Wt patients).
In order to understand the impact of each combination of mutations and polymorphisms factors we divided our groups in to 4 groups according to their genotypes, (Wt and V/V or H/H patients), (Wt and F or R carrier patients), (PIK3CA/AKT1/PTEN mutated and V/V and H/H SNPs) and (PIK3CA/AKT1/PTEN mutated and F or R SNPs carrier patients).
Interestingly, we found that wild type patients (who have no mutation on the screened hot spots) with homozygous V/V or H/H genotypes have much more butter survival than the other genotypes
Figure 25: PIK3CA/AKT1/PTEN mutations and FcγRIIIa and FcγRIIa SNPs and Overall survival. Kaplan Meier curve shows that Overall survival (OS) is significantly related with the presence of PIK3CA/AKT1/PTEN mutations and SNPs of FcγRIIIa and FcγRIIa P = 0.0069, (1. Wt and V/V or H/H patients) (2. Wt and F or R patients) (3.--- PIK3CA/AKT1/PTEN mutated and V/V and H/H SNPs) (4.--- PIK3CA/AKT1/PTEN mutated and F or R SNPs carrier patients).
Figure 26: PIK3CA/AKT1/PTEN mutations and FcγRIIIa and FcγRIIa SNPs and Progression free survival. Kaplan Meier curve shows that Progression free survival (PFS-I) is not significantly related with the presence of PIK3CA/AKT1/PTEN mutations and SNPs of FcγRIIIa and FcγRIIa, but PIK3CA/AKT1/PTEN mutations and F or R SNPs carrier patients showing worse PFS-I. (1. Wt and V/V or H/H patients) (2. Wt and F or R patients) (3.
---PIK3CA/AKT1/PTEN mutated and V/V and H/H SNPs) (4.
---PIK3CA/AKT1/PTEN mutated and F or R SNPs carrier patients).
Moreover; patients with any PIK3CA/Akt1 mutation and F or R genotypes have worse survival than the other genotypes (Figure. 25). PFS-I did not show a significant impact on patients survival, nevertheless, patients with any PIK3CA/Akt1 mutation and F or R genotypes still show the worse survival (Figure. 26).
IGF1-R Expression Analysis:
In the last step of our research, we have investigated the proposed effect of IGF1-R expression on the trastuzumab resistance. We performed Q-PCR by using relative gene expression IGF1-R/B2M. Our results have shown IGF1-R expression might be related with Trastuzumab response in HER-2 positive metastatic breast cancer patients (Figure. 27); we found that IGF1-R is overexpressed in the three groups of progressive disease (PD), partial response (RP) and stable disease (SD). On the other hand, IGF1-R is significantly less expressed in complete response group (RC) p < 0.05. These results might be very important tool for patients’ classification prior starting treatment.
Figure 27: IGF1-R expression in HER-2 positive metastatic breast cancer patients. Our data shows that complete response (RC) to Trastuzumab patients are the least expressing of IGF1=R, * p < 0.05. (RC: complete response, PD: progressive disease, RP: partial response, SD: stable disease).
Discussion:
HER2 is significantly overexpressed in about 20 – 30 % of invasive breast cancers [7-10]. In September 1998 Trastuzumab (Herceptin) became the second monoclonal antibody approved for the treatment of a malignant condition, and the first antibody approved for the treatment of a solid tumor. It is a mouse-human chimeric antibody that produces anti-tumor effects by blocking the HER2-neu receptor, and can also interact with human immune cells to affect antibody dependent cell-mediated cytotoxicity ADCC. Nevertheless, the exact mechanism of Trastuzumab mechanism of action is not fully understood. Pivotal trials in breast cancer have shown that it has activity as a single agent in a subset of patients whose tumors greatly overexpressed HER2, but results were even more impressive when it was used in combination with chemotherapy [80, 81].
It has been proposed that Trastuzumab cannot block ligand-induced HER2 heterodimers, suggesting it cannot effectively inhibit HER2 signaling and high levels of HER2 homodimers correlated with longer time to progression following Trastuzumab therapy in a cohort of patients with HER2-overexpressing breast cancer. Concluding, high levels of HER2 homodimers may predict a positive response to Trastuzumab.
Unfortunately, almost 50 % of treated patients show resistance to Trastuzumab at the beginning of regimen or eventually. Preclinical studies have proposed some mechanisms of Trastuzumab resistance in HER2 positive breast cancer patients. Mainly, obstacles for trastuzumab binding to HER2, upregulation of HER2 downstream signaling pathways, signaling through alternate pathways and failure to trigger immune-mediated mechanisms to destroy tumor cells [6, 27].
It has been demonstrated that Trastuzumab resistance mechanisms are related with deregulation of PTEN/PI3K/Akt/mTOR pathway, and/or EGFR and IGF1R overexpression in a subset of HER2-positive breast carcinomas [82]. Moreover, it has been indicated that restoration of ECD expression sensitizes
HER2-negative or HER2-downregulated human cancer cells to Trastuzumab-mediated ADCC [83].
In spite of the involvement of HER family proteins in PTEN/PI3K/Akt signaling pathway, we proposed mutations of HER2, PTEN, PI3K and Akt signaling proteins, and IGF1R overexpression in a subset of HER2-positive breast carcinomas to be contributed in the resistance of Trastuzumab. Moreover, ADCC is an immune response to the presence of antibody binding to certain targets such as Trastuzumab and HER2 complex; we proposed the impact of certain Fc receptors polymorphisms to affect the efficacy of Trastuzumab.
Our study populations consists of 77 patients who have been diagnosed with HER2 positive metastatic breast cancer according to the standard protocols of the Pathology and Medical Oncology Department of the Az-USL5 of Pisa at Hospital-University of Pisa.
We performed direct DNA sequencing for the main hot spots of PIK3CA, Akt1, PTEN and HER2 genes, as well as screening ofFcγRIIIa-158 and FcγRIIa-131 polymorphisms. Then, we performed analysis of patients’ survival in relation to either gaining mutations or changing in FcγR polymorphisms. Our results show consistent results with some preclinical and cohort clinical studies, proposing a powerful role of these findings in predicting patient's response to Trastuzumab treatment. Moreover, these results could be used in the development of new therapeutic strategy for HER2 positive metastatic breast cancer patients.
PIK3CA is one of the most common mutated genes in various types of cancers. In breast cancer, PIK3CA mutation has been estimated to be between 20% and 40% [84]. Previously, our lab reported 35%-50% PIK3CA mutations in certain population of breast cancer [85]. PIK3CA mutations have been independently associated with poor prognosis of breast cancer patients [86]. Here we confirmed the presence of similar incidence of PIK3CA mutations in an Italian population diagnosed with HER2 positive metastatic breast cancer patients. 21% of the study
population shows mutations in exon 9 and 20 of PIK3CA gene which is consistent with national and international findings. We found E545K missense mutation in 5 samples of our patients. As expected, we found a strong relationship between patient's overall survival (p < 0.0001) and progression free survival (p = 0.0001) and gaining PIK3CA mutations. PIK3CA mutations showed a strong impact on patient's survival, therefore we calculated the percentage of PIK3CA mutations in each subset of HER2 positive patients. Complete response (RC) patients to Trastuzumab have shown the least percentage of PIK3CA mutations (42 %); only one patient has mutation out of 17. PIK3CA mutations show an independent risk factor of developing resistance to Trastuzumab, suggesting the use of anti PIK3CA treatments in combination with Trastuzumab.
Akt1 as a PIK3CA downstream signaling molecule is frequently mutated in some cancers; we reported a very low percentage of Akt1 mutations on exon 4. Two samples show two novel missense mutations on exon 4. Since mutation frequency of Akt1 is very low in our population we included these two mutations in PIK3CA mutation group to perform survival analysis. Our results show the same impact of PIK3Ca/Akt1 mutations on patient's survival. Interestingly, we reported five silent mutations on exon 4 of Akt1 gene, more studies are recommended to analyze Akt1 mutations in HER2 positive metastatic breast cancer patients.
PTEN is frequently mutated in breast cancer. PTEN, phosphatase tensin like protein, is activated through cell signaling to inhibit activated PIK3CA by dephosphorylation. Loss of PTEN has been correlated to Trastuzumab resistance independently or in combination with other signaling molecules including PIK3CA mutations. Here we proposed PTEN mutations to be involved In Trastuzumab resistance; therefore we screened three hot spot exons 5, 7 and 8. As expected, we reported 14 samples with PTEN mutations representing 18 % of our patients, but not significantly related to patient's survival, concluding a low impact of gaining PTEN mutation on predicting patient's response to Trastuzumab. Further studies are recommended to screen PTEN mutations on all exons and there functional role of these mutations, as well as PTEN-LOH analysis is highly recommended in such
![Figure 6: The structure of human sHER2 and Herceptin-Fab. Ribbon diagram of the human sHER2 and Herceptin Fab complex showing binding site on domain IV [26].](https://thumb-eu.123doks.com/thumbv2/123dokorg/7614861.115654/17.892.287.598.171.418/figure-structure-herceptin-ribbon-diagram-herceptin-showing-binding.webp)