Three-dimensional distribution of primary melt inclusions in garnets by X-ray
microtomography k
Matteo Parisatto
1,*, alice turina
1, GiusePPe cruciani
2, lucia Mancini
3, luca Peruzzo
4, and
Bernardo cesare
11Dipartimento di Geoscienze, Università degli Studi di Padova, via G. Gradenigo 6, 35131 Padova, Italy 2Dipartimento di Fisica e Scienze della Terra, Università degli Studi di Ferrara, via G. Saragat 1, 44122 Ferrara, Italy
3Elettra-Sincrotrone Trieste S.C.p.A., S.S. 14, 34149 Basovizza (Trieste), Italy 4CNR, Istituto di Geoscienze e Georisorse, via G. Gradenigo 6, 35131 Padova, Italy
a
BstractX‑ray computed microtomography (X‑μCT) is applied here to investigate in a non‑invasive way the three‑dimensional (3D) spatial distribution of primary melt and fluid inclusions in garnets from the metapelitic enclaves of El Hoyazo and from the migmatites of Sierra Alpujata, Spain. Attention is focused on a particular case of inhomogeneous distribution of inclusions, characterized by inclusion-rich cores and almost inclusion-free rims (i.e., zonal arrangement), that has been previously investigated in detail only by means of 2D conventional methods. Different experimental X‑μCT configurations, both synchrotron radiation- and X-ray tube-based, are employed to explore the limits of the technique. The internal features of the samples are successfully imaged, with spatial resolution down to a few micrometers.
By means of dedicated image processing protocols, the lighter melt and fluid inclusions can be separated from the heavier host garnet and from other non-relevant features (e.g., other mineral phases or large voids). This allows evaluating the volumetric density of inclusions within spherical shells as a function of the radial distance from the center of the host garnets. The 3D spatial distribution of heavy mineral inclusions is investigated as well and compared with that of melt inclusions.
Data analysis reveals the occurrence of a clear peak of melt and fluid inclusions density, ranging approximately from 1⁄3 to 1⁄2 of the radial distance from the center of the distribution and a gradual
decrease from the peak outward. Heavy mineral inclusions appear to be almost absent in the central portion of the garnets and more randomly arranged, showing no correlation with the distribution of melt and fluid inclusions. To reduce the effect of geometric artifacts arising from the non‑spherical shape of the distribution, the inclusion density was calculated also along narrow prisms with differ-ent oridiffer-entations, obtaining plots of pseudo‑linear distributions. The results show that the core‑rim transition is characterized by a rapid (but not step-like) decrease in inclusion density, occurring in a continuous mode. X‑ray tomographic data, combined with electron microprobe chemical profiles of selected elements, suggest that despite the inhomogeneous distribution of inclusions, the investigated garnets have grown in one single progressive episode in the presence of anatectic melt. The continu-ous drop of inclusion density suggests a similar decline in (radial) garnet growth, which is a natural consequence in the case of a constant reaction rate.
Our results confirm the advantages of high‑resolution X‑μCT compared to conventional destructive 2D observations for the analysis of the spatial distribution of micrometer-scale inclusions in minerals, owing to its non‑invasive 3D capabilities. The same approach can be extended to the study of different microstructural features in samples from a wide variety of geological settings.
Keywords: Garnet, anatexis, melt inclusions, X-ray computed microtomography, El Hoyazo;
High-grade Metamorphism, Anatexis, and Granite Magmatism
i
ntroductionInclusions in minerals may be of different origin, and thus they may consist of other solids, low‑density fluids, or glasses. These are referred to as solid, fluid, and melt inclusions,
respec-tively. When entrapped by the host mineral during its growth, the inclusions are also defined as primary (Roedder 1984), and they may provide key information on the physico-chemical conditions at which the host was growing.
Excluding for the sake of simplicity the case of melt in-clusions in phenocrysts from igneous rocks, the ability of a metamorphic/anatectic host to entrap inclusions depends on several factors such as the nature of the matrix (i.e., mineralogical composition, presence of fabric, and abundance of fluid/melt), 0003-004X/18/0006–911$05.00/DOI: http://doi.org/10.2138/am-2018-6216CCBYNCND 911
* E-mail: [email protected]
k Open access: Article available to all readers online. This article is CC-BY-NC-ND.
Special collection papers can be found online at http://www.minsocam.org/MSA/ AmMin/special-collections.html.
the nature of chemical reactions occurring at the edges/faces of growing host, the effectiveness of diffusional processes at the same sites (in turn a function of pressure, temperature, matrix grain size, and the presence and composition of an intergranular fluid/melt phase), the presence and type of strain (coaxial and non-coaxial) occurring in the rock, the surface energy of the in-terface between host and included phase, and, not least, the rate of growth of the host phase (e.g., Roedder 1984; Barker 1990; Waters and Lovegrove 2002; Vernon 2004). As a result of the complex interplay of these factors, the distribution of primary inclusions in a poikiloblast may be highly variable even under the same P-T conditions of growth, and the inclusions in a mineral may be totally absent, homogeneously distributed throughout the host volume, or spatially localized.
A particular case of inhomogeneous distribution of inclusions, which is the subject of the present research, is when inclusions are clustered in the central part of the host (a variably wide core), and the external rim is inclusion-free. Such a simple distribution is observed in the different types of host that formed in both sub- and suprasolidus environments (Fig. 1) and is by far most reported in garnets. Inclusions in garnets showing clustered cores and clear rims may be fluid, solid, or melt (glassy or crystallized) or a combination of the three types (Figs. 1a and 1b). When in presence of fluid inclusions, this type of zonal arrangement (Roedder 1984) is considered as one of the most reliable criteria for a primary entrapment of the inclusions.
In sub-solidus examples, inclusions are often quartz or biotite, or can consist of tiny (10–20 μm) ilmenite, sphene, graphite, rutile, or also fluid inclusions (Figs. 1a, 1c, and 1d). In migmatites and granulites the above phases can be accompanied by nanogranitoids (Fig. 1b), which represent the product of crystallization of former melt inclusions (Cesare et al. 2015). In garnets from migmatites, the boundary between inclusion‑rich cores and inclusion‑free or ‑poor rims is often well defined and in bidimensional (2D) cuts, such as scanning electron microscope (SEM) images or petrographic thin sections, it may be charac-terized by polygonal shapes, with sides parallel to the garnet’s faces (Figs. 1e and 1f).
There are many possible interpretations and explanations for this kind of distribution of inclusions in poikiloblasts, and they should be based not only on microstructural observations but also on chemical data and on a knowledge of the petrological context in which the rock has formed or evolved.
In some cases, the zonal arrangement of inclusions in poikiloblasts may reflect overgrowth of different mineralogical domains in a rock. For example, in metapelites from the Bush-veld Complex aureole (South Africa), staurolite idioblasts show a marked change from inclusion‑rich portions where staurolite overgrew the quartz‑bearing matrix, to inclusion‑poor in the staurolite overgrowing chloritoid (Waters and Lovegrove 2002).
In other cases, based on differences in inclusion assemblages and chemical profiles, the different microstructural domains are interpreted as the result of two stages of growth. This is often observed in garnets from UHP (ultrahigh‑pressure) rocks where inclusion-rich cores are surrounded by clear rims in both mafic and metasedimentary protoliths, and the two events may occur both in the prograde, compressional path (e.g., Konrad-Schmolke et al. 2008) or during decompression (e.g., Klonowska et al.
2017). In the above examples the two growth stages belong to a single continuum P-T evolution and are not evidence of polymetamorphism (Konrad-Schmolke et al. 2008), even though the P-T conditions at which the two stages occur are markedly different (~3 GPa difference in Klonowska et al. 2017).
There are also examples of garnets in which the highly poikiloblastic cores and clear rims—even though the chemical zoning for major and/or trace elements shows irregularities, sharp discontinuities, or distinct annuli—have been interpreted as the result of a single continuous growth episode, during which crystallization conditions changed, either in terms of garnet-forming reaction (e.g., Picuris Mountains, New Mexico, Moore et al. 2013) or in terms of fluid composition (e.g., Harpswell Neck, Maine, Carlson et al. 2015).
In the above works the cause for the apparently sharp contrast between poikiloblast interior and rim has been recognized in either a marked drop in growth rates during rim growth, which would prevent inclusion entrapment (Konrad‑Schmolke et al. 2008), or in the abrupt increase of intergranular diffusivity, which would allow effective removal of matrix quartz adjacent to the growing garnet rim (Carlson et al. 2015).
When describing the microstructural aspects of garnets, the cited works and most of the literature refer to the change in inclu-sion density between the garnet domains as abrupt or stark, on the basis of visual inspection of 2D images such as petrographic or SEM micrographs. But is it really so? Also is the profile of concentration of inclusions actually characterized by a substantial step, as often observed for major or trace elements?
To evaluate this issue, which is fundamental for a correct interpretation of the relationships between microstructure and re-action history, the investigation of the actual spatial arrangement of inclusions within their host phase is required. In this regard, the non-destructive access to three-dimensional (3D) information with an adequate spatial resolution is a crucial aspect to extract meaningful information, not affected by sample preparation.
The investigation of microstructural features in geological materials has traditionally relied on 2D observations and imag-ing, based essentially on optical and electron microscopy. The use of 2D techniques provides fundamental overall informa-tion, but may also lead to erroneous interpretations, since the observed features are actually only a partial picture of a more complex 3D microstructure. This latter can be partially accessed by laborious serial sectioning/grinding methods (e.g., Byron et al. 1995; Spear and Daniel 1998; Daniel and Spear 1999; Mock and Jerram 2006). However, besides a highly destructive and time-consuming sample preparation, such methods are generally affected by a low spatial resolution along the direction perpen-dicular to the observation plane (Marschallinger 1998), as part of the sample is lost at each stage of grinding and polishing. Using a similar principle at the micro- and nanoscale, high-resolution 3D information can be obtained by means of focused ion beam (FIB) ablation technology coupled with electron microscopy imaging (e.g., Sakamoto et al. 1998; Dunn and Hull 1999; Keller et al. 2011).
During the last two decades, real 3D information on the mi-crostructure of rocks and minerals has become available thanks to the advances of X‑ray computed microtomography (X‑μCT or micro-CT), using instruments based both on conventional X-ray
tubes and synchrotron radiation sources. Nowadays X‑μCT has become an established technique for the characterization of many kinds of materials, owing to its 3D imaging capabilities combined with excellent spatial resolution (up to the sub‑micrometer scale) and complete non-invasiveness. Several advantages are offered by synchrotron radiation‑based X‑μCT devices (parallel beam geometry) compared to X-ray tube-based scanners (cone-beam geometry), including faster acquisition times, a more accurate reconstruction process, increased sensitivity and contrast, and a general reduction of image artifacts. Significant improvements in terms of image contrast and phase identification can be obtained using particular experimental configurations such as dual energy X‑μCT (e.g., Primak et al. 2007) and in‑line phase‑contrast μCT, using both synchrotron sources and advanced laboratory setups (Cloetens et al. 1999; Mayo et al. 2012).
In the geosciences, one of the first reported application of
computed X‑ray tomography is the pioneering work by Carlson and Denison (1992) focused on porphyroblasts crystallization. Since then, X‑μCT has become increasingly popular, in particu-lar during the last decade, with many successful applications, including e.g., 3D microstructural characterization of garnet porphyroblasts (Huddlestone-Holmes and Ketcham 2005, 2010; George and Gaidies 2017), analysis of 3D distribution and shape of vesicles in volcanic rocks (Polacci et al. 2006, 2010; Voltolini et al. 2011; Giachetti et al. 2011; Baker et al. 2012), evaluation of porosity in reservoir rocks (Van Geet et al. 2000; Blunt et al. 2013; Zambrano et al. 2017), study of crack formation mecha-nisms in sedimentary rocks (Zabler et al. 2008), microstructural analysis of ore-bearing rocks (Godel 2013), identification of mineral inclusions in diamonds (Nestola et al. 2012), and mor-phological analysis of mineral nodules (Valentini et al. 2015).
In this study, X‑μCT is used to quantitatively investigate for FiGure 1. Thin‑section photomicrographs showing examples of garnet poikiloblasts with inclusion‑rich cores and inclusion‑free or ‑poor rims.
(a) Blueschist from Calabria, Italy; (b) pelitic migmatite from Ivrea Zone, Italy, containing both solid and nanogranitoid inclusions; (c) pelitic migmatite from Aus, Namibia; (d) retrogressed eclogite from the Moldanubian Zone, Czech Republic; (e) anatectic metasedimentary enclaves from El Hoyazo, Spain; (f) close‑up of the boundary between inclusion‑rich and inclusion‑free portions of a garnet crystal from image e.
the first time the 3D distribution of primary melt and fluid inclu-sions in garnets extracted from the metapelitic enclaves of the El Hoyazo dacites (Neogene Volcanic Province, Betic Cordillera, SE Spain) and from the Sierra Alpujata migmatites, also in the Betic Cordillera. The attention is focused in particular on the characterization of the actual sharpness of the boundary between inclusion-rich cores and inclusion-free rims.
M
aterialsandMethodsSamples and their geological setting
The studied garnets have been extracted from four samples of partially melted rocks, where they formed during partial melting, trapping inclusions of anatectic melt. Three of them (AVHZ-6, HO-33, and HO-50) are anatectic enclaves in the dacite of El Hoyazo, from the Neogene Volcanic Province (NVP) of southeastern Spain. The fourth rock sample (ALP-1) is a migmatite from Sierra Alpujata, beneath the Ronda peridotite, also in southern Spain.
The El Hoyazo area is characterized by erupted volcanics hosting abundant (10–15 vol%, Zeck 1992) exotic material including metapelitic enclaves with extremely residual bulk composition, depleted in a granitic melt component. At El Hoyazo, two different types of enclaves have been extensively characterized in previous studies (Cesare 2000; Cesare et al. 1997, 2005; Acosta-Vigil et al. 2007, 2010, 2012; Ferrero et al. 2011): biotite-garnet-sillimanite type (Bt-Grt-Sil, Fig. 1e) and spinel-cordierite type (Spl-Crd, mineral abbreviations after Kretz 1983). The metasedimentary enclaves at El Hoyazo are a very unusual example of partially melted crustal fragments preserved within host dacitic lavas in a unique geological setting. Magmas of different composition emplaced in the area as a consequence of a complex and still debated geodynamic evolution that involved the opening of the Alborán Sea in the Late Tertiary, and asthenospheric upwelling. The anomalous heat flow caused the partial melting of the crust and the formed melt probably interacted with mantle magmas, explaining at least part of the differentiation of the volcanics of the NVP. In such a context, fragments of partially molten, residual metasedimentary crust were brought to surface by the volcanic events as enclaves in the lavas (Zeck 1970; Cesare and Gómez-Pugnaire 2001; Acosta-Vigil et al. 2007; Ferrero et al. 2011).
U-Pb dating of melt inclusion-bearing zircons and monazites (Cesare et al. 2003, 2009a) suggests an anatexis age (metamorphic peak) of 9.3–9.9 Ma. At 6.3 Ma extrusion occurred (Zeck and Williams 2002), bringing to the surface both the dacitic lavas and the enclaves. The rapid ascent caused the fast cooling of rocks and melt, preventing the crystallization of the melt entrained within inclusions, which was quenched to glass. Enclaves record anatexis starting at about 700 °C and proceeding up to 850 ± 50 °C, at pressure of 5–7 kbar (Cesare et al. 1997, 2005; Acosta‑Vigil et al. 2007, 2010, 2012; Ferrero et al. 2011). The growth of peritectic garnet appears to have initiated in the early stages of this prograde anatectic history, below 750 °C, without support for a multi‑stage growth of garnet (Acosta‑Vigil et al. 2010). Rather, there is evidence that after growth, garnet underwent an event of partial consumption, probably after decompression, with development of Spl‑Crd coronae in a static environment (Álvarez-Valero et al. 2007).
The rocks from Sierra Alpujata have been characterized in detail by Bartoli et al. (2013a, 2013b, 2013c, 2014): they are fine‑grained metatexite migmatites with a bulk composition comparable to a Ca‑poor, Si‑rich peraluminous greywacke. Ana-texis started by muscovite breakdown melting, and subsequently involved minor biotite breakdown by continuous reactions, with final P–T conditions of equilibra-tion of 4.5–5 kbar and 660–700 °C. The amount of garnet in these composiequilibra-tions and at such P-T conditions is very small, just a few volume percent. Compared with the anatectic rocks from El Hoyazo, those from Sierra Alpujata underwent a much slower cooling, typical of regional migmatite terrains.
Garnets and their anatectic melt inclusions
Garnet crystals were handpicked from gently crushed rock samples. The garnets named from A to C (see Table 1) come from El Hoyazo enclaves of the Bt-Grt-Sil type. They are sub- to euhedral and have a size ranging from 1 to 5 mm in diameter. The garnets are rich in rhyolitic melt, solid, and fluid inclusions, which are clustered at their cores (Fig. 1e), with an apparent microstructural change from inclusion-rich cores to inclusion-free or -poor rims.
Melt (glassy) inclusions (Fig. 1f) from the El Hoyazo metapelitic enclaves have been investigated in detail especially within garnet and plagioclase (e.g., Acosta-Vigil et al. 2007, 2010; Ferrero et al. 2011) but they can be found in nearly
all mineral phases such as biotite, cordierite, spinel, K-feldspar, quartz, ilmenite, zircon, monazite, apatite, and corundum (Cesare 2008). The garnet crystals are iron-rich (Alm75–80; Cesare 2000) and typically contain abundant inclusions of
undevitrified, colorless, rhyolitic glass, associated with a single shrinkage bubble; the latter may be empty or contain COH fluids, either exsolved from or immiscible with the melt. In fact, the enclaves from El Hoyazo provide excellent examples of the immiscible trapping of glass and fluid inclusions (Cesare et al. 2007; Ferrero et al. 2011). The size of melt inclusions in garnets from El Hoyazo, as observed from optical and electron microscopy, ranges from a few micrometers to tens of micrometers, rarely exceeding 30 μm (Acosta‑Vigil et al. 2007; Ferrero et al. 2011). Their morphology is generally regular, with abundant negative crystal shapes, indicating a crystallographic control by the host mineral. Along with glassy and fluid inclusions, garnets include crystals of biotite, graphite, plagioclase, sillimanite, ilmenite, and very minor zircon, monazite, and apatite.
The Sierra Alpujata garnets investigated in this study (hereafter named D1 and D2) come from a fine-grained stromatic metatexite migmatite, and are very small in size, rarely exceeding 400 μm (Bartoli et al. 2016). The crystals selected for this study do not exceed 300 μm in diameter. Despite the small size, these garnets often show cores rich in inclusions and clear rims (Bartoli et al. 2013a, 2013b) although more complex, helicitic distributions are also observed (Bartoli et al. 2016). The garnets are slightly zoned, with a composition Alm72–75Prp20–23Sps2–3Grs2–3. Unlike
the glassy inclusions in El Hoyazo garnets, melt inclusions from Sierra Alpujata are crystallized into nanogranites (Cesare et al. 2009b): aggregates of quartz, feldspars, and muscovite formed by the crystallization of droplets of hydrous granitic melt (Bartoli et al. 2013a, 2014). In places the nanogranite inclusions still preserve some glass. Inclusions in garnets from Sierra Alpujata display an isometric, nega-tive crystal shape and are 2 to 10 μm in diameter, smaller than in garnets from El Hoyazo. Their very small size allowed us to explore the spatial resolution limits of the analytical setup used in this research.
X‑ray microtomography (X‑μCT) setup and data collection
Numbering of samples and the experimental setups adopted for the investi-gation of each of them are reported in Table 1. The selected garnet crystals were individually mounted on the rotating sample stage for X‑μCT experiments and fixed using beeswax. In the case of the small garnets from Sierra Alpujata, 13 garnet grains, ranging in diameter approximately from 150 to 300 μm, were placed inside a small cylindrical plastic tube and analyzed together in a single tomographic data collection. Only two of them (D1 and D2) were selected for data analysis, on the basis of their slightly larger size and higher inclusion content.
Synchrotron‑based X‑μCT experiments were carried out at the SYRMEP beamline (Tromba et al. 2010; Polacci et al. 2010) of the Elettra synchrotron facility (Trieste, Italy). The optics of the monochromatic beam end-station is based on a Si (111) double‑crystal monochromator, working in an energy range between 8.3 and 40 keV. A beam energy of 35 keV was used for the investigation of the largest garnets (samples from El Hoyazo), as a consequence of their relatively high X-ray attenuation. For each tomographic scan, 1440 X‑ray projections were acquired with a constant angular step over a 180° rotation by a water‑cooled, 12‑bit, 4008 × 2672 pixels CCD camera coupled with a gadolinium oxysulphide (Gadox) scintillator screen by a fiber‑optic taper. The effective pixel size of the images was set to 4.5 μm and a sample‑to‑detector distance of 500 mm was selected. Garnets A1 and D were investigated also with polychromatic X‑rays (white beam mode) using the dedicated end‑station of the SYRMEP beamline. In the white beam configuration, the outcoming beam from the storage ring is intercepted before the monochromator and pre‑filtered with 1.5 mm of Si and 1.0 mm of Al. In this case, a water‑cooled, 16‑bit, 2048 × 2048 pixels microscope CCD camera, coupled with a 100 μm thick LuAG scintillator screen was used as detector. The mean X‑ray beam energy was 28 keV, but with a much higher photon flux compared to the monochromatic beam
Table 1. Experimental setup adopted for each of the investigated samples
Rock sample Garnet S.R. X-µCT S.R. X-µCT Cone-beam name crystal name (monochr. beam) (white beam) X-µCT (TomoLab)
AVHZ-6 A1 X X A2 X HO-33 B X HO-50 C X ALP-1 D1 X X D2 X X
Note: Synchrotron radiation (S.R.) data sets (both monochromatic and white
mode. The sample‑to‑detector distance was set at 75 mm and the effective pixel size of the detector at 2.2 μm. In spite of the higher spatial resolution achieved with the different detector used and higher flux available, the adoption of a polychromatic radiation introduced in the reconstructed images a considerable beam hardening effect, related to the preferential attenuation of lower energy photons while they travel through the sample (e.g., Haibel 2008), which had to be compensated using a polynomial correction.
In both configurations, owing to the propagation distance between sample and detector, edge-enhancement by means of in-line (propagation-based) phase-contrast (Snigirev et al. 1995; Raven et al. 1996; Cloetens et al. 1999) significantly contrib-uted to the overall signal as well. In the context of geosciences, X‑ray phase‑contrast imaging has particular value in the 3D characterization of multiphase materials where the different components can have similar X‑ray attenuation coefficients (Baker et al. 2012). The use of phase‑contrast effects allows to detect very small details and to highlight the interfaces between the different phases compared to the pure absorption mode. The reconstruction of tomographic slices was carried out using the SYRMEP Tomo Project (STP) software developed at Elettra (Brun et al. 2015, 2017).
Sample C (HO‑50) was investigated by means of a cone‑beam X‑μCT instru-ment at the TomoLab facility of Elettra (Zandomeneghi et al. 2010). Owing to the higher absorption related to its larger size compared to the other samples, a higher energy beam was required to investigate this garnet. The TomoLab instrument is equipped with a sealed microfocus X‑ray tube with a tungsten anode and a minimum focal spot size of 5 μm, which was operated at 120 kV and 66 μA. Sample projec-tions were collected by a water‑cooled, 12‑bit, 4008 × 2672 pixels CCD camera, coupled with a Gadox scintillator screen by a fiber‑optic taper, with an effective pixel size of 12.5 μm. A 1.5 mm thick Al foil was placed in front of the primary beam to reduce beam hardening effects and a geometrical magnification factor of 5 was selected. A set of 1800 X‑ray radiographs was acquired over a 360° rotation at a constant angular step, with an exposure time/projection of 7.5 s. A 2 × 2 binning was applied to the detector pixels to improve the signal‑to‑noise ratio. Axial slices were reconstructed with an isotropic voxel size of 5.0 μm using the FDK algorithm (Feldkamp et al. 1984) for cone-beam geometry, implemented in the commercial software COBRA (Exxim, U.S.A.). The freeware Fiji (Schindelin et al. 2012) was used for 2D slice visualization while 3D renderings were obtained by means of the commercial software VGStudio MAX 2.0 (Volume Graphics, Germany).
Electron microprobe analysis (EPMA)
The composition of a representative garnet extracted from rock sample HO‑50 was determined with a CAMECA SX50 electron microprobe at the Istituto di Geoscienze e Georisorse (IGG)-CNR of Padova, using an accelerating volt-age of 15 kV, a beam current of 15 nA and a focused beam of 1 μm in diameter. Natural and synthetic oxides were used as standards, and the garnet formulas were
recalculated on the basis of 12 O atoms, assuming all the iron content as Fe2+, in
agreement with the results of Cesare et al. (2005).
r
esults X‑μCT and SEM imagingThe main analytical challenge in the study of the El Hoyazo garnets by means of X‑μCT was their relatively high X‑ray absorption, a consequence of the high iron content. Samples of different sizes were investigated, from less than 1 mm up to 5 mm in diameter. On the one hand, garnets smaller than 1–2 mm in diameter were considered less representative for this locality, owing to the much lower content of melt inclusions compared to the largest ones. On the other hand, with crystals larger than 4.5 mm it was not possible to obtain a sufficient transmission of X-rays in synchrotron radiographic images at the SYRMEP beamline. Therefore, the attention was focused on three intermediate size garnets (2.5–4 mm) coming from rock samples AVHZ-6 and HO-33, named A1, A2, and B (Table 1). In the experimental conditions used for synchrotron experiments (both monochromatic and white beam mode) the image contrast between different phases was still satisfactory and the internal features of the garnets were successfully imaged, with a spatial resolution down to a few micrometers.
In Figure 2 the general appearance of the internal features of the El Hoyazo garnets is presented by means of a comparison between approximately co‑planar images of a garnet crystal from rock sample HO-50, obtained using different imaging methods. The first section (Fig. 2a) is a tomographic slice extracted from a 3D data set of the garnet, acquired by means of microfocus X‑μCT. The second image (Fig. 2b) was later obtained after cutting in a convenient orientation the same garnet for SEM backscattered electron (BSE) observations. Processing of mul-tispectral SEM–energy-dispersive spectroscopy (EDS) X-ray maps identified the inclusion phases inside the investigated sample (mainly biotite, sillimanite, and plagioclase) as shown
FiGure 2. (a) Reconstructed equatorial slice of a garnet extracted from the rock sample HO-50 from the El Hoyazo metapelitic enclaves,
obtained using a conventional microfocus X‑μCT device. The isotropic voxel size is 5 μm. (b) Roughly co-planar SEM-BSE image of the same garnet obtained after cutting and polishing. (c) X‑ray phase map obtained by SEM‑EDS chemical mapping; melt inclusions are labeled in white; the regions indicated as “mix” are constituted by an intergrowth of sillimanite and rhyolitic glass. The X‑ray EDS map is constituted by two separate acquisitions stitched together. The actual investigated area, which does not consider the inclusion‑poor left and right portions of the sample, is a compromise between spatial resolution and SEM operating time saving. The employed SEM is a CamScan MX3000 equipped with a LaB6 electron
in Figure 2c. Slight differences between tomographic and SEM images, in particular along outer edges and cracks, are related to the sample preparation procedure for SEM imaging (cutting and polishing) and to non-perfect co-planarity. The relative scale of gray values in tomographic images is similar to what is com-monly observed in SEM-BSE imaging, although the physical process of contrast generation is completely different in the two techniques. In tomographic images, considering an ideal pure absorption mode, the gray values of voxels (volume elements) in the slices are proportional to the mean value of the X-ray linear absorption coefficient (μ) in the corresponding volume of the real sample. Dark and bright voxels are associated with low‑ and high-absorbing materials, respectively (e.g., black for voids, white for heavy mineral inclusions). However, the actual gray values distribution in the slices is usually made more complex by other phenomena, in particular phase-contrast effects (Snigirev et al. 1995; Raven et al. 1996; Cloetens et al. 1999).
Image processing of X‑μCT data
In experimental X‑μCT images, the ability to separate two different materials depends mainly on the mean X-ray energy used but several other aspects may complicate this operation, such as: edge‑enhancement effects (Fresnel fringes) when work-ing with the in‑line phase‑contrast mode, overlappwork-ing of gray value ranges relative to phases with similar μ, partial volume effect (i.e., voxels occupied by two or more different materials), the presence of image noise and real density variations within a constituent. In particular, edge-enhancement by means of phase-contrast (related to the sample-to-detector distance) can be very helpful in the visualization of tiny details, improving the overall visual quality of tomographic images. However, this result is obtained through an alteration of the gray values in proximity of edges and interfaces (detectable as a series of bright and dark interference fringes) that may lead to difficult segmentation of, e.g., porosity or inclusions, and to erroneous interpretations if quantitative information has to be extracted.
To reduce phase-contrast artifacts and improve the segmenta-tion of materials with similar absorpsegmenta-tion coefficients, a possible approach is to use a single-distance phase-retrieval algorithm (Paganin et al. 2002; Weitkamp et al. 2011) that can be ap-plied to the sample projections before slice reconstruction. As a consequence of phase-retrieval correction, a certain amount of image blurring is introduced, since conditions of data col-lection are generally quite far from the ideal ones (this is the case in particular for polychromatic data). Moreover, geological samples are typically multi-phase materials and do not fulfill the theoretical requirements of the algorithm developed by Paganin et al. (2002) for single-phase, homogeneous objects (Arzilli et al. 2015). In this work, the same algorithm was applied to synchrotron X‑μCT data of garnets, acquired in phase‑contrast mode, also with polychromatic light (see Meyers et al. 2007; Arzilli et al. 2016). Phase‑retrieval pre‑processing was carried out using the STP software (Brun et al. 2015, 2017) employed also for tomographic reconstruction. For the investigated garnet samples, a δ/β ratio equal to 100 was selected for phase‑retrieval reconstructions (where δ is the refractive index decrement, pro-portional to the electron density of a material, and β is called extinction coefficient, related to the absorption coefficient and
wavelength). In multi‑component heterogeneous samples, phase‑ retrieval reconstructions can also be optimized to enhance a certain mineral or phase, by using different values of δ and β.
In the data sets reconstructed using phase-retrieval, a clear improvement in terms of separation of phases (e.g., porosity) was achieved, allowing to better differentiate minerals with similar absorption values. This is also confirmed by the appear-ance of new peaks in the gray value histograms, not detectable in the original phase-contrast data sets and corresponding to, e.g., sillimanite, plagioclase, or biotite inclusions. However, as a consequence of a certain level of image blurring introduced by the phase-retrieval procedure, a large fraction of small scale features is lost or extremely difficult to separate. For this reason, the original data sets were also employed for the investigation of melt and fluid inclusions, to preserve the maximum number of them, although this required a more complicated image processing strategy. Phase‑retrieval processing allowed us to simplify the segmentation of heavy mineral inclusions as well (characterized in general by a relatively larger size and a much lower amount) and to evaluate their spatial distribution in a more reliable way. The multi‑step image analysis protocols for the segmentation of inclusions, customized for the investigated samples, are illustrated in Appendix I1.
Size and spatial distribution of inclusions: El Hoyazo garnets
3D image processing and analysis were carried out using the Skyscan CT‑Analyzer software (Bruker Micro‑CT). The segmentation procedure described in Appendix I allowed us to easily visualize in 3D the entire sets of coexisting light inclusions (mostly glassy, but also some immiscible fluid ones) contained in the investigated samples, as shown in Figure 3 and Supplemental1
Figure S1. However, the internal structure of the investigated garnets and the relationships between different phases can be better evaluated using 3D animations, such as the one reported as Supplemental1 Material S6 for sample A1.
The volume of each inclusion was calculated for samples A1, A2, and B (data sets acquired in monochromatic beam mode) using an automated procedure, obtaining histograms of the size distribution of inclusions (Fig. 4). The equivalent sphere diameter was used as a convenient parameter to describe the size of each inclusion. The total number of inclusions detected (limited to
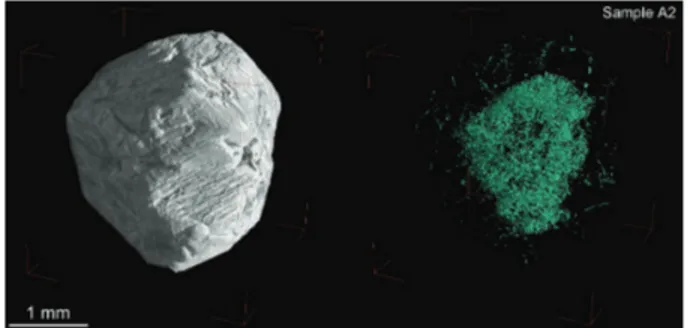
FiGure 3. Three‑dimensional renderings of garnet A2 showing
the entire solid sample (left) and the corresponding melt and fluid inclusion content (right). The latter was obtained using a dedicated image processing protocol and setting the host garnets and all the other non-relevant phases to full transparency.
a maximum size of 50 μm) ranged approximately from 10 000 to 16 000. For all the investigated El Hoyazo garnets, the vast majority of inclusions showed an equivalent sphere diameter below 15 μm, with only a very small number of inclusions larger than 30 μm. These results are in agreement with optical and scanning electron microscope observations carried out on garnets from El Hoyazo, confirming the effectiveness of the adopted segmentation procedure in preserving the correct size of the selected objects.
The 3D spatial distribution and volumetric density (number of inclusions per volume unit) of melt and fluid inclusions was then calculated as a function of the radial distance from the cen-ter of the host crystal, by dividing the volume of each garnet in concentric shells with a thickness of 50 μm (Fig. 5). The center of the distribution was assumed for each sample as the mean of the x, y, and z coordinates of the entire set of inclusions, which was not coincident with the barycenter of the host garnet.
Data analysis revealed in all garnets the occurrence of a clear peak of melt inclusions density, located approximately from 1⁄3 to 1⁄2 of the radial distance from the distribution center for samples
A1 and A2 (Figs. 5a, 5b, 5c, and 5d). In sample B such a peak is located much closer to the distribution center, almost coinci-dent with it (Fig. 5h). A second peak, apparent in the number of inclusions but smoothened in the volumetric density plot, can be identified at a greater distance from the center in sample B (Figs. 5g and 5h). This is related to the presence of at least two smaller garnets, each with its own set of inclusions, coalesced with the main crystal, as can be seen in the 3D renderings of Supplemental1 Figure S1.
For all the investigated samples, no clear evidence of a sharp boundary between inclusion‑rich cores and inclusion‑free rims was found from 3D tomographic data, as opposed to what could be inferred by optical observation of 2D sections. On the con-trary, the decrease in volumetric density of inclusions appears continuous and asymptotically tends to zero (Fig. 5).
Sample A1 was investigated also with a different synchrotron experimental setup based on the use of polychromatic radiation (white beam mode) that, owing to the higher resolution of the detector used and to the higher X‑ray flux available, allowed us to identify a much larger number of inclusions (approximately 150 000). Most of them showed a volume of only 1–2 voxels, indicating that a large number of inclusions, with a size in the order of a few cubic micrometers, were present but not detectable at the level of spatial resolution of monochromatic mode experiments.
Despite such a difference of experimental setup, good agreement in terms of 3D distribution was found between data acquired using monochromatic and polychromatic radiation for sample A1, as shown in Figures 5e and 5f, where the asymptotic decrease of volumetric density toward the exterior of the garnet is replicated in the region of core-rim transition.
The same approach for the separation of light inclusions was applied also to tomographic data acquired with the TomoLab cone-beam instrument for sample C, characterized by a larger size compared to other samples (approximately 5 mm in diam-eter) and greater X‑ray absorption. Despite the lower spatial and contrast resolution and presence of some image artifacts related to the different experimental setup, approximately 8000 inclusions were detected in this case. The histograms of 3D
FiGure 4. Size distribution of the sets of fluid and melt inclusions
contained within the three main samples investigated with synchrotron X‑μCT in monochromatic‑beam mode (samples A1, A2, and B). The width of each bin of the histograms is equal to 5 μm. A significant number of small inclusions were not detected as their size was below the effective spatial resolution of the adopted setup.
FiGure 5. Three-dimensional spatial distribution of inclusions (left: a, c, e, g, i) and volume inclusions density (right: b, d, f, h, j) calculated over concentric spherical shells as a function of radial distance for samples A1, A2, A1 white beam, B, and C, respectively. The higher photon flux and the microscope CCD detector available using the white beam configuration allowed the detection of a much larger number of inclusions (e and f) in sample A1. The end of the horizontal scale is slightly larger than the maximum radius of the garnets.
distribution of inclusions confirm the trends already observed for other samples, showing a continuous decrease of volumetric density from the center outward, with a peak at 1⁄3 of the radial
distance (Figs. 5i and 5j).
The spatial distribution of heavy mineral inclusions (mainly ilmenite, and minor monazite, zircon, and apatite) was calculated for samples A1 and A2 using as a reference point for the calcu-lation of distances the same center adopted for the distribution of “light” (melt and fluid) inclusions, to obtain comparable results. No size restrictions were applied in this case and all the heavy mineral inclusions were considered in the calculation. Heavy mineral inclusions, by far less abundant than melt and fluid inclusions, were more randomly distributed, with no clear relationships with the distribution of the latter, and appeared to be almost absent in the central portion of the investigated crystals (Fig. 6).
The above evaluation of volumetric densities and their evo-lution as a function of radial distance is meaningful as long as garnet crystallization can be approximated by the growth of a sphere, and inclusions are trapped homogeneously throughout the entire overgrowing spherical shells. Should this not be the case, artifacts and fictive trends would be created, and interpre-tive errors could arise. To clarify this point, we can refer, for example, to a garnet containing inclusions homogeneously distributed within an internal cube or a prism, with a step‑like change from the volume containing inclusions and the volume devoid of them. In this case, the calculated volumetric densities within spherical shells as a function of the radius would errone-ously suggest a distribution gradually declining rather than show the actual sharp break. The surface separating the inclusion-free rim from the inclusion‑rich core would be in fact intersected by a series of concentric spherical shells instead of being contained within a single shell.
To overcome this potential problem, since the distribution of inclusions in the studied garnets is evidently not exactly spherical (Fig. 3 and Supplemental1 Fig. S1), the distribution
of melt and fluid inclusions in samples A1 and A2 was also
measured in 300 μm wide square prisms oriented along three mutually orthogonal directions (X, Y, and Z axes of the image stack) and passing through the center of inclusion distribution. Moreover, two other directions in the XY plane (i.e., the plane of tomographic reconstruction) at 45° from X and Y axes were also investigated. Sample B was not considered in this case, due to the presence of coalesced crystals and a more irregular distri-bution. The results are reported in Figure 7 and Supplemental1
Figures S2 and S3 as histograms of the number of inclusions in each 300 × 300 × 25 μm3 (or 300 × 300 × 50 μm3) sub-domain
of the prisms. Compared with the plots for the entire spherical shells of Figure 5, the number of inclusions is lower due to the much smaller volumes, but nonetheless statistically significant, especially for the sample investigated in white beam mode (Fig. 7). Despite slightly larger noise and fluctuations, these pseudo‑1D distributions show a more rapid decrease of inclusions than suggested in the 3D histograms of Figure 5. However, the evidence for a continuous (albeit rapid) decrease of number of inclusions is maintained, and a clear discontinuity marked by an abrupt step-like change is not apparent in any of the directions considered. Only one out of 10 investigated interfaces might suggest a step‑like discontinuity, with a decrease in the number of inclusions per sub-domain from >350 to 0 over a distance of 75 μm (Sample A1, X‑axis, right‑hand side). Conversely, in all the other interfaces the decrease from maxima to zero occurs over distances of at least 125 μm. Such asymptotic decrease of inclusion density is best appreciated in the negative coordinate (left‑hand side) of arbitrary z direction of Figure 7, where the number of inclusions per sub-domain gradually passes from a maximum of >300 to 10 over an interval of about 200 μm. In the interpretation of the histograms of Figure 7, it should also be considered that the pseudo-1D distributions could be highly affected by the intersection of the prisms with regions corre-sponding to original portions of the sample occupied by large mineral inclusions (i.e., plagioclase, sillimanite, biotite), which were not considered at all in the binary data set of inclusions with the adopted image processing protocol. The outer peak FiGure 6. Three-dimensional spatial distribution of heavy mineral inclusions (ilmenite and minor monazite, zircon, and apatite) calculated as a function of radial distance over concentric spherical shells for samples A1 and A2. Heavy mineral inclusions appear more randomly distributed compared to melt and fluid inclusions and almost absent in the central part of the crystals. The end of the horizontal scale is slightly larger than the maximum radius of the garnets.
present in most of the pseudo-1D plots is partly related to the presence of partially filled porosity located along cracks in the outer portion of the garnet crystals.
For the sake of precision and completeness, to verify if some geometric artifacts could arise at the edges of inclusion clusters also on these pseudo-1D distributions, the density of inclusions has been recalculated for two directions in smaller prisms, only 100 μm wide, coaxial with the 300 μm ones (Fig. 8). Despite the much lower number of inclusions and the higher noise related to the smaller volume investigated, the continuous transition as well as the distance over which it develops are maintained. Therefore, we conclude that, unlike the 3D distributions in Figure 5 that are partly affected by geometric artifacts, the data reported in Figure 7, Supplemental1 Figures S2 and S3
are representative of the actual distribution of inclusions at the boundaries between inclusion‑rich and inclusion‑poor volumes of the studied garnets.
Spatial distribution of inclusions: Sierra Alpujata garnets
Garnet samples D1 and D2 were virtually extracted from the entire data set of 13 garnet grains from Sierra Alpujata and individually analyzed, as shown in Figure 9. Thanks to the small size of the two samples (maximum diameter approximately 290 and 225 μm, respectively) very high‑quality images were obtained, in particular using the white beam setup, both in terms of image contrast and effective spatial resolution. This allowed us to detect practically the entire set of inclusions, constituted in this case by crystallized melt droplets (nanogranite) and minor fluid inclusions. The 3D spatial distribution of crystallized melt (and fluid) inclusions was easily calculated for samples D1 and D2 (Supplemental1 Fig. S4). The center for the
calcu-lation of the 3D spatial distributions was chosen as for the El Hoyazo samples. In this specific case, the amount of deviation between the garnet center of mass and the center obtained by averaging x, y, and z coordinates of inclusions was 12.0 and FiGure 7. Distribution of melt and fluid inclusions for sample A1 (white beam mode), calculated within 300 μm wide square prisms, oriented
along the X, Y, and Z directions of the data set and passing through the center of inclusion distribution. The results are reported as number of inclusions in each 300 × 300 × 25 μm3 sub‑domain of each prism. The three semi‑transparent prisms are shown together with the entire set of inclusions in
the 3D rendering. The end of the horizontal scale of the histograms is slightly larger than the maximum radius of the garnets.
b
c
d
13.7 μm for sample D1 and D2, respectively. These values are not negligible compared to the size of the samples and result in a slight change of the shape of the spatial distribution his-tograms. It should be also pointed out that in many situations garnets may appear non‑euhedral, showing irregular shapes due to, e.g., resorption phenomena or non‑spherical growth. As a
consequence, the center of mass of the garnet is not coincident with the crystallographic center of symmetry, which would be another reasonable alternative as an origin point, but not easily determinable.
Considering the very small size of the garnets, the total number of detected inclusions is relatively high (1260 and FiGure 8. Distribution of melt and fluid inclusions for sample A1 (white beam mode), calculated within 100 μm wide square prisms, coaxial with
two of the 300 μm wide prisms of Figure 7. The results are reported as number of inclusions in each 100 × 100 × 25 μm3 sub-domain of each prism.
FiGure 9. Three‑dimensional rendering (right) of the entire set of garnets from Sierra Alpujata, obtained using synchrotron X‑μCT (white beam setup). Two grains (samples D1 and D2) were considered for this study. The entire 3D sets of crystallyzed melt (and fluid) inclusions are rendered in green (left). A garnet crystal from the Sierra Alpujata migmatites with crystallized melt inclusions concentrated at the core is shown in the thin section micrograph.
b
a
502 for D1 and D2, respectively). In both samples, a peak in inclusion number is observed at approximately 1⁄2 of the radial
distance from the barycenter, whereas the maximum density of inclusions is recorded slightly closer to the center. A gradual decrease in inclusion content toward the external portion is observed also in this case, confirming the trend already shown by the El Hoyazo samples. Also in this case, as a consequence of geometrical artifacts related to the non-spherical shape of the distributions (Fig. 9), a certain level of smoothing of the tail of the histogram should be taken into account when the entire 3D data set is considered. Owing to the small size of the samples, the evaluation of pseudo-linear inclusion density along three orthogonal directions, as shown for the El Hoyazo samples (Fig. 7), would not be meaningful in this case, owing to the much lower number of inclusions.
EPMA chemical analyses
Chemical profiles of the distribution of the major elements were carried out on a garnet crystal extracted from rock sample HO-50, by means of EPMA, to evaluate the compositional vari-ability from the core to the outer portions. The attention was focused on the trends of the four main divalent cations of garnet: Mg, Ca, Mn, and Fe. The results (Fig. 10) show no evidence of abrupt discontinuities, with minor variations in the concentra-tion of the considered elements. The largest variaconcentra-tion is shown by the spessartine component, displaying a weak bell‑shaped zoning profile with contents of 6 mol% in the cores decreasing at 2 mol% in the rims. The grossular component is between 2 and 3 mol%, and the XFe ranges from 0.78 in the garnet core
to 0.81 at the rims. These smooth variations may validate the hypothesis of a single‑event growth (Acosta‑Vigil et al. 2010). However, the chemical profiles of major elements could have been partially re-equilibrated by diffusion since the El Hoyazo garnets remained at high temperature for approximately 3 million years between their metamorphic peak and the eruption (Cesare et al. 2003, 2009a; Zeck and Williams 2002).
d
iscussion Methodological approachThe data presented here show that the 3D spatial arrange-ment of inclusions (fluid, solid, and melt) within their hosts can be successfully imaged and quantitatively characterized using X-ray computed tomography, even in relatively highly absorb-ing minerals such as Fe-rich garnets. The access to 3D infor-mation in a non-invasive manner is the main advantage of this approach compared to conventional destructive 2D methods. In the reconstructed data set, glassy inclusions could be sometimes differentiated from fluid inclusions by the human eye (typically in the case of the largest ones), but it was extremely difficult or impossible to reliably segment and separate one kind from the other without introducing unacceptable artifacts. An increase in contrast, and therefore accurate separation, between melt and fluid inclusions (but also voids) based on their different density would be possible using sub‑millimeter samples and a lower energy of the beam. Phase-retrieval processing of tomographic data is also very useful in this regard, at least for the separation of the largest inclusions. However, this was not the main purpose of the present work because the formation of the two types of inclusions can be considered coeval (Ferrero et al. 2011).
Three different experimental setups were tested, both syn-chrotron‑based (parallel beam, with monochromatic and poly-chromatic radiation) and X-ray tube-based systems (cone-beam, with polychromatic radiation), each one suitable to extract useful information about the distribution of inclusions, with different levels of spatial and contrast resolution. Despite the much lower beam intensity compared to the synchrotron beam and a general increase of image artifacts, tomographic experiments carried out with an X‑ray tube‑based instrument allowed investigation of the largest garnets, thanks to the higher mean energy available.
The spatial resolution achievable and the ability to separate phases with similar absorption coefficient represent two key aspects, directly affected by the experimental setup (e.g., detector, beam energy, use of phase-contrast mode). A crucial role is played of course also by the image processing strategy adopted for the separation of phases of interest (e.g., fluid, melt, or heavy mineral inclusions) from non-relevant features (e.g., fractures and large mineral inclusions), which is usually not straightforward and may have dramatic effects on the interpretation of results, especially when quantitative data are required. In the acquired data sets, edge‑ enhancement effects (Fresnel fringes) caused by phase-contrast improved visualization of small scale inclusions within the garnets but had to be carefully eliminated during data processing to extract meaningful spatial information about the inclusions. In this regard, an approach based on phase-retrieval methods proved to be par-ticularly useful to improve image segmentation, although a certain loss of small scale details has to be taken into account. Moreover, phase-retrieved tomographic reconstructions proved to be by far more efficient in the separation of porosity and intermediate gray value large crystals of sillimanite or plagioclase present within the garnets (Fig. 11 and Supplemental1 Fig. S5).
Another critical aspect for spatial arrangement studies is represented by the choice of the center of the distribution of in-clusions, which directly affects the results. The center of mass of the entire host garnet, easy to determine from X‑μCT data, does FiGure 10. Chemical profile obtained by EPMA on a garnet extracted
from rock sample HO‑50, showing the molar fractions of pure garnet end‑members along an almost diametrical line. EPMA analyses were carried out using a Cameca SX-50 electron microprobe at the CNR-IGG, Padova, Italy.
FiGure 11. Tomographic 2D slice (a) along an almost equatorial plane and 3D renderings of different components of sample A1, after
phase-retrieval processing. Melt inclusions are visualized in red together with large crystals of sillimanite and plagioclase (b) and with the semi‑transparent outer surface of the garnet; pores and fluid inclusions are represented in green (c) and heavy mineral inclusions in yellow (d).
not represent the best solution because the shape of the crystals is generally not euhedral and the cloud of inclusions is often clearly shifted from this point. The average x, y, and z coordinates of the entire set of inclusions can be considered as a reasonable origin for the calculation of the spatial distributions. The contribution of localized clusters of inclusions in the outer portions and the presence of coalesced crystal with their own set of inclusions has to be carefully evaluated, to avoid misinterpretation of the results.
Nature of the core-rim transition
The main purpose of the present 3D microtomography analysis was the characterization of the distribution of light melt and fluid inclusions along the core‑rim transition of garnet crystals showing a marked zonal arrangement of inclusions. This microstructural feature can be best assessed by means of the distribution plots calculated along one-dimensional tubes in the 3D cloud of inclu-sions, passing through the garnet centers, which do not suffer from artifacts related to the possible departures from a spherical distribution of inclusions (see above).
The results, in particular those in white beam mode where a much larger number of inclusions could be mapped (Fig. 7), show not only that the core-rim transition is characterized by a rapid
decrease in inclusion density, but also that such decrease from inclusion highs to almost zero occurs in a continuous mode over an average distance of 150 μm. In other words, the change is steep and rapid but not vertical and is in agreement with continuous exponential functions (see below). This is a key observation for a correct interpretation of the microstructures, as it rules out the occurrence of two distinct growth events. Should an inclusion‑ free (or poor) garnet have overgrown an inclusion‑rich garnet, a clear step in an inclusion density profile should be observed in correspondence of the boundary.
A rapid but continuous, rather than discontinuous and step-like, decrease of inclusion density toward the crystal edges is consistent with the absence of clear steps in the garnet zoning profile shown in Figure 10, where the absence of truncations or other relevant variations in correspondence of the transition zone suggests a single, continuous growth event. Therefore, we can infer that a zonal arrangement with inclusion‑rich cores and inclusion‑free rims can be produced in a single—including progressive—meta-morphic event of crystal growth.
Note the important difference between the chemical zoning and the inclusion density profiles: while the former can be modified, especially at high-T, by diffusional processes, the latter remain
virtually untouched as long as the host garnet is preserved. The 3D and pseudo-1D histograms of Figures 5, 7, and 8 also allows discussion of the microstructural distribution of inclusions in the cores of garnets. The distribution plots calculated within prisms indicate the presence of a minimum of inclusion density in the garnet cores. First of all, it should be noted that this aspect cannot be properly evaluated with the pseudo‑1D distributions of Figure 7, as they are based on 300 × 300 μm wide prisms that are too large to provide a realistic representation of the innermost parts of the garnet, where artifacts are necessarily generated for such geometries. In fact, when the histograms for the narrower prisms with 100 μm width (Fig. 8) are considered, the distribution of inclusions in the core region appears to be different and the relative heights of peaks change significantly. Nonetheless, the presence of the density minima at the core of garnets is confirmed also in the 3D plots of Figure 5, and should therefore be consid-ered a real feature. These minima are more or less pronounced, and only in one case (sample B, Fig. 5h) they seem absent. Their occurrence contradicts the common assumption that initial garnet growth should occur at the highest rates. We can suggest a few possible causes, including: (1) the (unlikely) presence of a sub-solidus, inclusion-free core; (2) changes in the availability of melt to be trapped at the advancing surface of garnet; (3) changes in the garnet‑forming reaction causing an increase in garnet growth rate. A definitive explanation of this distribution would require a greater data set and is beyond the scope of this research, but it would be interesting to understand, with future studies, whether this distribution is peculiar of the garnets from El Hoyazo or is common elsewhere.
Causes of inclusion‑rich vs. ‑poor domains in minerals
Although the cause of the inhomogeneous distribution of inclu-sions within the garnet host is not the scope of this research, and more data on more appropriate samples would be necessary for a thorough discussion, we can propose qualitatively a few expla-nations to such microstructure, that appears to be widespread in poikiloblasts from various lithologies and from various settings, both sub- and suprasolidus (Fig. 1).
A prominent core-rim texture such as that observed in the pres-ent case study could be attributed to a multi‑stage garnet growth, such as in the examples described by Konrad-Schmolke et al. (2008) or Klonowska et al. (2017) in which two growth events occur at markedly different P-T conditions. However, the steep but continuous rather than vertical and step-like shape of transition in the inclusion density profiles has allowed to rule out this hypoth-esis, in agreement with the garnet zoning profiles of Figure 10 that point to a single, continuous growth phase. Similarly, we can reasonably exclude overgrowth of different mineralogical domains in a rock (e.g., Waters and Lovegrove 2002), as the inclusion-rich cores have a subhedral to sub‑spherical shape, consistent with a regular growth of garnet over a fairly homogeneous matrix.
Considering a single growth episode, it is possible that the decrease in inclusion density reflects lower quantities of melt available at the boundaries of growing garnet, or a coarsening of the adjacent matrix, or changes in crystallization conditions. Such changes may relate to the type of garnet-forming reaction or to the rate of garnet production during reaction, in turn a function of temperature-time relationships and crystallization kinetics. In the
case of constant melt availability to form inclusions, a decrease of inclusion density is expected to reflect a decrease or drop in garnet growth (Roedder 1984; Barker 1990) by one of the above mechanisms. At El Hoyazo, where garnet crystallized during progression from Ms- to Bt-melting over a temperature interval of almost 100 °C (Acosta‑Vigil et al. 2010), it is likely that growth rate decreased by a progressive reduction of the heating rate, and that less and less inclusions were trapped. Another possibility is that the decrease in inclusion density may reflect a drop in the garnet volumetric growth rate, as suggested by kinetic studies on garnet nucleation. Once garnet nucleates after overstepping, its growth rate should decrease while the system approaches equilibrium. Based on the generalized rate equation (e.g., Pattison et al. 2011) this decrease should be exponential with the decrease in affinity. Once equilibrium is established, then garnet would only continue to grow if the external conditions change, and this is likely to be much slower. In this perspective the transition from inclusion‑rich to inclusion‑poor garnet could mark the time when the system approached equilibrium with garnet. We have no data to quantify the growth rate of garnet and discuss these hypotheses further.
Considering that when inclusions are inhomogeneously dis-tributed within prophyroblasts their preferred concentration within crystals cores (e.g., Fig. 1a) is commonly observed, and not the contrary, one could infer that a slowdown of garnet growth is the common behavior during crystallization in a single event (things can be very different in the case of multi‑stage growth). Therefore, it may be asked whether there is a main general process that can account for such behavior, regardless of the reaction history, given that these textures are so common in so many different contexts.
A simple answer may lie in observing that even under constant nutrient mass supply (i.e., under constant volumetric growth dV/dt, like when filling a balloon with a constant flux of water) the radial increment dr/dt of a spherical crystal is inversely proportional to the square of the radius (Kretz 1973). Therefore, the radial increase must progressively and dramatically slow down, unless the nutri-ent supply to the crystal exponnutri-entially increases with time. The function describing such decrease—constant/r2—is very similar
in shape to some of the abrupt drops marking the transition from inclusion‑rich to inclusion‑poor garnet in Figure 7 and 8. Following Milke and Metz (2002), who showed that in powder experiments the growth rates of grossular decreased with time either with regard to radius, source area, or volume, we propose that porphyroblast growth, in general, does not follow a radial‑constant growth law (the model 1 of Kretz 1973) and that this could be in many cases the geometric explanation to the common occurrence of inclusions at the core of crystals, with their density decreasing progressively in a manner similar to what observed in this study. We believe that this conclusion is in general more tenable than that of Schwarz et al. (2011), who found radial‑constant growth to provide the best match for the data in the study.
i
MPlicationsWe foresee important applications for the study of the crystallization of porphyroblasts (e.g., Huddlestone-Holmes and Ketcham 2005, 2010). As the size of inclusions, especially quartz (e.g., Waters and Lovegrove 2002 in staurolite and garnet from metapelites; Konrad-Schmolke et al. 2008 in garnet from eclogites), can often be 10 times coarser than in our case study,