DOTTORATO DI RICERCA IN
INGEGNERIA ENERGETICA , NUCLEARE E DEL CONTROLLO AMBIENTALE
Ciclo 28
Settore Concorsuale di afferenza: 09 Settore Scientifico disciplinare:ING-IND/11
TITOLO TESI
OPTIMAZE NATURAL VENTILATION AND THERMAL MASS IN
RESIDENTIAL BUILDINGS TO ACHIEVE THERMAL COMFORT AND
REDUCTION OF ENERGY CONSUMPTION IN HOT DRY CLIMATE
Presentata da: Kindah Mousli
Coordinatore Dottorato
Relatore
prof. Vincenzo parenti Castelli Giovanni Semprini
ABSTRACT
Using natural phenomena to reach indoor comfort has been known since early time and the oldest heritage architecture‘s and engineering of Middle East region, which has responded with such phenomena as well very good solutions special for hot-dry region (height temperature and radiation at summer the longest period reverses at winter period. Big swing between day temperature and night also between the hot summer and cool winter). It realized easily inside its houses the optimum comfortable Temperature throughout nearly all the days of the yearlong .That was through equating with the volume adopting and the space taming with the different natural elements forces of the sun, atmosphere, biosphere . . . and climate as all which is common in these days as passive design strategies and reducing energy consumption .
As consequences for all these prefaces and looking at the native engineering civilization seemed obviously that no separation is there between architecture ,engineering , environment’s planning and the adopted human behavior as they are in the old Damascus city especially inside the old historic fence (wall)| as a real example . There, the quarters take almost similar engineering and architectural style in an alive coherence body and homogenous harmony. It receives generally the impacts of the climatic currents and absorbs particularly the heating’s surplus throughout the creation of the integrated texture (thermal mass combine with natural ventilation). If the old city Damascus were as detached in smaller masses as it is now, the outer surfaces were too much increased and exposed to the disturbances of cold- and hot strikes waves either in winter or in summer. That means, each building needs an artificial ventilator at the peak of the hot or /and the lowest cool period. Therefore, the Damascene architects substitute it by generating natural ventilation ways through the nature itself inside house lung (the closed courtyard and cross, stack ventilation related to windows distributions, orientations and areas) instead of the opening outside windows to the streets’ sides in the downstairs.
However the Family inside the rooms can feel with almost sustainable comfortable temperature with the help of social behavior discipline of reducing occupant metabolic of the day mix with the cooling air movement of the normal outdoor atmosphere in the summer nights when the buildings emits the absorbed day heat.
This research investigate the thermal mass and natural ventilation for traditional house(at hot-dry region) that gives high energy efficiency in providing cool indoor air through ventilation ( single sided , cross ventilation) and envelope behavior, with the procedures of measurements combination with simulation program model , to improve Middle East new residential buildings through utilize combination of passive cooling and heating techniques , such as natural ventilation in traditional building couple with effects of massive construction and design assemble to provide thermal comfort (temperature control) over interior condition this strategies are utilized to conserve energy in a hot-dry climate [middle east region as Damascus and other cities which have comfort traditional houses] .
Measuring make up as ASHRAE standard way for temperature and relative humidity to be recorded every 5 minutes to get good indicators, measurements are made parallel with survey (ASHRAE way). Air velocity collected manual corresponded with experiment measurements and survey. The most collected Data is recorded during the hottest summer period of JULY /AUGUST
2014th and the hottest case of the year 2015th for typical summer performance likewise during the
coldest period at December/ January 2015th .
The modern template applied by simulation program for traditional heating and cooling technique to achieves thermal comfort related to occupant behavior and reduce energy consumption for new apartment about 30-45% reduction of energy loading at Damascus cities and for other cities as Cairo from 20-35% also at very hot dry climate as Riyadh cities from 15-30% better than the codes applied at the current late period.
iv
This thesis dedicated to my country Syria.
My parents,
v
DOTTORATO DI RICERCA IN ... i
Ciclo 28 ... i
TITOLO TESI ... i
ABSTRACT ... ii
DEDICATION ... iv
LIST OF FIGURES ... xiii
LIST OF TABLES ... xxv
ACKNOWLEDGMENTS ... 1
CHAPTER 1 RESEARCH OVERVIEW ... 1
1.1
Introduction. ... 1
1.2
Problem Definition. ... 2
1.3
Research Scope. ... 2
1.4
Research Aim and Purpose. ... 3
1.5
Research Methodology. ... 3
CHAPTER 2 Literature review ... 5
2.1
Energy Balance and envelope (thermal comfort). ... 5
2.1.1
Thermal transmission ... 5
2.2
Hot dry climate region (Middle East) characteristic. ... 11
2.2.1
Introduction ... 11
2.3
Thermal comfort. ... 19
2.3.1
Introduction. ... 19
2.3.2
Comfort Model: ... 19
2.3.2.1
Environment parameters: ... 22
2.3.2.2
Condition for thermal comfort:... 23
2.3.2.3
Predication of thermal comfort: ... 24
2.3.2.4
ASHRAE STANDARD 55: Graphic comfort zone
(psychometric-char):
26
2.3.2.5
Thermal non uniform conditions and local discomfort: ... 28
2.3.2.6
Two-Node Model: ... 29
2.3.2.7
The Environment indices: ... 32
2.3.2.8
Adaptive models: ... 33
2.3.2.9
ASHRAE scale sensation (model method): ... 35
2.3.2.10
Graphic Elevated air speed method: ... 36
2.3.3
Evaluation of thermal condition . ... 37
2.3.3.1
Measurement method: ... 38
2.3.4
Survey. ... 40
2.3.4.1
Survey evaluation of comfort in operating buildings. ... 40
2.3.5
Courtyard . ... 43
2.4
Natural ventilation. ... 45
2.4.1
Cross and single side ’stack’ ventilation. ... 46
2.4.2
Natural ventilation in courtyard. ... 48
2.5
Summary of literature review. ... 49
CHAPTER 3 experimental comfort analysis of buildings with internal courtyard ... 50
3.1
The Courtyard Houses In Damascus. ... 50
3.1.2
The Cases Study ... 50
3.1.2.1
Case Courtyard Houses ... 51
3.1.2.2
One Courtyard Houses: ... 52
3.1.3
Instruments ... 53
3.2
Measurements on Summer 2014 ... 54
3.2.1
Instrument Position ... 54
3.2.2
Monitoring schedule ... 56
3.2.3
Data analysis. ... 58
3.2.3.1
Thermal environment’s characteristics. ... 58
3.2.3.2
Thermal comfort . ... 62
3.2.3.2.1
PMV /sensation scale and survey. ... 64
3.2.3.2.2
Adaptive Model. ... 65
3.2.3.3
Summary of measurement 2014. ... 66
3.3
Measurement on winter 2014/2015. ... 67
3.3.1
Instruments ... 67
3.3.2
Monitoring schedule ... 68
3.3.3
Data analysis. ... 68
3.3.4
Thermal comfort. ... 69
3.3.4.1
PMV Scale and survey ... 69
3.3.4.2
Adaptive Model ... 69
3.3.5
Summary of winter measurement 2014/2015th . ... 70
3.4
Measurement on summer 2015
thon Natural ventilation. ... 74
3.4.1
Instruments ... 74
3.4.2
Monitoring schedule ... 75
3.4.4
Summary summer 2015
th. ... 78
3.5
Summary of Measurement 2014
thand 2015
thnatural ventilation. ... 78
3.5.1
Thermal comfort ... 81
CHAPTER 4 Energy modeling and calibration ... 85
4.1
Energy modeling ... 85
4.1.1
Calibrated modeling simulation ... 85
4.1.1.1
ASHRAE calibrate simulation (14-2002): ... 85
4.1.2
Modelling process ... 87
4.1.3
Measurements and Data Collection ... 87
4.1.3.1
Damascus weather data: ... 87
4.1.3.2
Microclimate measurements: ... 88
4.1.4
Calibrated DB Model Simulations ... 88
4.1.4.1
Thermal simulation: ... 88
4.1.4.2
Capability of Dynamic simulation software : ... 88
4.2
Modeling Courtyard ... 89
4.2.1
Model Courtyard as outside zone condition: ... 90
4.2.1.1
Characteristics of the case study ... 90
4.2.1.2
Case : main south hall ... 91
4.2.2
Model Courtyard as inside zone : ... 97
4.2.2.1
Characteristics of the case study: ... 97
4.2.2.2
Calibration steps: ... 98
4.2.2.3
Modeling steps results: ... 99
4.2.3
Summary of modeling analysis ... 107
4.3
Evaluation of Merge between Measurement and Modeling. ... 109
4.3.1.1
Air temperature ( indoor/outdoor)and relative humidity. ... 110
4.3.1.2
Inside Surface temperature. ... 111
4.3.1.3
Pressure Difference ... 112
4.3.2
Thermal comfort. ... 113
4.3.2.1
Psychometric-Chart. ... 113
4.3.2.2
PMV SET, Sensation. ... 114
4.3.3
Thermal Mass... 115
4.3.4
Summary. ... 116
CHAPTER 5 VENTILATION: simulation and effect on comfort ... 125
5.1
Natural ventilation ... 125
5.1.1
Wind Pressure: ... 125
5.1.2
Stack Pressure (thermal buoyancy):... 127
5.1.3
Combining wind and stack pressure effects: ... 129
5.1.4
Air Flow caused by thermal forces (buoyancy): ... 130
5.1.5
Air Flow Caused by Wind: ... 131
5.1.6
Air Flow Caused by Wind and Thermal forces (buoyancy): ... 131
5.1.7
Air exchange Rate : ... 132
5.1.8
Energy transfer by ventilation:... 132
5.1.9
Simulation of Natural Ventilation with Energy Plus: ... 132
5.1.9.1
Ventilation design flow rate: ... 133
5.1.9.2
Ventilation by Wind and Stack:... 134
5.1.9.2.1
Air exchange: ... 134
5.1.9.2.2
Cross Ventilation Model: ... 134
5.1.9.2.3
Model: ... 136
5.2.1
Single side Stack Ventilation ... 140
5.2.1.1
Model case study ... 140
5.2.1.1.1
The first investigation: ... 140
5.2.1.1.2
The second investigation ... 142
5.2.2
Cross ventilation ... 148
5.2.2.1
Model case study ... 148
5.2.2.1.1
The first investigation: ... 148
5.2.2.1.2
The second investigation ... 149
5.2.2.1.3
The third investigation ... 150
5.2.2.1.4
Conclusion... 150
5.2.3
Natural ventilation summary... 150
CHAPTER 6 result and new apartment ... 157
6.1
Optimize new residential apartment at hot-dry climate. ... 157
6.1.1
Optimize envelope materials... 159
6.1.1.1
Modeling data ... 159
6.1.1.2
Optimize insulation position ... 159
6.1.1.3
Optimize envelop materials ... 162
6.1.2
Optimize envelop and function orientation ... 168
6.1.2.1
Optimize orientation ... 168
6.1.2.2
Optimize function direction ... 170
6.1.2.3
Optimize shading device and windows. ... 171
6.1.3
Optimize natural ventilation ... 176
6.1.3.1
Optimize cross ventilation design ... 182
6.1.3.1.1
Without mechanical cooling: ... 183
6.1.3.2
Optimize single side ”stack” ventilation design ... 191
6.1.3.2.1
Without mechanical cooling: ... 191
6.1.3.2.2
Cross ventilation with mixed mode... 191
CHAPTER 7 SUMMARY CONCLUSION AND FUTURE RECOMMENDATIONS 202
APPENDIX A
Arabian-middle east code comparison ... 1
A.1
Damascus HDD/CDD ... 1
A.2
Cairo HDD/CDD ... 2
A.3
Riyadh CDD/HDD ... 3
A.4
Middle East –Arab countries energy Codes for envelope performance . ... 4
APPENDIX B
thermal comfort survey ... 1
B.1
SHORT TIME survey ST ... 1
B.2
LT survey. ... 3
APPENDIX C
cases study ... 1
C.1
BAIT FAKHRY AL BAROUDI ... 1
C.2
BAIT AL MOUSLLI ... 10
C.3
BAIT WARRD ... 15
C.4
BAB AL SALAM HOUSE... 18
C.5
Data analysis ... 20
APPENDIX D
Modeling and calibration ... 1
D.1
Energy plus/DB Heat Balance calculation process. ... 1
D.2
Characteristic courtyard case study modeling input: ... 6
D.3
Calibration steps ... 11
D.4
Evaluation of Merge between Measurement and Modeling ... 18
APPENDIX E
Evaluation of Merge between Measurement and Modeling ... 1
E.2
Cross ventilation ... 3
APPENDIX F
Optimize new residential apartment at hot-dry climate ... 1
F.1
Optimize envelope and materials ... 1
F.2
Optimize envelop and function orientation ... 10
F.3
Optimize natural ventilation ... 20
xiii
Figure 1-1: Research methodology steps. ... 4
Figure 2-1: Thermal losses through the envelope. ... 6
Figure 2-2: Thermal transmittance (integrate building envelope). ... 7
Figure 2-3: Thermal mass (integrate building envelope)... 8
Figure 2-4: different position for radiation angle form one season to another and
different kind of shading devices for summer radiation. ... 8
Figure 2-5: maximum cooling demand for three bedroom as functional of thickness
and position of thermal insulation layer A 10cm concrete. B variable concrete
thickness.. ... 10
Figure 2-6: Clay bricks with PCM macro capsules and Schematic representation of a
concrete roof with frustum holes filled with PCM. ... 10
Figure 2-7: comparison of the cooling demand for the typical outdoor air temperature
day. ... 11
Figure 2-8: The mean annual precipitation for the whole Earth. ... 12
Figure 2-9: a. Damascus weather data climate consultant 5.5 program ASHRAE(
average for 10 years started from 2002),b .year average temperature 2015
thcompare
with average of last ten years . ... 13
Figure 2-10: Cairo weather data climate consultant 5.5 program (ASHRAE). ... 14
Figure 2-11:a. Riyadh weather data climate consultant 5.5 program (ASHRAE).b.
temperature comparison CDD ... 15
Figure 2-12: the energy codes utilized at Arabian Middle East countries. ... 16
Figure 2-13: ASHRAE international climate zone map. ... 18
Figure 2-14: a,The index for metabolism( met )and clothes insulation (clo),b heat
exchange ... 20
Figure 2-15: Constant Skin Heat Loss Line and Its Relationship to toh and
ET*.ASHRAE fundamental chapter 9. ... 22
Figure 2-16: the parameters influence comfort. ... 22
Figure 2-17: Mean Value of Angle Factor Between Seated Person and Horizontal or
Vertical Rectangle when Person Is Rotated Around Vertical Axis (Fanger 1982)chapter
9 ASHRAE handbook fundamental . ... 23
Figure 2-18: a.Air Velocities and Operative Temperatures at 50% rh Necessary for
Comfort (PMV = 0) of Persons in Summer Clothing at Various Levels of
Activity(Chapter9 ASHRAE handbook fundamental) .b. Air Temperatures and Mean
Radiant Temperatures Necessary for Comfort (PMV = 0) of Sedentary Persons in
Summer Clothing at 50% rh(Chapter9 ASHRAE handbook fundamental) . ... 25
Figure 2-19: Predicted Percentage of Dissatisfied (PPD) as function of Predicted Mean
Vote (PMV)ASHRAE standard 55-2010 for thermal environmental condition for
human occupancy... 25
Figure 2-20: ASHRAE Graphic Comfort Zone Method: Acceptable range of operative
temperature and humidity for spaces that meet the criteria specified in Section
.ASHRAE standard 55-2010 for thermal environmental condition for human
occupancy. ... 27
Figure 2-21: Air Speed to Offset Temperatures Above Warm- Temperature
Boundaries of Figure16 (Air speed required to offset increased air and radiant
temperatures).chapter 9 ASHRAE handbook fundamental . ... 27
Figure 2-22: a. Percentage of People Dissatisfied as Function of Mean Air Velocity
Chapter9 ASHRAE handbook fundamental , b. Draft Conditions Dissatisfying 15% of
Population (PD = 15%)Chapter9 ASHRAE handbook fundamental ... 28
Figure 2-23: Percentage of People Dissatisfied as Function of Floor Temperature. ... 29
Figure 2-24: a. Effect of Environmental Conditions on Physiological Variables)
Human respond only to heat stress from the environment, ASHRAE handbook
fundamental , b. Effect of Thermal Environment on Discomfort Human respond to both
heat stress from the environment and the resultant heat strain (Stolwijk et al. 1968).
ASHRAE handbook fundamental. ... 32
Figure 2-25: Recommended Heat Stress Exposure Limits for Heat Acclimatized
Workers [Adapted from NIOSH (1986)]). ASHRAE handbook fundamental.. ... 33
Figure 2-26: Acceptable operative temperature ranges for naturally conditioned spaces
(80% bounds are normative, 90% bounds are informative)..ASHRAE standard 55-2010
for thermal environmental condition for human occupancy ... 35
Figure 2-27: ASHRAE standard 55-2010 Flowchart for Determining Comfort Zone
under Elevated Air Speed.. ... 36
Figure 2-28: Acceptable range of operative temperature and air speeds for the comfort
zone at humidity ratio 0.010.used SET.ASHRAE standard 55-2010 for thermal
environmental condition for human occupancy. ... 37
Figure 2-29: PMV as a function of envelope thermal insulation. ... 42
Figure 2-30: Calendar Albayoumnacha the city of Sanaa, based on comfort planned
for the Olgyay. ... 42
Figure 2-31: The thermal sensation categories subject to the range of indoor air
temperature of each category in naturally ventilated buildings for both seasons of the
study. The thick lines in the boxes represent the median values, the colored boxes cover
the mean 50%of the values and the thin lines show the whole range of all values except
for the small circles indicate outliers of each category. ... 43
Figure 2-32: a.Annual thermal average weather data for Damascus 1975 ,b. indoor
room air temperature calculated for August ground floor ,c. Indoor room air
temperature calculated for January first floor . ... 44
Figure 2-33: a. calculated Indoor temperature with and without natural ventilation at
summer, b. calculated indoor temperature with/without out blind at winter. ... 45
Figure 2-34: The prediction of the maximum indoor temperature (Tmax,In) in August
in a residential building along the Mediterranean coastal plane, as a function of the
thermal mass and night ventilation. ... 47
Figure 2-35: Combined wind and buoyancy-driven ventilation rates through an upper
and lower opening or a single opening: CFD results vs. empirical models.. ... 47
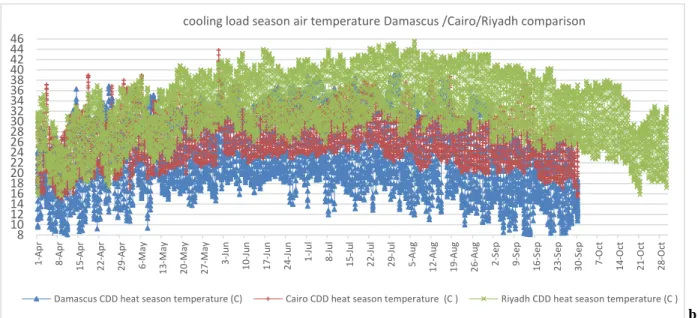
Figure 2-36: Cooling loads comparison... 49
Figure 3-1: Old city of Damascus. ... 50
Figure 3-2:view of Damascus traditional houses cases study ... 51
Figure 3-3: FAKHRY house plan ,a the first period , b.current period ground floor . .... 51
Figure 3-4: weather station position related to cases studied ... 54
Figure 3-5: FAKHRY the first stage measurement , instruments positions. ... 55
Figure 3-6: a1,2. cases halls air temperatures. b.1,2 cases halls relative humidity. ... 62
Figure 3-7: FAKHRY South hall ,a. PMV/ sensation)survey, b. ventilation effect ,c.
Adaptive model part of °C degree. ... 63
Figure 3-8: air flow behavior single side stack ventilation FAKHRY south hall. ... 64
Figure 3-9: FAKHRY .PMV Sensation survey all halls. ... 65
Figure 3-10: a, b,c,d Adaptive Model ,North hall ,Courtyards , 1
stfloor north halls
,West halls. ... 66
Figure 3-11: Elements effective on thermal comfort. ... 67
Figure 3-12: a,b air temperature. ... 72
Figure 3-13: PMV sensation survey for winter period. ... 72
Figure 3-14: Adaptive Model for winter period. ... 73
Figure 3-15: People Dissatisfied as Function of Air Temperature Difference Between
Head and Ankle,winter. ... 73
Figure 3-16: Thermal behavior and comfort for summer and winter period. ... 74
Figure 3-17: . air temperature. ... 78
Figure 3-18: courtyard temperature 2014/2015
th... 79
Figure 3-19: air temperature ... 81
Figure 3-20: survey PMV scale 2014/2015
th, south hall , 1
stfloor north hall and north
hall... 82
Figure 3-21a,b: Adaptive model 2014/2015
th, south hall, the first floor north hall and
north hall. ... 84
Figure 4-1: calibration ASHRAE processing for simulation modeling. ... 87
Figure 4-2: FAKHRY monitoring instruments position .plan, section... 90
Figure 4-3: south hall .weather station data /July-Air temperature ,relative humidity
/close and open case . ... 94
Figure 4-4: south hall .courtyard weather data /July(station)/-Air temperature ,relative
humidity /close and open case. ... 95
Figure 4-5: south hall .station/courtyard weather data /December- Air temperature
,relative humidity /close case/ airflow in/out windows south hall for open windows
period. ... 96
Figure 4-7:a,b. difference between two courtyard roof modeling hole/glass summer,
winter period /temperature, RH, radiation for hole , glass roof cases. ... 103
Figure 4-8: courtyard modeling with shaded space as data logger position and
protection. ... 104
Figure 4-9: Courtyard modeling as data logger protection(shaded) for summer/winter
–temperature,RH ... 105
Figure 4-10: courtyard house PMV modeling /PMV survey sensation for all halls ,
summer/winter ... 108
Figure 4-11: Principle of Natural ventilation: energy balance. ... 110
Figure 4-12: courtyard house ,south hall indoor/outdoor temperature ,RH,inside
surface temperature/close ,open windows and night ventilation for years 2014/2015. . 117
Figure 4-13: courtyard house ,south hall pressure difference indoor/outdoor for close
,open windows and night ventilation cases for years 2014/2015- climate consultant
psychometric-chart. ... 118
Figure 4-14: south hall thermal comfort by psychometric-chart ,adaptive
,survey,SET/open, close, windows and night ventilation for years 2014/2015. ... 119
Figure 4-15: 1
stfloor north hall and north hall, pressure difference, indoor/ outdoor
temperature. ... 120
Figure 4-161
stfloor north hall, north hall comfort: psychometric-chart, Adaptive model
,ASHRAE55... 121
Figure 4-17: 1
stfloor north hall, north hall. Difference comfort standard ,and
SET/survey open, close, windows and night ventilation for years 2014/2015. ... 122
Figure 4-18 : courtyard house all halls, a. thermal mass (heavy/ground floor , light/
first floor )/ temperature /ACH effect ,b . north hall Min and Max temperature /ACH
effect . ... 124
Figure 5-1: Wind pressure difference on building ... 125
Figure 5-2: pressure coefficients ... 126
Figure 5-3: a. Local Pressure Coefficients for Walls of Low-Rise Building with
Varying Wind Direction. ... 127
Figure 5-4: Pressure difference around the neutral plane in a building ventilated ... 128
Figure 5-5: Distribution of Indoor and Outdoor Pressures over Height of Buildin ... 129
Figure 5-6: Compartmentation Effect in Buildings, ashrae fundamental chapter16. .... 129
Figure 5-7: Increase in Flow Caused by Excess Area of One Opening over the other,
fundamental chapter16. ... 131
Figure 5-8: flow patterns through opening in single –sided ventilation DE gids et al
.82... 131
Figure 5-9: Height versus temperature schematic for Mundt model .The constant slope
allows obtaining temperatures at any vertical location using, energy plus engineering
references.. ... 133
Figure 5-10: Schematic representation of room air geometry a) schematic
representation of a room geometry that generates cross ventilation airflow. b) The
proposed model distinguishes two regions in the flow: jet and recirculation (shown here
in a CFD simulation of one half of a symmetrical room).energy plus engineering
references. ... 134
Figure 5-11: p View of the possible airflow patterns in cross-ventilation., energy plus
engineering references. ... 135
Figure 5-12: Differences between flat plate heat transfer and cross ventilation flow.,
energy plus engineering references. ... 135
Figure 5-13: Top view of the flow structure in case R.. The light gray arrows show
flow direction. The dark gray arrows show heat transfer in the shear layer. The
recirculation region coordinate system is shown in the figure, with coordinate varying
between 0 and L.. ... 138
Figure 5-14: Left Schematic View - Room airflow dominated by jetRight . Schematic
- Room airflow -- a combination of jet and recirculation flow. ... 138
Figure 5-15: solar incident at all façade directions. ... 140
Figure 5-16: south hall single side stack ventilation , air temperature, inside surface
temperature/for different cases opening. ... 145
Figure 5-17: south hall single side stack ventilation relation of air change and air
temperature, difference PMV SET thermal comfort . ... 146
Figure 5-18: west hall single side stack ventilation , air temperature, inside surface
,PMV SET. ... 147
Figure 5-19: cross ventilation 1
stfloor north hall air temperature, minimum and
maximum air temperature, inside surface temperature for different cases opening. ... 152
Figure 5-20: cross ventilation 1
stfloor north hall air temperature/ACH light mass and
minimum ,maximum value , PMV SET scale, pressure difference. ... 154
Figure 5-21: second investigation. Cross ventilation ,1
stfloor east hall, air temperature
,inside surface temperature, PMV SET for different cases opening. ... 155
Figure 5-22: third investigation. Cross ventilation, 1st floor north hall, different
opening levels, air temperature, inside surface temperature, PMV SET. ... 156
Figure 6-1: Apartment plan , slab characteristic . ... 158
Figure 6-2: a,b . comparison of Insulation position cases ,[wall: 1without insulation,
2outside .3.inside insulation .4middle. 5.in/out insulation. 6.12cm out. ... 161
Figure 6-3: comparison block/brick walls cases for optimizing envelop materials: the
best performance cases for: a. summer, b. winter period. ... 164
Figure 6-4: shading device Luminance effect for different shading devices. ... 172
Figure 6-5: fixing shading devices... 173
Figure 6-6: Relationships among Airflow
Network objects (right-hand side) and
between AirflowNetwork objects and regular EnergyPlus objects.
An arrow from object A to object B means that A references B ... 177
Figure 6-7: apartment investigation. ... 178
Figure 6-8: a,b .occupant schedule for every zone and Operation schedule for case
study. ... 179
Figure 6-9: windows shape investigation cases. ... 180
Figure 6-10: comparison between traditional materials (measurements) and optimize
materials impact air temperature. ... 182
Figure 6-11: apartment with cross ventilation at hottest summer period August air
temperature. ... 186
Figure 6-12: apartment with cross ventilation at hottest summer period August
psychometric-chart. ... 187
Figure 6-13: heating/cooling energy consumption for Damascus apartment. ... 188
Figure 6-14: heating/cooling energy consumption for Cairo apartment. ... 189
Figure 6-15: heating/cooling energy consumption for Riyadh apartment. ... 190
Figure 6-16: new apartment optimizing design a. cross ventilation, b. single side stack
ventilation. ... 192
Figure 6-17: apartment with stack ventilation at hottest summer period August air
temperature. ... 193
Figure 6-18: apartment with stack ventilation at hottest summer period August
psychometric-chart. ... 194
Figure 6-19: heating/cooling energy consumption for Damascus apartment. ... 195
Figure 6-20: heating/cooling energy consumption for Cairo apartment. ... 196
Figure 6-21: heating/cooling energy consumption for Riyadh apartment. ... 197
Figure 6-22: CFD modeling outdoor air. ... 199
Figure 6-23: PMV/SET Cairo ,Riyadh apartments. ... 200
Figure 6-24: new optimizing apartment comparison cross/stack cooling energy ... 201
Figure 7-1: new optimizing apartment comparison cross/stack energy (Damascus
,Cairo, Riyadh) ... 205
Figure B-2:ST survey ... 2
Figure B-3:LT survey –ASHRAE . ... 4
Figure C-4: FAKHRY roof... 1
Figure C-5: FAKHRY slab structures. ... 2
Figure C-6: FAKHRY timber wall structures. ... 3
Figure C-7: FAKHRY sections. ... 4
Figure C-8: FAKHRY pictures... 6
Figure C-9: FAKHRY a. second stage ,b .third stage instruments positions for summer
2014th .c. instruments positions for wither 2014
th/2015
th,d. summer 2015
th. ... 7
Figure C-10: Mouslli measurements stages instruments positions summer 2014
th, a
.first stage, b .second stage .c. instruments position winter 2014
th/2015
th. ... 10
Figure C-11, a. Mouslli slab structures for floors. b. Mouslli timber wall structure at
the 1
stfloor. c. Mouslli pictures ... 13
Figure C-12: ,a. BAIT WARRD structures . ,b. BAIT WARRD pictures ... 16
Figure C-13: BAIT WARRD measurements , instruments position . ... 17
Figure C-14: BAB AL SALAM HOUSE stone wall structure for ground floor. ... 18
Figure C-16 BAIT FAKHRY ,north hall, south hall air temperature , relative humidity.
... 21
Figure C-17: BAIT FAKHRY 1
stfloor north hall(air temperature,relative humidity),
compare all hall air temperature ... 22
Figure C-18: MOUSLLI all rooms air temperature, relative humidity. ... 23
Figure C-19: BAIT WARRD all rooms air temperature , relative humidity. ... 24
Figure C-20: BAB AL SALAM all rooms air temperature, relative humidity. ... 25
Figure C-21: FAKHRY 1
stfloor North hall,a .PMV/sensation,b .adaptive model,
c.adaptive model for part of degree . ... 26
Figure C-22: FAKHRY .North hall,a .PMV/sensation,b .adaptive model, c.adaptive
model for part of degree. ... 27
Figure C-23: elements effects on thermal comfort summer 2014
th. ... 30
Figure C-24: elements effects on thermal comfort winter 2014/2015
th. ... 31
Figure D-25: Outside Heat Balance Control Volume Diagram ... 2
Figure D-26: Inside heat balance control volume diagram... 5
Figure D-27: a,b. Case study structures input. ... 7
Figure D-28: Case study structures input timber wall, glass. ... 8
Figure D-29: location, occupant, program set up ... 9
Figure D-30: structure. ... 10
Figure D-31: structure and DB natural ventilation calculation. ... 11
Figure D-32: b,Defined Exposure to wind in location normal and sheltered air
temperature, relative humidity/summer, winter. ... 12
Figure D-33: EPW station weather data/ courtyard microclimate. ... 13
Figure D-34: courtyard partitions. ... 14
Figure D-35: courtyard zone 6 air temperature measurement / simulation calibration. .. 14
Figure D-36: south hall, north hall.1st floor north hall air temperature calibration
.fourth week of July . ... 15
Figure D-37: south hall, north hall.1st floor north hall RH% calibration .fourth week
of July... 16
Figure D-38: south hall winter calibration. ... 17
Figure D-39: north hall winter calibration air temperature ,relative humidity . ... 17
Figure D-40: 1st floor north hall winter calibration. ... 18
Figure D-41: 1
stfloor north hall, north hall .temperature, relative humidity. ... 19
Figure D-42: north hall, 1
stfloor north hall .inside surface temperature. ... 20
Figure D-43: difference pressure window, air flow out south hall . ... 20
Figure D-44: south hall air flow in, 1st floor north hall difference pressure
surface/windows ,air flow out -2014-2015 . ... 21
Figure D-45: north hall.1
stfloor north hall. Air flow in/out .2014-2015. ... 22
Figure D-46: south hall , 1
stfloor north hall PMV /SET/survey –open,close ,night
ventilation-2014/2015. ... 23
Figure E-47: south hall single side stack ventilation air flow. ... 1
Figure E-48: south hall single side stack ventilation difference pressure. ... 1
Figure E-49:a,b west hall air flow in/out. ... 3
Figure E-50: 1
stfloor north hall. ... 3
Figure E-51: second investigation, 1st floor east hall, air flow. ... 4
Figure E-52: third investigation, 1st floor north hall, difference opening levels, air
flow, different pressure. ... 5
Figure E-53: courtyard and hall CFD modeling air flow. ... 5
Figure F-54: single block case/ inside face temperature summer and winter period
parameters.. ... 1
Figure F-55: double block investigation cases, , a. summer ,b.winter. ... 2
Figure F-56: natural materials cases , a. summer ,b.winte ... 3
Figure F-57: PCM materials cases , a. summer ,b.
winter. ... 4
Figure F-58: prefabricate materials cases , a. summer ,b.winter . ... 5
Figure F-59: single brick cases , a. summer ,b.winter. ... 6
Figure F-60: double brick cases , a. summer ,b.winter . ... 7
Figure F-61:a, natural materials , b . materials final assessment. ... 9
Figure F-62: east façade deviation analysis, heat transfer and inside surface
temperature. ... 10
Figure F-63: north and west, north façade deviation analysis, heat transfer and inside
surface temperature. ... 11
Figure F-64: west and south façade deviation analysis, heat transfer and inside surface
temperature. ... 12
Figure F-65: optimize façade deviation PMV. ... 13
Figure F-66: PMV/SET scale space function for summer and winter period . ... 13
Figure F-67: a,b. space function for summer and winter period . mean air and operative
temperature . ... 14
Figure F-68: a,b.space function for summer and winter period solar transmitted... 14
Figure F-69: master bedroom shading device investigation PMV/SET ,solar
transmitted... 15
Figure F-70: salon and kitchen shading device investigation PMV/SET ,solar
transmitted... 16
Figure F-71: bedroom shading device investigation PMV/SET ,solar transmitted. ... 17
Figure F-72: fixing shading device investigation PMV/SET ,solar transmitted for
winter period. ... 17
Figure F-73: windows kinds PMV/SET. ... 18
Figure F-74: windows kinds solar transmitted summer / winter PMV/SET , solar
transmitted... 19
Figure F-75: Wind and deviation investigation, salon .ACH, PMV, PMV/SET. ... 20
Figure F-76: Wind and deviation investigation, master bedroom .ACH , PMV/SET. .... 20
Figure F-77: Wind and deviation investigation, kitchen .ACH , PMV/SET. ... 21
Figure F-78: Template for inserting figures into Appendices. ... 21
Figure F-79: Windows shape investigation, salon .ACH , PMV/SET. ... 21
Figure F-80: Windows shape investigation master bedroom, kitchen ,bedroom.ACH ,
PMV/SET. ... 22
Figure F-81: opening percentage investigation .salon airflow behavior ,PMV/SET ... 23
Figure F-82: Template for inserting figures into Appendices. ... 24
xxv
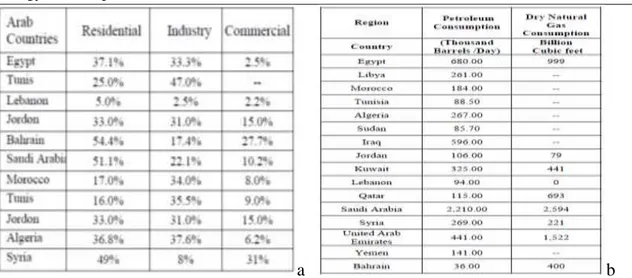
Table 2-1: a. Electricity Consumption for Selected Middle East Arabian Countries, b.
Arabian Energy Consumption 2007... 17
Table 2-2: .different at residential building classification ( low high building three or
four level). ... 18
Table 2-3: Percantage dissatisfied PD due to local discomfort from draft/ASHRAE55.
... 29
Table 2-4: relative air speed .ASHRAE standard 55-2010 for thermal environmental
condition for human occupancy. ... 34
Table 2-5: the acceptability temperature increased by the corresponding Δt
0.ASHRAE
... 34
Table 2-6:Equation for pridecating thermal sensation Y.of men ,women. ... 35
Table 2-7: Acceptable thermal environment for general comfort ASHRAE 55... 36
Table 2-8: international measurement range and accuracy-ASHRAE 55. ... 38
Table 2-9: mean indoor reducing of night time indoor air temperature related to ACH.
... 46
Table 3-1: Omega properties... 53
Table 3-2: Testo properties. ... 53
Table 3-3: summer 2014
thmeasurements schedule. ... 57
Table 5-1: Template for inserting tables ... 127
Table 5-2: south hall opening percentage(single side stack ventilation) investigation
schedule ... 144
Table 5-3: first investigation cross ventilation 1
stfloor north hall, opening area
schedule... 154
Table 5-4: second investigation cross ventilation ,1
stfloor east hall, opening area
schedule... 154
Table 6-1: space apartments distribution. ... 157
Table 6-2: Window wall rate. ... 158
Table 6-3: insulation position investigation cases. ... 160
Table 6-4: optimize envelope materials assessment. ... 165
Table 6-5: orientation and deviation evaluation.. ... 169
Table 6-6: space function analyses. ... 170
Table 6-7: envelop materials cases study with natural ventilation impact . ... 181
Table A-1: Damascus HDD/CDD-ASHRAE fundemental. ... 1
Table A-2: Cairo HDD/CDD-ASHRAE fundemental. ... 2
Table A-3: Riyadh HDD/CDD-ASHRAE fundemental. ... 3
Table A-4: comparison table1 . ... 4
Table A-5: comparison table2 . ... 5
Table A-6: comparison table 3. ... 6
Table A-7: Template for inserting tables in Appendices. ... 7
Table A-8: Template for inserting tables in Appendices. ... 8
Table C-9: a. FAKHRY schedule winter period 2014
th/2015
thb. FAKHRY schedule
summer 2015
th... 8
Table C-10: MOUSLLI measurements schedule ,a .summer 2014
th,b . winter period
2014
th/2015
th. ... 14
Table C-11: BAIT WARRD measurements schedule summer 2014
th. ... 17
Table C-12: BAB AL SALAM HOUSE measurements schedule for summer 2014
th..
... 20
Table D-13: Roughness Coefficients D, E, and F.. ... 4
Table E-14: west hall opening investigation schedule... 2
I am most grateful to God, for blessing me strength, health and will to prevail and finish this work. I wish to thank the following people sincerely for their contribution towards the successful completion of this work,
Prof. Giovanni Semprini, my Supervisor, for his assistance, guidance, support and enthusiasm for this study. His professional guidance has been a source of inspiration and vital in the completion of this work. He offered me insight thinking and challenging thoughts developing my abilities in writing such an academic research, and providing feedback and valuable advice.
I would like to thank Prof. Samir Salloum and Prof. Ghassan Aboud ; their comments helped me in analyzing my data and support me.
I would like to give special thanks to all the people whom gave me a part of their precious time in filling my questionnaire. Lots of gratitude and appreciation for the DIN Department and laboratory at Bologna University
I would like to thank the Faculty of Architecture and my department Implementation and building science, at The Damascus University, Syria, CEDHEC Master for help and whom allowed the study to take place in their buildings.
I would like to thank my lovely friend’s family Hassan and Dima Zmerly for their great effort in support me.
Last, but not least, I thank my Family, whom I could find no words to thank them, for their interest and encouragement in my studies.
RESEARCH OVERVIEW
1.1
Introduction.
The optimization of building design for getting nearly zero energy, which is the one step of passive building, in narrow form of sustainability, this procedure have multivariable problem, which can accept different sets of solutions. The purpose of architect and engineer designer is integrated design to guarantee a comfortable indoor environment and hence to minimize and reduce energy needed for space conditioning. Especially in USA and EU after May 2010, European Union recast the Directive 2010/31/EU on the energy performance of buildings (rEPBD), which states that the new buildings shall be nearly zero energy buildings respectively after December 31, 2018 and after December 31, 2020. After that day all countries try to follow that directive also Middle East countries (Mediterranean area) with varying steps. The optimization aim to minimizing two long-terms seasons (summer and winter) is one of potential paths toward passive and reduction of energy building consumption, starts with design and optimizing the building envelope materials and passive technologies as natural ventilation in free-floating mode. This method is also suggested by USA community ASHRAE Stander Fundamental, 55-2013 and Adaptive comfort model through the Particle swarm optimization algorithm.
The Middle East –Arab countries (Mediterranean area) which is classified hot-dry/humid climate toward that purpose are depending on latest standards and European standard EN 15251:2007.
The oldest heritage housing in hot-dry (arid, semi-arid) climate region represents good engineering solutions to the external climatic conditions, high temperature and solar radiation in summer (which is the longest period respect to winter period) big thermal excursion between day and night (summer and winter), also occupant adaptive and comfort through social behavior.
From previous point of view this research is an effort to revive the traditional housing passive performance (structure materials and natural ventilation) in a modern context, which were traditionally known for their distinctive passive cooling Performance and thermal comfort to achieve thermal comfort and reduction of energy consumption at new residential building for hot-dry regions which one of those regions are SYRIA, EGYPT also very hot climate Saudi Arabia.
One of the typical Syrian houses is at old Damascus city which have courtyard at outside and inside the ancient walls of old Damascus city, consist of two levels: the first represents the ground floor with heavy solid mass (stone), and the second is built over ground floor with light mass (timber structure). This house has different room’s orientation, size, windows distribution and different kinds of natural ventilation. Several monitoring data (air temperature, humidity and air velocity) were acquired during the coldest period in winter 2014/2015th and hottest period in summer 2014th and exceptional very hot summer
2015th, in parallel with occupancy survey The survey results were processed, correlations between thermal sensations and physical parameters, with the help of dynamic computer simulations Design Builder and Energy Plus Simulation program to collect other parameters and optimization process.
The Exceptional circumstances for Arab- Middle East region make this research more important for new residential building and rebuilding from sustainability view, at the same time these circumstances make experimental research so difficult caused by situation.
That gives energy modeling priority in this research to collect and analysis all data to achieve comfort and reduction energy for residential building.
1.2
Problem Definition.
Due to the significance consumption of non-renewable power resources in construction and building sector growing in our countries on large scale, and its increased emissions of SH2, NO2, CO and CO2, with the associated vapors. The decision makers in middle East (Mediterranean area) have associated as other countries, which take into consideration the limitation of non-renewable power resources consumption, in an attempt to develop the construction quality and technologies with its materials and adopt sustainable renewable power construction concepts special for hot-dry climate region which need more cooling load energy for long hot summer period and heating load energy for winter period.
Those countries which have huge rate of urban development and change in building construction sector occurred[in culture the heating or cooling system if it exist they are not continusly ), and this led to huge changes on construction style with had negative impacts mostly in terms of the building interrelation with the surrounding atmosphere because of the various negative concentration of most executors on profits in the cheap buildings architecture special for residential building sector , these made the buildings in most cases far from the environmental interaction known in the traditional degraded houses , which was a successful example on achieve occupant comfort parallel with reduction energy consumption principally by structural materials and natural ventilation kind( cross ventilation , single side stack ventilation ). Up to the previous aspects got the new design its importance to solve the late problems.
Another issue is the adaptive comfort model implemented in the ASHRAE standard 55-2013 is a relation between mean outdoor air temperature and the corresponding acceptable indoor air temperatures. The effect of the standard is limited to the prevailing mean outdoor temperatures ranging from 10 °C to 33 °C, while the mean outdoor temperatures is higher in hot dry climates in summer period. The study of the relation between mean outdoor temperatures and accepted indoor temperatures in hot dry climates may give a wider range than that incorporated in the existing standard .on other hand natural ventilation may expand the range of acceptable temperatures which gives the opportunity for more energy conservation.
1.3
Research Scope.
The research mainly based on residential building in semi and hot/very hot- dry climate at Damascus city in Syria and also as procedure at Cairo in EGYPT and Riyadh in SAUDIA ARABIA for optimization level, at summer hot and very hot dry climate also winter period at the peak of energy consumption over heating and cooling, the outcome of the experimental and simulation evaluation levels represented the traditional houses at two condition with natural ventilation and no natural ventilation in each condition there is no cooling or heating system only depend on passive traditional cooling and heating also the effect on thermal occupancy .
On other hand, optimization and new residential building reduction of energy consumption calculate the outcome and represents two types of building; the first mixed mode(natural ventilation and mechanical system) the other only mechanical HVAC system made for summer period. For winter period the best performance of mechanical HVAC system beside envelope optimization (materials and performance) applied to reach occupancy comfort.
The calibration for temperature and relative humidity step has forced done getting more parameter during exceptional circumstances at study region.
This research focus on only two point from passive design forward to sustainability: thermal mass and natural ventilation to achieve occupancy comfort and reduction energy consumption.
1.4
Research Aim and Purpose.
The aim of this research is to help the promote of energy efficient architectural design for residential building at hot-dry climates for Middle East region to reduction energy consumption by reviving the use of natural ventilation process [summer period] and positive envelope properties as traditional houses in a modern context and urban housing clusters at cities for new and rebuilding. Such houses were traditionally renowned for their distinctive thermal comfort.
The purpose is to develop an accurate thermal simulation methodology for the generated within courtyards that can be combined with building energy simulation software (Energy plus, Design Builder) modeling by comparing it and merge it with measured data from monitoring case studied on some typical Syrian courtyard houses to evaluate the influence of thermal performance of building structures and natural ventilation (cross ventilation, single side ventilation) on the indoor thermal comfort for traditional houses in Damascus old city then investigate other hot dry climate region in Cairo and Riyadh.
1.5
Research Methodology.
The research is divided into five steps Figure 1-1:
The first step is also divided into three steps: 1-Select an indigenous cases studies courtyard houses: Four traditional houses in the old city of Damascus, inside and outside the ancient historical walls, they could be divided into two building types: big houses (two or three courtyards) and small houses (one courtyard).They present two typical floor levels: the first which is the ground floor with heavy mass (stone), and the second with light mass (timber structure).Those houses have different rooms size, windows distribution and different kinds of natural ventilation beside different rehabilitation interventions . Several monitoring data (air temperature, humidity and air velocity) were acquired during a summer and winter period 2014th, in parallel with occupancy survey for the evaluation of comfort conditions to evaluate materials and orientation beside natural ventilation influence on thermal comfort by using Adaptive comfort model, PMV scale and psychometric-chart.
2- Select one case for deep investigation on natural ventilation effect (cross ventilation, single side stack ventilation) at summer period 2015th by several monitoring data (air temperature, humidity and air velocity) parallel with survey to evaluate occupant comfort.
3- This step extend to the latest one, on other hand it is forced step that related to specialty of the year 2015th (as a very hot summer) the advantage of this step is to evaluate the influence of natural
ventilation at high temperature.
The second step: Complementary to the previous step for more parameters data and evaluation , caused by the Exceptional situation for the studied region and the difficulty in instruments availability and monitoring data by time. This step is energy modeling and calibration: generate model of courtyard house using Design Builder thermal simulation software, use weather data for 2014th and 2015th to calibrate
measurements data (air temperature, humidity). This is important step to collect many other parameters and effective factor by merge between measurements and Modeling to complete evaluation of the case study and thermal comfort beside thermal mass.
The Third step is deep investigation in influence of natural ventilation types: cross ventilation, single side stack ventilation through effective opening area position, orientation combine with envelope thermal behavior also influence on thermal comfort.
The fourth step is applied all the recommendations and results (strategies) from previous tasks as modern context for new dwelling and residential building by orientation , envelope materials and thermal mass, windows and shading device integration with ventilation ( cross ventilation, single side stack ventilation), final aspect reduction and energy consumption.
The fifth part is the conclusion: Dissemination of results at other hot dry climate region Egypt also very hot dry climate region Saudi Arabia from energy view and set of parameters to act as guiding for the future thermal investigation.
LITERATURE REVIEW
This literature review covers five basic aspects related to energy performance of residential houses, and courtyards. Previous studies include field of building envelope( energy balance , thermal mass) correlated to passive design and materials choice completed with studies regional codes utilized in the Middle east (Mediterranean area ).Furthermore studies concerned of thermal comfort of occupant and field of measurements and surveys about the passive cooling and heating method of residential courtyards integrate with thermal simulation programs to predict thermal performance of courtyard buildings by calibration procedures for thermal simulations were reviewed. Latest studies about natural ventilation and performance of houses through simulation modeling.
2.1
Energy Balance and envelope (thermal comfort).
General approach and methodology for energy analysis of building envelope is the Energy Balance Equation. In order to analyses energy performances of building for optimizing the building envelope
Figure 2-1
the general energy balance equation can be defined [1992, U.S. Department of Energy]:TRANS VENT RAD
E Q
Q
Q
Where:
E : energy balance
,Q W
TRANS
Q
is the energy transferred by transmission through the building envelope. 𝜚 VENT is the energy transferred by ventilation
𝜚RAD is the energy transferred by radiation (solar radiation from windows and transferred from different opaque surfaces)
2.1.1
Thermal transmission
Two bodies A and B at different temperatures exchange energy in the form of heat until complete disappearance of their difference in temperature(Thermal transmittance (Heat transfer coefficient) Figure 2-2). This exchange
can be done according to three fundamental modes of transmission: conduction, radiation, convection. Actually, any heat exchange is carried out simultaneously under the three modes of transfers (for plate in steady-state condition):
Figure 2-1: Thermal losses through the envelope.
Conduction:
1 2 1 2 / s s s s t t A t t Q k x x kA Convection:
1/ s c s c t t Q h A t t h A Radiation:
/ 1/
r s surr rQ
h A t
t
h A
2 2
r s surr s surr h
t t t tWhere: k thermal conductivity [W/(m·K)] R conduction resistance R= L/(kAc)=∆x/kA. [K/W] Q = heat transfer rate [W]
x = thickness (m) A = surface area (m2).
,ts1 ,ts2 surface temperature for side 1 and 2 °C
where: hc convection heat transfer coefficient [W/(m2·K].
R convection resistance R= 1/(hcA) .[K/W]. Q heat transfer rate (W )
A surface area (m2). ts surface temperature °C t temperature fluid
Where: hr radiation heat transfer coefficient W/m2.K
= 5.67 × 10⁻⁸ W/(m2·K4) is the Stefan-Boltzmann constant. ε is emissivity, where 0 ≤ ε ≤ 1. For a black surface, ε = 1. R radiation resistance R= 1/(hr A) .(K/W).Q heat transfer rate (W)
A surface area (m2).
1 2 3
t
Q
R
R
R
Where:R
1
1/
h A
c ,R
2
x kA
/
,
3 1/ 1/ 1/ 1/ c r c r h A h A R h A h A Q UA tWhere U is the overall thermal transmittance:
1 2 3
1
(
)
U
A R
R
R
(W/m2K) .Optimizing of energy performances of building envelope can be obtained through increasing thermal resistance by using added insulation layers in winter and thermal capacity that give more shift time in summer
Figure 2-3.Moreover, using new materials and technologies as pcm( phase change materials )to integrate the
thermal mass . . . " p p
Q
m c
T
m c
T
q A
Figure 2-2: Thermal transmittance (integrate building envelope).
Q heat exchangers (Thermal Inertia)W
Cp specific heat capacity J/kg.K
q” heat flux W/m2.
Figure 2-3: Thermal mass (integrate building envelope).
Solar radiation.
Solar radiation must be optimist through reducing it in summer and increasing it in winter by generating shading elements(materials , trees)depending on solar radiation angle for every season and sun path and fenestration (materials :kind of glass , solar heat gain coefficient (SHGC) and shading devices Figure 2-4.
Figure 2-4: different position for radiation angle form one season to another and different kind of shading
Solar heat gain coefficient:
/
sol sol
sol sol
opq opq opq opq opq co
SHGC T A N SHGC A N A U h sol T is solar transmittance sol A is solar absorptance
N is flowing fraction for opaque
U
opqhco is the convective heat transfer coefficient.
/ 0.86
s
C
SHGC
Shading coefficient .The building envelope functions as an environmental filter; it forms a skin around the building and controls the influence of the outdoor on the indoor environment. In tall buildings, walls cover more than 90% of the shell and highly influence the indoor environment. Many researches made up optimize building envelope related to insulation and materials for Middle East countries and hot climate region by experimental or simulation method. Below a few examples of those studies. Develop envelope: ( Hong Kong . M. Bojic , F. Yik, K. Wan, J. Burnett.2002) The study includes the model of the base-line characteristics of walls and doors of two typical apartments. The moiled walls have an additional 50 mm thick of thermal insulation and=or a thickness of up to 400 mm of concrete. Modeled doors have an additional 38 mm thickness of thermal insulation. The simulation predictions indicate that the highest reduction in the yearly cooling load could be obtained when the moiled walls and doors were used at suitable locations. In addition, from the predicted results, it was found that providing thermal insulation to external walls of residential buildings in very hot-humid climate regions, which would be air-conditioned primarily in the evening, would not lead to significant cooling load reductions. When the wall is thin, adding thermal insulation could even lead to a small increase in the cooling load. Increasing the thickness of the concrete external walls could also lead to an increase in the cooling load, but a small reduction in load could be achieved when the walls are also insulated
Figure 2-5
.(Gulf. Monna, S. Masera, G. 2014) The study focus on the optimizing of thermal, visual comfort and energy efficiency through the application of different technologies and design strategies for office building envelope in hot arid climate. Building simulation were used to evaluate the effects of different technologies and design strategies on the comfort and energy consumption. The technologies included: glazing performance, shading and solar control, insulation, thermal mass, and daylight systems. In addition, the design strategies included the optimization of: opaque to transparent ratio, orientation, and natural day and night ventilation. The results show the potential for a significant decrease in energy consumption for cooling and lighting. On the other hand, thermal and visual comfort can be increased. Reducing the energy consumption for cooling and lighting as well as improving the indoor comfort are of great importance towards sustainable and climate responsive buildings(this studied in general procedure ) .
Optimize materials: ( Iran. Moulaii , Mahdavinejad , Gheisar,2011) The purpose of this research is to evaluate
the potential usage of a particular, renewable energy options: Smart Materials in hot dry climate. Such exploitation could alleviate, at least in some part, the future environmental burdens. A large-scale assessment has been undertaken with the aim of examining the application of Smart Materials in connection with sustainability and energy efficiency and assesses the optimization of proposed Smart Materials and their products in favor of this region. Experimental research findings are presented, and then analyzed with the purpose of determining the present capability of a significant development of Smart Materials in the hot and dry climatic regions.
Suggestions are then provided to help the improvement of appropriate application and the wider introduction of viable Smart Materials in these regions.
Figure 2-5:
maximum cooling demand for three bedroom as functional of thickness and position of thermal insulation layer A 10cm concrete. B variable concrete thickness..
(Riyadh. A. Eben Saleh 2012)studied the thermal performance of buildings using four different building techniques of hollow clay blocks for building external walls were studied, evaluated and compared with similar building techniques of hollow cement blocks, in the hot dry climate of Saudi Arabia.
(Bortugal. N. Soares, J.J. Costa, A.R. Gaspar, P. Santos .2013) This study investigates how and where phase change materials (PCMs) are used in passive latent heat thermal energy storage (LHTES) systems, and how are these construction solutions related to the building’s energy performance. Studies about the dynamic simulation of energy in buildings (DSEB) incorporating PCMs are reviewed, mainly those supported by EnergyPlus, ESP-r and TRNSYS softwaESP-re tools. The investigation shows that PCM passive LHTES systems can contESP-ribute to (i) increase indoor thermal comfort (air temperature peak reduction, decrease of daily temperature swing, changing in the surface temperature); (ii) improve buildings envelope performance and to increase systems efficiency (insulation capacity, change in heat flow through them, enhancing the thermal capacity); (iii) decrease the conditioning power needed (reduction of the heating and cooling peak loads); (iv) reduce energy consumption; (v) take advantage of off-peak energy savings; (vi) take advantage of renewable sources like solar thermal energy; (vii) save money during the operational phase; and (viii) contribute for the reduction of CO2 emissions associated to heating and cooling
Figure 2-6
.Figure 2-6:
Clay bricks with PCM macro capsules and Schematic representation of a concrete roof with frustum holes filled with PCM.
Develop insulation: gulf .(Elsarrag and Alhorr 2012) investigate the Dynamic facade, using Dynamic