2016
Publication Year
2020-12-23T12:42:24Z
Acceptance in OA@INAF
Antenna pattern measurement with UAVs: Modeling of the test source
Title
Virone, Giuseppe; Paonessa, Fabio; Peverini, Oscar A.; Addamo, Giuseppe; Orta,
Renato; et al.
Authors
10.1109/EuCAP.2016.7481744
DOI
http://hdl.handle.net/20.500.12386/29156
Handle
Antenna Pattern Measurement with UAVs: Modeling
of the Test Source
Giuseppe Virone
1, Fabio Paonessa
1, Oscar A. Peverini
1, Giuseppe Addamo
1, Renato Orta
1, Riccardo Tascone
1,
Andrea Lingua
2, Marco Piras
2, Pietro Bolli
3, Giuseppe Pupillo
4, Jader Monari
41
Istituto di Elettronica ed Ingegneria dell’Informazione e delle Telecomunicazioni (IEIIT), Consiglio Nazionale delle Ricerche (CNR), Torino, Italy, [email protected]
2
Dipartimento di Ingegneria dell’Ambiente, del Territorio e delle Infrastrutture (DIATI), Politecnico di Torino, Torino, Italy
3
Osservatorio Astrofisico di Arcetri (OAA), Istituto Nazionale di Astrofisica (INAF), Firenze, Italy
4
Osservatorio di RadioAstronomia (ORA), Istituto Nazionale di Astrofisica (INAF), Bologna, Italy
Abstract—This paper deals with the electromagnetic
modeling of a dipole antenna mounted on a micro Unmanned Aerial Vehicle (UAV). Such a setup has been recently used as a test source to characterize the radiation pattern of fairly large VHF and UHF antennas in their installation conditions i.e. on the ground, with adjacent elements. In this framework, an accurate modeling of the test source is fundamental to distinguish properly its radiation characteristics from those of the antenna under test. The computed results are verified with both reflection coefficient and pattern measurements showing a very good agreement.
Index Terms— radiation pattern measurement,
low-frequency antenna measurement, Unmanned Aerial Vehicle.
I. INTRODUCTION
The Square Kilometer Array (SKA) is the largest and most sensitive radiotelescope being developed by the scientific community nowadays. The low-frequency instrument of the SKA Phase 1 will consist of a full-digital beam-formed array with more than a hundred thousand elements [1], operating from 50 to 350 MHz. All the elements will be placed on the ground over a metallic mesh and will be arranged in a random sparse configuration with an average separation of about 2 meters. The element size and height are in the order of 1.8 meters [2].
The performance of such array elements should be extensively characterized in the real installation condition in order to both confirm their design and generate useful data for the radiotelescope calibration stage. For this reason, a novel measurement technique based on a flying test source has been developed [3]. The setup mainly consists of a dipole antenna mounted on a micro Unmanned Aerial Vehicle (UAV) and fed by an RF synthesizer. The UAV is able to perform autonomous flights over the array elements. Its position is accurately measured using a differential GNSS system [4].
Several measurement campaigns have already been carried out on both single elements [5] and small subarrays [6], [7], showing very good results in terms of single-, embedded-element and combined array patterns. In [7], the system has
been also used to calibrate a demonstrator array in amplitude and phase. According to the pattern extraction procedure reported in [8], one of the crucial points of the method is the knowledge of the test source radiation pattern i.e. the pattern of the dipole mounted on the UAV for all the operative frequencies. Unfortunately, these important data cannot be easily measured owing to the very low operative frequency (down to 50 MHz). Therefore, as described in this paper, an accurate modeling of the overall test source assembly has been carried out. The computed results have been verified with reflection coefficient measurements of the test source and with pattern measurement in combination with simple reference antennas.
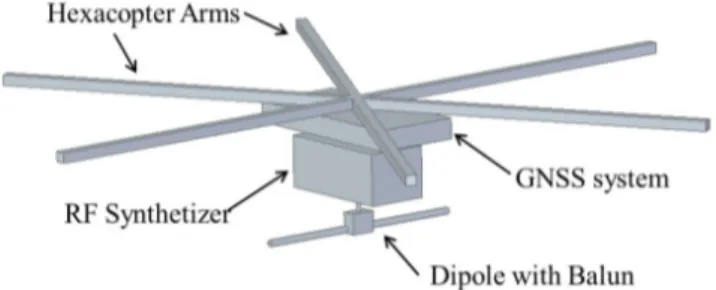
II. MODELING OF THE UAV-MOUNTED DIPOLE The used UAV, which is a custom model based on the Mikrokopter KGPS ver1.0, has several metallic and dielectric parts. The latter are neglected since they are very thin and have a low permittivity. The most significant metallic parts are instead depicted in Fig. 1. The aluminum hexacopter arms exhibit a total length of about 70 cm. The maximum size of GNSS box is about 18 cm, whereas its height is 2 cm. The synthesizer box is 12 x 6 x 5 cm3. The integrated balun is housed inside a 2.4 x 2 x 1.4 cm3 metal package, which is connected to the synthesizer by means of SMA connectors. As
Fig. 1. The six metallic arms of the micro UAV, the RF synthesizer and GNSS system shielded boxes and the dipole with balun.
far as the dipole is concerned, two telescopic monopoles were used in the first version of the test source to be able to adjust the operative frequency [3]. The present version instead consists of a larger set of fixed-length aluminum monopole pairs with a 6-mm diameter. Each pair should be used at the corresponding operative frequency. It has been experienced that this solution is less practical but more stable.
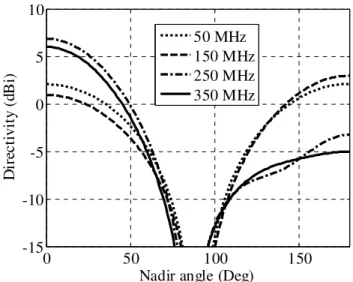
The full-wave analysis of the overall test source yields the E-plane and H-E-plane radiation patterns reported in Fig. 2 and 3, respectively. As expected, the effect of the hexacopter metal parts is negligible at 50 MHz (dotted curve) i.e. the computed pattern of the overall test source coincides to the dipole one. Their size is in fact definitely smaller than the dipole length, which is about 2 meters. At 150 MHz (dashed curve), the dipole length is instead about 0.9-meter long i.e. slightly larger than the hexacopter arms. Therefore, the latter operate as directors producing a slightly higher directivity toward the zenith direction (180 Deg). On the contrary, at the higher
frequencies 250 and 350 MHz (dipole lengths 0.5 m and 0.36 m, respectively) , the dash-dotted and solid lines show that the combination of the hexacopter arms and the various metal boxes operates as a small ground plane. This increases the directivity of the test source toward the nadir direction, which is a more desirable condition in terms of the signal-to-noise ratio of the overall measurement system. It should be noted that all the radiation patterns are very smooth since the structure is still quite small in terms of the operative wavelength.
III. EXPERIMENTAL VERIFICATION
The experimental verification of the test source model has been carried out at all the operative frequencies with both reflection and radiation pattern measurements. For example, Fig. 4 reports the measured reflection coefficient (solid line) for the test source configuration operating at 350 MHz, where the metal parts of the hexacopter have a stronger effect (see section II). It has been measured at the SMA-connector of the unbalanced port of the balun (the reference impedance is 50 Ω). The simulation (dashed line), which has been carried out including the measured S-parameters of the balun (Guanella’s type), shows a very good agreement. The simulation with an ideal balun is also shown with the dotted line. It is interesting to notice that the loading effect of the balun slightly lowers the resonance frequency owing to its inductive effect. It also increases the overall loss level. Unfortunately, the radiation pattern of the test source cannot be directly measured in an anechoic chamber owing to the low operative frequency. Other outdoor facilities or near-field techniques will be considered as future (independent) verifications of the system. So far, the test source pattern has been verified in combination with another reference antenna on the ground. In particular, Fig. 5 reports the measured received
0.05 0.1 0.15 0.2 0.25 0.3 0.35 0.4 0.45 0.5 -16 -14 -12 -10 -8 -6 -4 -2 0 Frequency (GHz) R e fl e c ti o n c o e ff ic ie n t (d B )
Fig. 4. Reflection coefficient of the test source operating at 350 MHz: measurement (solid line), simulation with measured S-parameter of the balun (dashed line), simulation with ideal balun (dotted line).
0 50 100 150 -15 -10 -5 0 5 10
Nadir angle (Deg)
D ir ec ti v it y ( d B i) 50 MHz 150 MHz 250 MHz 350 MHz
Fig. 2. Computed E-plane radiation pattern of the test source.
0 50 100 150 -15 -10 -5 0 5 10
Nadir angle (Deg)
D ir ec ti v it y ( d B i) 50 MHz 150 MHz 250 MHz 350 MHz
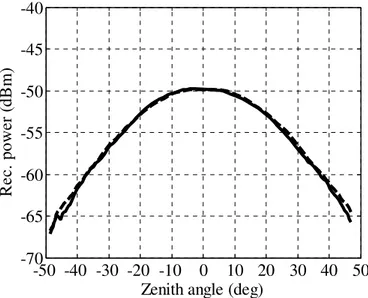
power pattern (solid line) obtained during a quasi-rectilinear flight of the test source over the log-periodic PMM LP-02 placed on the ground (pointed at zenith) at a constant height of about 70 m.It should be noted that the path loss also depends on the zenith angle since the flying height is almost constant. The bearing (compass) angle of the test source was selected in order to match the polarization of the reference antenna on the ground (co-polar orientation). The test source path was defined in order to perform an E-plane scan. Fig. 5 also reports the simulated received power pattern (dashed line) [3] which is mainly proportional to the test source pattern, the reference antenna pattern and the path loss. The two curves are in good agreement. The maximum discrepancy is about 0.5 dB. It means that the combination of all the simulated contributions i.e. test source and reference antenna patterns, path loss (computed from the relative distance measured with the GNSS), source power and cable losses is consistent with the
measured data in the angular range of about ±50 deg from zenith.
ACKNOWLEDGMENT
The authors thank Augusto Olivieri (CNR-IEIIT), Irene Aicardi, Paolo Maschio, Iosif Horea Bendea (Politecnico di Torino, DIATI) for their technical support and Gruppo Aeromodellistico “Volare su Tetti” for providing the measurement field.
REFERENCES
[1] https://www.skatelescope.org
[2] E. de Lera Acedo, N. Razavi-Ghods, N. Troop, N. Drought and
A. J. Faulkner, "SKALA, a log-periodic array antenna for the SKA-low instrument: design, simulations, tests and system considerations," Experimental Astronommy, DOI: 10.1007/s10686-015-9439-0.
[3] G. Virone, A. M. Lingua, M. Piras, A. Cina, F. Perini, J. Monari,
F. Paonessa, O. A. Peverini, G. Addamo, and R. Tascone, “Antenna pattern verification system based on a micro Unmanned Aerial Vehicle (UAV),” IEEE Antennas and Wireless Propagation Letters, vol. 13, pp. 169-172, Jan 2014.
[4] M. Piras, G. Marucco, K. Charqane, “Statistical analysis of different
low cost GPS receivers for indoor and outdoor positioning”, Position Location and Navigation Symposium (PLANS), 2010 IEEE/ION, pp. 838-849
[5] F. Paonessa, et al. “UAV-based pattern measurement of the SKALA”,
International Symposium on Antennas and Propagation and North American Radio Science Meeting , 19-24 July 2015, Vancouver, Canada
[6] G. Virone, et al., “UAV-based radiation pattern verification for a small
low frequency array,” IEEE International Symposium on Antennas and Propagation and USNC-URSI National Radio Science Meeting 2014, July 6-12 2014, Memphis, Tennessee, USA.
[7] G. Pupillo, et al., “Medicina Array Demonstrator: calibration and
radiation pattern characterization using a UAV-mounted radio-frequency source,” Experimental Astronomy, pp. 1-17, Apr. 2015.
[8] G. Virone, F. Paonessa, O. A. Peverini, G. Addamo, R. Orta,
R. Tascone, and P. Bolli, “Antenna pattern measurements with a flying far-field source (Hexacopter),” IEEE International Conference on Antenna Measurements and Applications, November 16-19 2014, Antibes Juan-les-Pins, France.
-50 -40 -30 -20 -10
0
10 20 30 40 50
-70
-65
-60
-55
-50
-45
-40
R
e
c.
p
o
w
er
(
d
B
m
)
Zenith angle (deg)
Fig. 5. E-plane received power pattern at 350 MHz, which is proportional to both the test source and the antenna-under-test patterns: measurement (solid line) and simulation (dashed line).