2017
Publication Year
2020-09-16T09:39:35Z
Acceptance in OA@INAF
Advancements in ion beam figuring of very thin glass plates
Title
þÿCIVITANI, Marta Maria; GHIGO, Mauro; HoByszko, J.; VECCHI, Gabriele; BASSO,
Stefano; et al.
Authors
10.1117/12.2275555
DOI
http://hdl.handle.net/20.500.12386/27401
Handle
PROCEEDINGS OF SPIE
Series
10399
Number
PROCEEDINGS OF SPIE
SPIEDigitalLibrary.org/conference-proceedings-of-spie
Advancements in ion beam figuring
of very thin glass plates
Civitani, M., Ghigo, M., Hołyszko, J., Vecchi, G., Basso,
S., et al.
M. Civitani, M. Ghigo, J. Hołyszko, G. Vecchi, S. Basso, V. Cotroneo, C. T.
DeRoo, E. D. Schwartz, P. B. Reid, "Advancements in ion beam figuring of
very thin glass plates," Proc. SPIE 10399, Optics for EUV, X-Ray, and
Gamma-Ray Astronomy VIII, 103991E (21 September 2017); doi:
Advancements in ion beam figuring of very thin glass plates
M. Civitani
1a, M. Ghigo
a, J. Hołyszko
a, G. Vecchi
a, S. Basso
a, V. Cotroneo
b, C. T. DeRoo
b, E. D.
Schwartz
b, P. B. Reid
b(a)
INAF Astronomical Observatory of Brera, Via E. Bianchi 46, I-23807 Merate (LC), Italy
(b)
Harvard-Smithsonian Center for Astrophysics, Cambridge, United States
ABSTRACT
The high quality surface characteristics, required on the mirrors of a high angular resolution x-ray telescope, are challenging but well suited to a deterministic and non-contact process, like the ion beam figuring. This process has been recently proven to be compatible even with very thin (thickness around 0.4mm) sheet of D263 and Eagle glasses. In the last decade, these types of glass have been investigated as substrates for hot slumping, with residual figure errors of hundreds of nanometres. In this view, the mirrors segments fabrication could be envisaged as a simple two phases process: a first replica step based on hot slumping (direct/indirect) followed by an ion beam figuring which can be considered as a post-fabrication correction method. The first ion-beam-figuring trials, realized on flat samples, showed that the micro-roughness was not damaged but a deeper analysis was necessary to characterize and eventually control/compensate the glass shape variations. In this paper we present the advancements in the process definition, achieved on slumped glass samples.
Keywords: X-ray grazing-incidence telescopes, ion beam figuring, deterministic correction, X-ray segmented mirrors,
hot slumping, Eagle, D263
1. INTRODUCTION
The realization of high throughput x-ray mirror assembly is based on the combination of two main ingredients: a large effective area and a high angular resolution. The first can be achieved by reducing the thickness and density of substrates, while the second by requiring high mirror quality. As the two factors usually act in opposite directions, different techniques are being investigated for the mirror production and their assembly. The hot slumping of thin glass plates (with thickness of the order of 0.4mm) is one of these techniques and it has been studied to shape thin glass plates directly in Wolter-I configuration with direct or indirect process (1,2). This replica process has several advantages: it is cheap and high reproducible results are expected once the process is established. The best results achieved so far are mirrors compatible with an intrinsic HEW of few arc seconds, making a post facto correction indispensable for further improvement: these slumped thin glasses are investigated as a good substrate for adjustable x-ray optics (3) or have been used as substrate for cold slumped optics (4).
Given that the samples are very thin and deformable, the implementation of corrective techniques acting directly on their surface is difficult. A non-contact and deterministic figuring technology (dependent on dwell time), like the ion beam figuring, can be the solution to correct the residual errors, as it is immune from all the problematics derived by the interaction of the figuring equipment and the handling and supporting systems.
1 Corresponding author: marta.civitani@brera.inaf.it; www.brera.inaf.it
Optics for EUV, X-Ray, and Gamma-Ray Astronomy VIII, edited by Stephen L. O'Dell, Giovanni Pareschi, Proc. of SPIE Vol. 10399, 103991E · © 2017 SPIE · CCC code: 0277-786X/17/$18 · doi: 10.1117/12.2275555
Figure 1: A simplified process for high angular resolution x-ray optics realization. The hot-slumping process (direct or indirect) of thin glass plates is followed directly by the ion beam figuring of the plates.
The feasibility of the process was evaluated on thin flat samples of Eagle and D263 glass with very encouraging results. The removal rate and the removal function shape have been characterized: first trials of figuring have been operated showing that the micro-roughness is conserved independently from the amount of material removed. The comparison between the thicknesses measured before and after figuring has been used to validate the effectiveness of the process in terms of removed material. It has been evidenced that D263 glass shape was distorted in the process (probably due to the stress release of this tempered glass), while this drawback was not observed in Eagle within the limits of the measurement capabilities (5). Choosing opportunely the glass substrate material, the IBF can be the final step of a simple mirror production chain based just on hot-slumping and ion beam figuring process (see figure 1) with two main caveats:
- It should not introduce unpredictable deformations in the substrate.
- The micro-roughness of the figured surface should remain compatible with x-rays requirements.
In this paper we present the first results obtained on slumped glasses provided by SAO, showing that the process is suitable for the realization of high throughput x-ray mirror with few nanometres Root Mean Square (RMS), compatible with final HEW well below 1 arc second. In paragraph 2, the characteristics of the samples used and the configuration used during the tests are summarized. The paragraph 3 reports on the metrological results achieved on the samples, while in paragraph 4 are presented the simulated results achievable on slumped glasses, which can be easily realized with the current status of SAO slumping technology.
2. MEASUREMENT CONFIGURATION FOR CILINDRICAL SAMPLES
One of the main aspects to evaluate the process feasibility is its ability to effectively correct the shape of the glass without side effects (such as induced stress or stress release), which change in unpredictable way the shape of the glass itself.
Figure 2: (A) The measurement set-up for the glass plate figure errors available at SAO. The interferometer beam is adapted to the cylindrical geometry with a CGH system. (B) The glass plate is supported on two points on the bottom and one on the top back.
The CUP metrology, used to characterize the change in shape of flat samples, is inappropriate to the target of the ion beam figuring process, which foresees typical figure errors well below 50 nm rms. The interferometric set-up, available at SAO has been used to measure the slumped glasses as well as their shape after correction with actuators. It is based on a 4D Technology FizCam 3000 interferometer equipped with a computer-generated hologram (CGH) to adapt the wave front to the cylindrical shape of the glasses. A thin layer of gold (40 nm thick) is deposited on the optical surface of the glass to allow the measurement. A supporting system for the glass with two points on the bottom and one on the top is used to hold the glass sample during the measurement (see figure 2). The accuracy of this metrological set-up, better than 30 nm rms, is much more suitable than the CUP profilometer to highlight the changes in shape of the figured sample as long as they are measured before and after the figuring process in the same configuration.
3. SAMPLES EMPLOYED AND ION BEAM CONFIGURATION
The list of the samples employed for the tests is reported in table 1. They are made of Eagle glass, slumped in cylindrical configuration and cut to a size of 100 mm x 100 mm. The samples were realized during a first stage of slumping development at SAO and have a large figure error compared to the aim of the project, however they are representative of what can be obtained with a simple thermal forming procedure on low-quality mandrels (considerably cheaper than well figured ones). The first sample (S04) has a larger radius of curvature (1 m), while for the other two the radius of curvature is 220 mm. The sample (S04) has been used for testing the set-up by removing a uniform layer of 100 nm. The following two samples have different quality: sample S10 has an important figure error well outside a realistic operational range of the ion beam figuring while the starting quality of sample S22 is in a good operational range. Therefore the two samples had to be used for testing the repeatability of the glass shape variations (if any), after the application of the same correction. Due to an accident during handling, the best glass, S22, was broken. Therefore the remaining glass has been figured following the initial figure error map, but scaled down to values compatible with a figuring duration of few hours.
The left side of figure 3 shows the back surfaces of S10 and S22: the marker traces on this surface were traced during slumping development and follow figure errors. They have been used to align the measurements acquired in transmission mode with the interferometer to determine the thickness variation. Moreover they are a useful reference for the figure error positions. Instead, the low-stress gold coating, applied on the optical surface for metrological purposes, has been removed with soap before the ion beam process. The right side of figure 3 reports the ion beam configuration, with the glass simply placed in three slits made with bolts.
A piston of 100 nm has been removed from the surface of sample S04: in this condition the maximum temperature acquired on the backside of a sample (in top-central position) was 98 °C, well below the transformation temperature of the glass (see figure 4 left side). The figuring lasted around 3.5 hours. The temperatures recorded of the figuring of S10 glass are shown on the right side of figure 4: the Peak To Valley (PTV) of the map was around 1.2 microns, mainly concentrated on the sides. In this case the maximum temperature was lower and around 53 °C.
The main ion beam configuration settings have been chosen based on past experience (5). The removal rate is independent on time and position and it was calibrated by means of a static figuring of 30 min with 5 Watt of power, resulting in a removal rate of 1,5nm/sec at the peak of the removal function. The working distance was around 36mm from the source and the figuring was realized in horizontal lines from top to bottom. The FWHM of the gaussian fit is 8.4 mm.
Table 1: Glass samples configuration
RoC Size PtV of figure error Activity Duration
S04 1 m 100 mm x 100 mm 4 microns Piston (100 nm) 3.5 hours
S22 224 mm 100 mm x 100 mm 1.5 microns Broken during handling
S10 224 mm 100 mm x 100 mm 30 microns 1/30 initial error maps
(223 nm rms)
100 90 80 70 a á 60 ai 50 40 30 2%
Temperature acquired on the glass ax = g7.8248 Thermocouple 804 Run01.txt
-Refl
-Ref2
-Ref3
0.5 1 1.5 2 25 Time (Hours) 3 35 55Temperature acquired on the glass 50 -U 2 45 a) Q ai 40 Thermocouple S10 RunOl.txt
-Refi
-Ref2
-Ref3
.-Max =Figure 3: (Left) The initial status of the glasses: a low-stress gold coating is applied for metrology on the optical side and removed before the figuring, while on the back side marker traces show the main slumping error patterns. (Right) The ion beam configuration with the glass fixed in three thin slits.
Figure 4: The temperature evolution, as recorded by the thermocouple on the backside of the glasses, during the figuring process
4. RESULTS 4.1. Uniform removal
The accuracy of the figuring process can be evaluated comparing the measurement of the thickness and of the figure error before and after the process. The thickness variation maps have been acquired with ZYGO interferometer at INAF/OAB. On the left side of figure 5 the maps corresponding to the ‘uniform’ figuring on sample S04 are shown. On the top panel the overall variation after the removal of a piston and tilt from the data is reported. The statistics of the two thickness variation maps confirms the similarity: an RMS of 323 nm and 330 nm (with PTV of 1637 nm and 1744 nm) correspond to the two maps, with 100 nm of material effectively removed from the surface. On the bottom panels of the same figure, the two data maps have been analysed removing the Zernike polynomial up to the astigmatism to highlight higher frequency errors, confirming their pretty similar pattern.
The difference between the two maps (see right side of figure 5) provides further insight on the process. The vertical modulation is an artefact due to the two glass surfaces reflections. The pseudo cylindrical symmetry could arise from the
Aligned maps: Cfa SO4
io
5(:30
20 10 0 at-500 0 -500 300 200 100 0A
Overall Difference 0Difference (Piston & Tilt removed)
1
1
50 100 50 E 0 E -50 -100 before -40 -20 0 20 X (mm) 40 1.6 100 0.8 0.0 50 -0.8 _ 0 E -1.6 -2.4 -3.2 -4.0 -50 -100 after -40 -20 0 20 X (mm) 40 difference 1.6 100 0.8 0.0 50 -0.8 _ 0 E -1.6 -2.4 -3.2 -4.0 -50 -100 -40 -20 0 20 X (mm) 40 0.20 0.15 0.10 0.05 0.00 -0.05 -0.10 -0.15 -0.20removal function variations in dependence of the incidence angle. The PTV of this cylindrical trend is around 100nm. This is a point that should be carefully evaluated as long as the radius of curvature decreases.
The resulting variation in glass shapes is shown in figure 5. On the left, the initial error map is shown, while the one acquired after the figuring process is reported in the centre with the same colour scale (in microns). Their similarity is evident and it is confirmed by the difference, reported in the right panel. The difference in the central area (60 mm x 60 mm) is 60 nm RMS. This result has to be considered really encouraging. A dedicated study of the repeatability for the metrological set-up should be planned in order to have a clear assessment of the contributions from different aspects like glass repositioning, coating etc.
Figure 5: Thickness variations maps as acquired with the INAF/OAB Zygo interferometer on the central 100mm diameter area of the glass plate (sample S04) before and after a ‘piston’ figuring of 100 nm. Maps on left panel show surface data before and after the figuring (maps without astigmatism are shown on bottom). Difference is shown on right panel. All units are in nm.
Figure 6: Figure errors maps as acquired with interferometric set-up at SAO. On the left the error map before the uniform removal with the ion beam figuring. In the centre the error map acquired after and on the right the difference (Colour scale are in microns).
2_ 4(5 2_ 40 OAB1S10 1mm 800 600 400 200 -200 10 20 30 40 50 60 70 80 90 100 20 40 60 80 100 100 50 0 -50 -100 Overall Difference 1000 500 0 -500
Difference (Piston & Tilt removed) 600
400
200
4.2. Figuring results
As anticipated, the initial error map of sample S10 has been scaled down in order to obtain a ‘ad hoc’ correction map compatible with an ion beam figuring of few hours. This correction map (222.9 nm RMS) is reported on the left side of figure 7 and shows both azimuthal and longitudinal errors. The same error map after the removal of the azimuthal error is reported on the right side of figure 7. The different features, which characterize the sample, can be used to verify the good alignment between the input data and the figuring set-up.
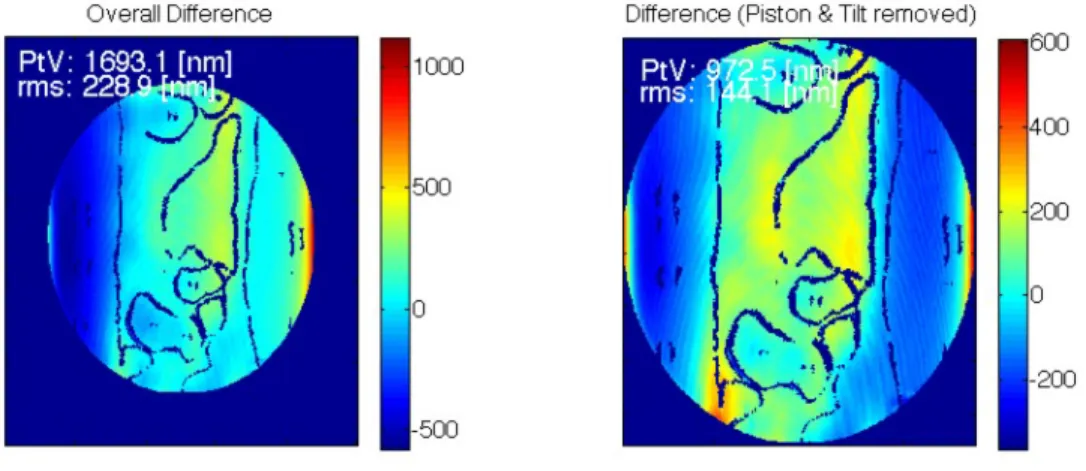
The thickness variations of the samples has been measured with the ZYGO interferometer at INAF/OAB. The difference between the initial and the final status is reported on left side of figure 8, with a corresponding RMS equal to 228.8 nm. There is a clear trend from the left to the right of the surface. As the figuring of this sample has been realized in vertical columns, it can be due to a drift of the source. Normally, this kind of effect is not visible during the machining, as it is automatically removed with the piston and tilt removal usually applied to all the interferometer maps. Therefore, this effect can be used as useful general trick to enhance the process control. After the removal of piston and tilt (see right side of figure 8), the RMS of the difference decreases to 144.1 nm, to be compared with the 178.7 nm RMS foreseen in the same circular area of the corrective map.
Figure 7: Input error map obtained from the initial error map of the S10 glass sample and linearly scaled down to get an error of the order of 230nm RMS with an expected figuring time of few hours: on the left the overall error, while on the right after the subtraction of the azimuthal contribution.
Figure 8: The difference in sample thickness measured before and after the ion beam figuring on a 100 mm diameter aperture: on the left the overall difference shows a clear trend in the left-right direction, on the right the removed material discarding the tilts (marker traces observable in transmission mode) on the back side of the sample have been used to align the acquired data.
73.3728 20 40 60 80 150 100 50 0 -50 -100 -150 100
Residua [Micron]: OAB1S10 nocoatl
[mm]
[mm]
Patch of Line Fit
Residua [Micron]: OAB1S10 runl 4
-5 Patch of LineFit -20 -25 -30 [mm] -50 [mm]
Figure 9: The difference between the target figuring map and the removed material as derived from thickness measurement differences.
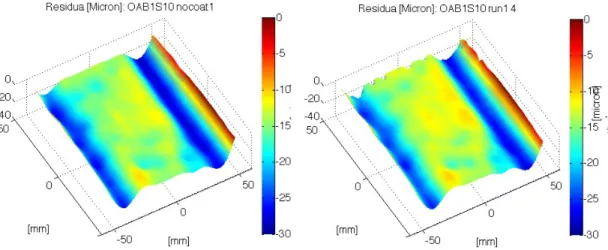
Figure 10: Residual map as acquired with the CUP before and after the IBF on the sample.
The input error map (left side of figure 7) and the map of the actual removal (right side of figure 8) are fairly similar, but a more detailed feedback can be derived from the difference of the two, reported in figure 9. This difference represents the error in the figuring: it records the difference between the amount of material effectively removed and the target without considering the deformations error. The RMS of the difference is 73.4 nm RMS, which corresponds to a convergence factor of 2.5 with respect to the desired corrective map. The high frequency waviness is an artefact of thickness measurement. Instead, thanks to the marker pattern remained on the back surface and in principle aligned with the figure error, it is possible to see that a better convergence factor should be possible with a tighter control on the alignment/projective errors. The difference cannot be reduced simply scaling down the removed material in the overall area: this excludes a wrong estimation of the removal function. Instead, the asymmetry on the left-right side suggests that the source drift needs a better control. Moreover, the characterization of removal function in dependence on the incidence angle should be carefully evaluated: on the sides of the sample the surface angle is around 15° with respect to the source for a radius of curvature of 220 mm as in this case.
The data acquired with the CUP at INAF/OAB before and after the ion beam on the bare glass (coating already removed) are reported in figure 10. The best-fit radius is the same (224.4 mm) with the same overall residual error shape. The colour scale is the same. This preliminary qualitative result is quite encouraging and we expect will be numerically confirmed by the interferometric measurements @SAO that at the moment are not yet available.
. MFT 1 ini[MIFT 10x101 10x Avg100 eoa 700 600 500 ó400 300 200 100 200 a00 600 800 1000 pMaon) 2 05 0 -05 -1 -15 -2
MFT:3 efter BFMIFT 10x/11 10x Avg100 eo0 700 600 500 ó 400 300 203 100 200 400 600 800 1000 [Micron) 2 5 05 0 -05 -1 -1 5 -2 15 1 :005 05 -1 -15 L , MFT2run01MewVIew510-1eft. 5 MFT 2run01MewView51(}cen[er. , 10'0 100 100 0' 10p PSD Evolution
/Users /civitani /Documents /MFT Data /Output PSD/
Slope =1.05, Norm =30.0
--
anODavneniYRayira<myRrop2mm0ionbeam0ponnyibmGUSVEapie/SivnpedC4/C40o8iS22/-
anODavneniYRayira<myRrop2mm0ionbeam0ponnyibmGUsvEapie/SivnpedC4/C40o8iS0al-
anODavneniYRayira<myRrop2mm0ionbeam0ponnyibmGUSVEapie/SivnpedC4/C40nEIS10l- /DserY<rvnanODavneniYRayira<mryRroprzrrmYion beam IpunnryinmGUsvEapie/Sivnped C4/C4 OoBi SO4l
100 10 10'
[micron]
100 10° 105
4.3. Micro-roughness evolution
Due to the limited number of samples, to the handling mechanical difficulties and to the interferences between the samples and the measurement instruments, the characterization of the samples with respect to the micro-roughness evolution is not complete. Few measurement points with MFT 10x (ref) and with New View 20x have been acquired before and after the IBF not always on the same sample and in the same position. Therefore, the data acquired should be considered a preliminary assessment on the surface quality of the optical surface, well adapted to highlight major problems of the technique.
In figure 11 are reported the images acquired on S10 sample (flat piston removal) as acquired by the MFT on the millimetre scale. Some pits are present on the surface after the IBF, but they are visible also in the initial maps. Nevertheless the measured RMS changes from 0.8 nm to 0.5 nm.
In figure 12 are shown the New View maps, on 300 microns scale, on two different samples. The surface of S22 glass, where no IBF has been carried out is around 0.3 nm RMS and characterized by holes around 5nm deep. Instead the measurements acquired on the surface after the IBF on sample S10 are around 0.5 nm RMS independently on the azimuthal position where they have been taken.
Figure 11: MFT 10x maps acquired on the corner of S10 glass before and after the IBF process.
Figure 12: New View 20x maps as acquired on the S22 (no IBF) and on the S10 glass after the IBF, in three different azimuthal positions (left, centre and right)
Figure 13: PSD of the data acquired on the different samples: in black data relevant to slumped glass after the coating removal and in blue the data for glasses after the IBF.
SCALE WITH PIXEL - ION BEAM FIGURING SIMULATOR V 4.1.1 By Insomnia)
Fie Wad save matrix Removal functionNew Mme Matrix OptimizationAlgorithms setup New 3o Tools Stitching SLpComp
UUL
0.9121922_1 _dopo holeslessup
PF darn Hfmml 2gg PFdam" fmml 29] PF2vYfmml 36
HSie imp) I 1128 Talget PMSSm) TO Nawfiladolo Sampling X Immll 1.9191
00 2965 15929
Show RAW data )only
r Ino old Mat 01001
X - nth r Normal profile r Free profile f Save profile r Save profies( 2965 00
f 16 Coln Palette f 02W Palette O Colnpalette
mr-F Load Me and set the data to a piston of n nome ers
Edge5000coon acevmed No surface smoothing applied
F refresh also hidden windows O Rarem op0alrvdaPO
2H 4H RN mgle FIT V FOS 00 15929 OsdWedge 1 X Pixel Y Pixel nm 82 29 922 8 F <same palava >
rPresent time matrix
Data m el homtion Mnaifr sLai Geahon of opti l smfac END
SIMULATION
F Idt
Nominal working time bd 13483
Max starting oafec Nml I 15929 Max anaMmi surface Nml RO Actual maxim mNM 1865 3
Abort
Min xtardngsurface Nml I RB Min anaLLwl surface Nml 90 Actual minim m NM RB PVWnIma SI 982338)-'I (1l14 Add
Mean starting nuda aNml 9451 Mean anaMwl surface Nml 90 Actual Man nM 861 0 T. mm and T. max (sec) 988: 2646
RMS starting aurfec Nm) I 217.8 RhLSanalNmi surface Nml 90 Actual RMS I ml 69 8 Plkon added inn) 4702
PV starting not ace nml I 92 9 FVanalitial surface Nml 0 0 Actual PV Nml 06 F Automatic Run
The results are summarized in terms of PSD in figure 13: in black the PSD of data acquired before the IBF while in blue are reported the ones acquired after. It appears that whatever the sample and the measurement scale, the results are confirming that no major showstopper on the process come on this side. Dedicated tests are foreseen to systematically characterize the process at the different scale and at the different incidence angle. This preliminary analysis of the micro roughness indicates that the IBF process can match the specifications.
5. ACHIEVABLE RESULTS
The figuring tests operated on the available samples show that the IBF process is a feasible procedure to correct the residual error of the thin glasses after the slumping procedure. Of course, the final quality of the glass and the possibility to perform the correction in a reasonable amount of time depend on the spatial frequency and the amplitude of the initial error on the glass with respect to the removal function spot and to the removal rate. In order to demonstrate the possibilities of the process we report the simulation results on the glass sample S22 that has been unfortunately broken during the installation in the IBF chamber. In figure 14 is reported the initial error map and the corrected map obtained applying the time matrix calculated and the removal function. Differently from the other slumped glasses, this one was more representative of the present accuracy reached by hot slumping at SAO (12).
The error shape of S22 glass is almost in the low frequency regime with amplitude of few hundreds of nanometres. This kind of error can be easily corrected by the IBF: on the other side the local holes cannot me smoothed without removing a huge amount of material on all the rest of the surface. Therefore, the optimization of the IBF has been carried out removing the main holes features from the error map and stopped before the full convergence of the process in order to keep the duration acceptable (around 13 hours). This approach has given promising results: further improvements can be envisaged with more articulated treatment of the data to optimize the process duration vs the achieved results.
io4 10 3 102 101 map:S22 expected Profiles PtV and RMS 0: 0 0000 - 0-Roughness PtV Roughness RMS - N-Prof. PtV Prof. RMS PtV Overall RMS 1000 20 40 60 80 100 120 #Profile I 7r ri map:S22 exnected 6 20 40 60 80 Xaxis [mm] 100 0.1 0.05 0.05 -0.1
Even avoiding the full correction of the error map, the result is quite remarkable: the expected final surface is 69 nm RMS after around 13 hours of figuring as reported on the left panel of figure 14. The HEW, evaluated (13) assuming the surface at a radius of 224 mm (0.32° for a Wolter-I system with focal length of 10m), reached the diffraction limit of 0.8’’ on the entire glass surface free of holes (averaging on the entire the glass 1’’ ± 0.53’’). The same data doubling the incidence angle corresponds to an HEW around 0.6’’ (averaging on the entire glass 0.8’’ ± 0.31). See Figure 15.
This simulation results are quite promising: the IBF combined with the hot slumping could enable the combination of a low mass substrate, the high accuracy of the final surface with reasonable realization costs and production time. Taking into account the breakthrough possibilities of the process, a complete characterization of the effects of the IBF with respect to the deformations introduced by stresses or stress-release is fundamental: as long as it appears to be systematic it could be introduced directly as a correction directly in the slumping mandrel.
Figure 15: (Left) RMS and PTV of the profiles used in the simulation carried out @0.27 keV assuming only the figure error contribution. (Right) On the top the residua considered in the simulation, the colour scale in is microns. As 0.8’’ diffraction limit is reached quite easily for 0.3214° angle (r= 224, f= 10m), the residua have been treated assuming a double incidence angle (0.64°): in pink the expected results from RT and in cyan the results with Fresnel approach.
6. CONCLUSIONS
The ion beam figuring is a high deterministic and non-contact technique for the correction of optics and therefore ideal as a final step in the realization of high angular resolution and low mass x-ray optics. The IBF has been proven compatible with very thin glass substrates commonly used in hot slumping technique. In this work, IBF has been operated on two samples of thin Eagle glass (0.4mm thick) pre-treated via hot slumping in cylindrical configuration (radius of curvature of 1m and of 224mm). These are typical thickness and radii for glass substrates dedicated to lightweight x-ray optics produced via hot slumping process. The preliminary results show that the IBF does not introduce major deformation in the glass plates and does not degrade the micro-roughness. Therefore, the combination of hot slumping and IBF appears a suitable combination for high throughput x-ray optics.
The convergence of the process can be improved thanks to the thickness measurement data, which are performed with an interferometry set-up and return the amount of the material removed. This condition allows a clear disentangle between
the effective correction and the deformations introduced by the process: the fast convergence of the process is a key factor to limit the cost of the mirror plate production. Moreover, promising results have been obtained with the simulation of the IBF performances as realized on the metrological data available for slumped glass much more representative of the hot-slumping performances reached at SAO. Further tests will allow a complete definition of a process suitable for the mass production of x-ray mirrors at affordable costs.
7. REFERENCES
(1) Zhang, W.W., et al., "Next generation astronomical x-ray optics: high angular resolution, light weight, and low production cost, " SPIE 8443, 88430S (2012)
(2) Winter, E. Breunig, P. Friedrich, L. Proserpio, T. Döhring, “Indirect glass slumping for future x-ray missions: overview, status and progress”, Proc. SPIE. 9603 (2015)
(3) Reid, P.B., Allured, R., Cotroneo, V., Hertz, E., Marquez, V., McMuldroch, S., Ben-Ami, S., Schwartz, D.A., Vikhlinin, A.A., Trolier-McKinstry, S., Wallace, M.L., Jackson, T.N., Tananbaum, H.D., “Development of 0.5 arcsecond adjustable x-ray optics: status update,” Proc SPIE 9905, this conference (2016)
(4) Cotroneo, V., Allured, R., Reid, P.B., Vikhlinin, A.A., Pareschi, G., Civitani, M.M., Salmaso, B., “Thermal forming of glass substrates for X-ray Surveyor optics,” Proc SPIE 9905, this conference (2016)
(5) Marta M. Civitani, Stefano Basso, Oberto Citterio, Paolo Conconi, Mauro Ghigo, Giovanni Pareschi, Laura Proserpio, Bianca Salmaso, Giorgia Sironi, Daniele Spiga, Gianpiero Tagliaferri, Alberto Zambra, Francesco Martelli, Giancarlo Parodi, Pierluigi Fumi, Daniele Gallieni, Matteo Tintori, Marcos Bavdaz, Eric Wille, "Accurate integration of segmented x-ray optics using interfacing ribs," Optical Engineering 52(9), 091809 (2013).
(6) M. Civitani, M. Ghigo, J. Hołyszko, G. Vecchi, S. Basso, "Ion beam figuring of thin glass plates: achievements and perspectives", Proc. SPIE 9905, Space Telescopes and Instrumentation 2016: Ultraviolet to Gamma Ray, 990578 (2016);
(7) M. M. Civitani, M. Ghigo, O. Citterio, P. Conconi, D. Spiga, G. Pareschi, L. Proserpio, “3D characterization of thin glass x-ray mirrors via optical profilometry,” Proc. SPIE 7803, 78030L (2010)
(8) R. Allured, S. Ben-Ami, V. Cotroneo, V. Marquez, S. McMuldroch, Reid P. B.; D. A. Schwartz, S. Trolier-McKinstry, A. A. Vikhlinin, M. L. Wallace, “Improved control and characterization of adjustable x-ray optics”, Proc. SPIE. 9603 (2015)
(9) M. Ghigo, S. Cornelli, R. Canestrari, D. Garegnani, “Development of a large ion beam figuring facility for correction of optics up to 1.7 m diameter” PROC SPIE 7426, 742611 (2009).
(10) M. Ghigo, G. Vecchi, S. Basso, O. Citterio, M. Civitani, E. Mattaini, G. Pareschi, G. Sironi, “Ion figuring of large prototype mirror segments for the E-ELT”, Proc. SPIE 9151, (2014)
(11) R.E. Parks, "MicroFinish Topographer: surface finish metrology for large and small optics", Proc. SPIE 8126 (2011) (12) V. Cotroneo, P. B. Reid, R. Allured, V. Marquez, C. T. DeRoo, E. D. Schwartz, K. L. Gurski, “Thermal forming of
glass substrates for adjustable optics”, Proc. SPIE, (This conference, Paper n: 10399-31) (2017)
(13) Raimondi, L., Spiga, D., "Mirror for X-ray telescopes: Fresnel diffraction-based computation of point spread functions from metrology," AA 573, A22 (2015)