A
LMA
M
ATER
S
TUDIORUM
U
NIVERSITÀ DEGLI STUDI DI
B
OLOGNA
DIPARTIMENTO DIFISICA EASTRONOMIA Dottorato di Ricerca in Astrofisica
CICLO XXX
Obscured and Compton-thick AGN in
NuSTAR hard X-ray surveys
Candidato: Alberto MASINI
Supervisore: Dr. Andrea COMASTRI
Coordinatore: Prof. Francesco FERRARO
Esame finale anno 2018
Settore Concorsuale 02/C1 – Astronomia, Astrofisica, Fisica della Terra e dei Pianeti Settore Scientifico-Disciplinare: FIS/05 – Astronomia e Astrofisica
iii
“As soon as man seeks to penetrate the secrets of nature - in which nothing is secret and it is but a question of seeing - he realizes that the simple produces the supernatural.”
Abstract
Questa Tesi di dottorato sviluppa un progetto di ricerca selezionato e finanziato da INAF (Istituto Nazionale di Astrofisica) all’interno dell’accordo formale tra INAF e Università di Bologna per il programma di Dottorato in Astrofisica.
Il progetto riguarda survey di nuclei galattici attivi (AGN) nei raggi X duri (fino a qualche decina di keV) con il telescopio NuSTAR. Uno dei principali obbiettivi della missione NuSTAR è quello di studiare con incredibile dettaglio la popolazione di AGN oscurati e molto oscurati (chiamati Compton-thick, CT), che contribuiscono in modo significativo all’emissione diffusa del fondo cosmico a raggi X (CXB), e importanti attori nel ciclo evolutivo delle galassie.
La Tesi si struttura quindi con un approccio locale-distante: nella prima parte, si presenta uno studio di un piccolo campione (circa una dozzina) di AGN locali (z < 0.03), molto oscurati, selezionati a causa della loro emissione da megamaser d’acqua a ∼ 22.23 GHz. Tale selezione è motivata dalla nota correlazione tra la presenza di emissione da megamaser con geometria a disco, e oscuramento nei raggi X, già nota in letteratura. Grazie alla banda larga di NuSTAR nei raggi X duri (che si estende tra ∼ 3 − 80 keV), si ottiene una misura robusta della frazione di sorgenti CT. Partendo da questo risultato e combinando misure nei raggi X e nella banda radio, viene proposto e sviluppato un semplice modello analitico della connessione tra il disco megamaser e il toro; tale modello viene usato per predire la colonna di materiale che assorbe i raggi X dalle mappe radio ottenute con l’interferometro VLBI. Anche se semplicistico, il mod-ello collega in maniera naturale l’emissione da megamaser da disco con l’assorbimento CT in AGN locali.
Un seguito del progetto sui megamaser è legato ad uno studio di variabilità, fo-calizzato su un ben noto AGN locale oscurato (Mrk1210, noto anche come la Galassia Fenice), e votato allo studio della sua variabilità X a lungo termine (∼ 17 anni) usando NuSTAR, grazie al quale si possono ottenere alcune indicazioni sull’ambiente vicino all’AGN basandosi sull’intensità della componente di riflessione presente nello spet-tro X della sorgente. La discussione viene poi conclusa presentando alcuni esempi su come l’oscuramento CT sia variegato e variabile, e non sempre legato alla presenza di righe del ferro con grande larghezza equivalente. La complessità dell’oscuramento CT complica ulteriormente la ricerca di AGN CT nell’universo più distante, dove si trova il picco dell’accrescimento oscurato cosmico (1 < z < 2).
La ricerca e caratterizzazione di AGN CT con NuSTAR viene quindi spinta a red-shift maggiori, sfruttando appieno le potenzialità di NuSTAR in termini di sensibilità e risposta nei raggi X duri. La ricerca di AGN oscurati deboli e lontani viene compiuta sfruttando la copertura combinata nei raggi X di NuSTAR, XMM-Newton e Chandra nel campo UKIDSS-UDS. Si presenta la strategia della survey profonda, insieme alla modellizzazione del background di NuSTAR, per ottimizzare la detezione di sorgenti deboli. Dopo aver accuratamente valutato ogni caso di blending tra sorgenti vicine, la frazione di detezioni spurie, e le controparti ottiche alle sorgenti X rivelate, viene
diagnostica standard da Hardness Ratio (HR), per includere ogni potenziale candidato CT. Questi candidati CT vengono poi ri-analizzati con modelli spettrali appropriati, specificatamente sviluppati per studiare sorgenti CT.
L’ultimo capitolo presenta le conclusioni e le prospettive future del progetto di Tesi.
This Thesis has been devoted to a research project selected and funded by INAF (the Italian National Institute for Astrophysics) within the framework of the formal agreement between INAF and the Bologna University for the PhD program in Astro-physics.
It focuses on NuSTAR hard (up to several tens of keV) X-ray surveys of Active Galactic Nuclei (AGN). One of the major goals of the NuSTAR mission is to study with unprecedented detail the obscured and heavily obscured (Compton-thick, CT) popula-tions of AGN, significantly contributing to the diffuse cosmic X-ray background (CXB), and major actors within the evolutionary cycle of galaxies.
This Thesis is then structured with a local-to-distant approach: in the first part, a survey of a small sample (∼ a dozen) of local (z < 0.03) heavily obscured AGN, selected by their water megamaser emission at ∼ 22.23 GHz, is presented. The selection follows from a known correlation between the megamaser emission with a disk geometry and X-ray obscuration already explored in the literature. Thanks to the NuSTAR hard X-ray spectral coverage (extending between ∼ 3 − 80 keV), a robust estimate of the CT fraction is obtained. Building up on this result and combining X-ray and radio measurements, a toy model of the dusty megamaser disk within the classical dusty torus is proposed, and developed in order to predict the X-ray absorbing column density from radio VLBI maps. Despite simplistic, the model connects in a natural way the megamaser emission with the CT absorption in local AGN.
A spin-off of the megamaser project is related to variability, focusing on a well-known local obscured AGN (Mrk1210, a.k.a. the Phoenix Galaxy) and devoted to studying its long-term (∼ 17 yrs) X-ray variability with NuSTAR, from which some constraints on the AGN environment can be drawn based on the strength of the reflec-tion component in the X-ray spectrum of the source. The discussion is then concluded presenting few examples on how CT obscuration can be variegate and variable, and not always related to the presence of high equivalent width (&1 keV) iron lines. The complexity of CT obscuration challenges the search for CT AGN in the more distant Universe, where the peak of obscured accretion lies (1 < z < 2).
The search for, and the characterization of, CT AGN is then pushed to higher red-shifts, fully exploiting the NuSTAR X-ray capabilities in terms of sensitivity and hard X-ray response. The hunt for faint and distant heavily obscured AGN is performed ex-ploiting the combined NuSTAR, XMM-Newton and Chandra coverages of the UKIDSS-UDS field. The deep NuSTAR survey strategy is presented, along with the modeling
vii
of the NuSTAR background in order to optimize the detection of faint sources. Care-fully evaluating the blending of sources, spurious fraction, and optical counterparts, a broadband X-ray spectroscopic analysis of all the detected sources is performed, and combined with the standard hardness ratio (HR) diagnostic, in order to select all the possible CT candidates. Such CT candidates are then analyzed again with appropriate X-ray spectral models specifically developed to deal with CT absorbers.
ix
Related publications
First author publications• Masini A., Comastri A., Balokovi´c M., et al. 2016, “NuSTAR observations of water megamaser AGN”, Astronomy&Astrophysics, 589, 59
• Masini A., Comastri A., Puccetti S., et al. 2017, “The Phoenix galaxy as seen by NuSTAR”, Astronomy&Astrophysics, 597, 100
• Masini A., Civano F., Comastri A., et al. 2017, “The NuSTAR Extragalactic Sur-veys: source catalog and the Compton-thick fraction in the UDS field”, submitted to The Astrophysical Journal
Second author publications
• Brightman M., Masini A., Ballantyne D. R., et al. 2016, “A growth-rate indicator for Compton-thick Active Galactic Nuclei”, The Astrophysical Journal, 826, 93 Other publications
• Lanzuisi G., Perna M., Comastri A., et al. 2016, “NuSTAR reveals the extreme properties of the super-Eddington accreting supermassive black hole in PG 1247+ 267”, Astronomy&Astrophysics, 590, 77
• Koss M., Glidden A., Balokovi´c M., et al. 2016, “NuSTAR Resolves the First Dual AGN above 10 keV in SWIFT J2028.5+2543”, The Astrophysical Journal Letters, 824, 4
• Boorman P. G., Gandhi P., Alexander D., et al. 2016, “IC 3639 – a new bona fide Compton-thick AGN unveiled by NuSTAR”, The Astrophysical Journal, 833, 245 • Gandhi P., Annuar A., Lansbury G. B., et al. 2017, “The weak neutral Fe fluo-rescence line and long-term X-ray evolution of the Compton-thick AGN in NGC 7674”, Monthly Notices of the Royal Astronomical Society, 467, 4606
• Brightman M., Balokovi´c M., Ballantyne D. R., et al. 2017, “X-ray bolometric corrections for Compton-thick Active Galactic Nuclei”, The Astrophysical Jour-nal, 844, 10
• Lansbury G. B., Alexander D. M., Aird J., et al. 2017, “The NuSTAR Serendip-itous Survey: Hunting for the Most Extreme Obscured AGN at > 10 keV”, The Astrophysical Journal, 846, 20
• Kosec P., Brightman M., Stern D., et al. 2017, “Investigating the evolution of the dual AGN system ESO 509−IG066”, The Astrophysical Journal, in press
• Zappacosta L., Comastri A., Civano F., et al. 2017, “The NuSTAR Extragalactic Surveys: X-ray spectroscopic analysis of the bright hard-band selected sample”, submitted to The Astrophysical Journal
xi
Related activities
Invited talks• Young Astronomers on Galactic Nuclei 2017 (YAGN17), 23-26 Oct 2017, Teruel, Spain, “Obscured and Compton-thick AGN in NuSTAR hard X-ray surveys” Contributed talks
• The X-ray view of Black Hole activity in the local Universe, 17-19 Feb 2016, Zurich, Switzerland, “NuSTAR observations of water maser AGN”
• Demographics and Environment of AGN from Multi-Wavelength Surveys, 21-24 Sep 2015, Chania, Greece, “NuSTAR observations of water maser AGN”
• Torus AGN meeting 2015, 14-17 Sep 2015, Winchester, UK, “The physics of mega-maser AGN”
Posters
• IAU Symposium 336 Astrophysical masers: unlocking the mysteries of the Uni-verse, 4-8 Sep 2017, Cagliari, Italy, “Exploring why the detection efficiency of disk megamasers in local Seyfert 2 AGN is so low”
• NuSTAR meeting 2016, 15-17 Nov 2016, Pasadena CA, USA, “The Phoenix Galaxy as seen by NuSTAR”
• AGN: what’s in a name?, 27-1 Jun-Jul 2016, Garching, Germany, “The NuSTAR view of the Phoenix Galaxy and its long-term behavior in the hard X-ray band” International Schools, Courses and Conferences attended
• PhD internal course “Everything you always wanted to know about Python but were afraid to ask” in Bologna, Italy, 6-17 Nov 2017
• YAGN17 meeting in Teruel, Spain, 23-26 Oct 2017
• IAU Symposium 336 “Astrophysical masers: unlocking the mysteries of the Uni-verse” in Cagliari, Italy, 4-8 Sep 2017
• PhD internal course “What can we learn from SKA” in Bologna, Italy, Mar 2017 • “AGN: what’s in a name?” conference in Garching, Germany, 27-1 Jun-Jul 2016 • PhD internal course “What can we learn from the GAIA mission?” in Bologna,
Italy, 6-10 Jun 2016
• “The X-ray view of Black Hole activity in the local Universe” in Zurich, Switzer-land, 17-19 Feb 2016
AGN to cosmic reionization” in Bologna, Italy, 26-30 Oct 2015
• “Demographics and Environment of AGN from Multi-Wavelength Surveys” in Chania, Greece, 21-24 Sep 2015
• TORUS2015 meeting in Winchester, UK, 14-17 Sep 2015
• “Towards the Cherenkov Telescope Array and Future Gamma–ray Experiments” in Sesto, Italy, 27-31 Jul 2015
• PhD internal course “Bayesian methods in Astrophysics” in Bologna, Italy, 15-17 Apr 2015
• International School of Astrophysics “F. Lucchin” in Teramo (Italy), 9-13 Dec 2014
• PhD internal course “Stellar populations in the local group” in Bologna, Italy, 27-31 Oct 2014
Periods Abroad
• Four months at the Harvard-Smithsonian Astrophysical Observatory in Cam-bridge MA (USA) within the Marco Polo program, 16-16 Aug-Dec 2016
• Visiting Student for one month at the Harvard-Smithsonian Astrophysical Ob-servatory in Cambridge MA (USA), 30-30 Mar-Apr 2016
xiii
Contents
Abstract v Related publications ix Related activities xi 1 Introduction 1 1.1 Preamble . . . 1 1.2 X-ray AGN . . . 31.2.1 AGN X-ray spectra . . . 3
1.2.2 The Cosmic X-ray Background . . . 6
1.3 The Nuclear Spectroscopic Telescope Array . . . 8
2 Obscured AGN with NuSTAR − The local Universe 13 2.1 A discussion on X-ray spectroscopy . . . 13
2.1.1 Phenomenological models for X-ray spectroscopy . . . 14
2.1.2 Toroidal models for X-ray spectroscopy . . . 15
2.2 The NuSTAR survey of bright Swift-BAT AGN . . . 18
2.3 Megamasers . . . 18
2.3.1 Disk megamasers . . . 19
2.4 Disk Megamasers and SMBHs demographics . . . 20
2.5 Disk Megamasers and obscured AGN . . . 21
2.6 Data and spectral analysis . . . 23
2.6.1 The sample . . . 23 2.6.2 Data reduction . . . 23 NGC 1194 . . . 23 NGC 1386 . . . 27 NGC 2273 . . . 27 NGC 2960 . . . 28 NGC 3079 . . . 28 NGC 3393 . . . 28
IC 2560 . . . 29
2.6.3 Summary of spectral analysis results . . . 30
2.7 The connection between the maser disk and the torus . . . 30
2.7.1 A toy model . . . 33
2.7.2 The torus size . . . 37
2.8 Discussion . . . 39
2.8.1 Comparison with mid-infrared interferometry . . . 39
2.8.2 Trend with bolometric luminosity . . . 39
2.8.3 The possible role of warps . . . 41
2.9 Megamaser disks as probes of AGN accretion . . . 41
2.9.1 TheΓ−λEddrelation . . . 41
2.9.2 The kBolof CT AGN . . . 45
2.10 Summary of this Chapter . . . 45
3 Variability and Compton-thickness: the NuSTAR perspective 49 3.1 Variability and “Changing look” AGN . . . 49
3.2 Mrk1210: a case study . . . 50 3.2.1 Data reduction . . . 51 3.2.2 Spectral analysis . . . 51 Phenomenological models . . . 52 Toroidal models . . . 53 A physical picture . . . 54 Intrinsic luminosity . . . 58
3.2.3 Long-term behavior and discussion . . . 58
Change in intrinsic luminosity . . . 60
Eclipsing event . . . 62
3.3 Variability and iron lines in other nearby Seyferts . . . 63
3.3.1 IC3639 . . . 63
3.3.2 NGC7674 . . . 63
3.4 Summary of this Chapter . . . 64
4 Obscured AGN in deep surveys: the NuSTAR UKIDSS - UDS survey 67 4.1 Hard X-ray surveys with NuSTAR, and the UDS field . . . 67
4.2 Data reduction . . . 70
4.2.1 Flaring episodes . . . 72
4.2.2 Data, exposure, and background mosaics . . . 72
4.3 Simulations . . . 73
4.3.1 Initial setup . . . 74
4.3.2 Reliability, completeness, and sensitivity . . . 74
xv
4.4 Match with XMM-Newton and Chandra catalogs . . . 80
4.4.1 XMM-Newton . . . 80
The case of uds59 . . . 82
4.4.2 Chandra . . . 83
4.4.3 Optical counterparts . . . 84
4.5 Extraction of X-ray spectra, obscured and CT fraction . . . 86
4.5.1 Combining HR and broadband spectral analysis diagnostic: a re-fined analysis . . . 89
4.6 Discussion on the CT fraction . . . 91
4.6.1 Iron Kα . . . 97
4.7 Summary of this Chapter . . . 97
5 Conclusions and future perspectives 99 5.1 Final summary . . . 99
5.2 Future perspectives . . . 100
5.2.1 Megamasers . . . 100
5.2.2 X-ray surveys with current and future missions . . . 100
A Mrk1210: analysis of the 2004Chandra observation 103 A.1 Analysis of the Chandra 2004 (C0) observation . . . 103
B The NuSTAR UKIDSS-UDS survey; further details 105 B.1 Details of the refined spectral analysis . . . 105
B.1.1 uds47 . . . 105 B.1.2 uds48 . . . 105 B.1.3 uds63 . . . 107 B.1.4 uds66 . . . 107 B.2 Catalog description . . . 107 Bibliography 113 Acknowledgements 127
xvii
List of Figures
1.1 AGN SED . . . 2
1.2 AGN X-ray SED . . . 4
1.3 Effects of NHon AGN X-ray spectrum . . . 5
1.4 CXB . . . 7
1.5 Cartoon of galaxy evolution . . . 8
1.6 NuSTAR sketch . . . 9
1.7 NuSTAR effective area . . . 10
1.8 NuSTAR background . . . 11
2.1 Models for X-ray spectra of AGN; phenomenological model . . . 14
2.2 Toroidal models . . . 15
2.2a MYTorus . . . 15
2.2b BNTorus . . . 15
2.3 Models for X-ray spectra of AGN; the MYTorus model . . . 16
2.4 Models for X-ray spectra of AGN; the MYTorus decoupled model . . . 17
2.5 NGC5765b, maser spectrum . . . 20
2.6 NGC5765b . . . 21
2.6a VLBI map . . . 21
2.6b P-V plane . . . 21
2.7 NuSTAR megamasers spectra . . . 25
2.7a NGC1194: MYT decoupled +zpow+zgauss . . . 25
2.7b NGC1386: Torus +zgauss . . . 25
2.7c NGC2273: Torus . . . 25
2.7d NGC2960: MYTorus . . . 25
2.7e NGC3079: MYTorus +zpow . . . 25
2.7f NGC3393: Torus . . . 25
2.7g NGC4388: MYT decoupled +zpow . . . 25
2.7h IC2560: Torus +zgauss . . . 25
2.8 Torus + Maser disk geometries . . . 32
2.8a Maser disk as torus midplane . . . 32
H
2.10 Smooth density profile vs clumpy clouds distribution . . . 36
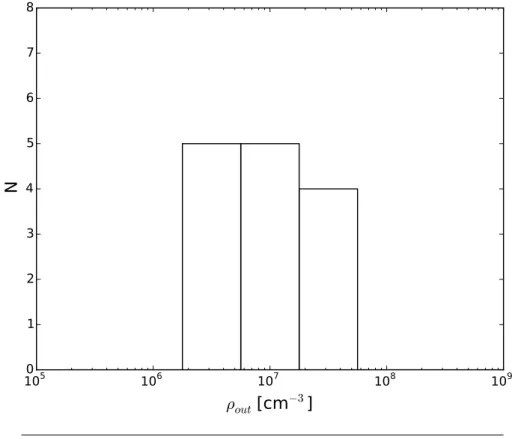
2.11 Distribution of the parameterρout . . . 37
2.12 Distribution of torus outer radius . . . 38
2.13 Circinus torus . . . 40
2.13a MIR interferometric image . . . 40
2.13b Model . . . 40
2.14 Size-luminosity relations . . . 42
2.15 Obscuring warps in disks . . . 43
2.16Γ−λEddfor CT AGN . . . 44
2.17 kbolof CT AGN . . . 46
3.1 SDSS image of Mrk1210 . . . 51
3.2 Mrk1210 . . . 52
3.2a NuSTAR spectrum . . . 52
3.2b NuSTAR light curve . . . 52
3.3 Mrk1210: baseline model . . . 54
3.3a Fit with the baseline model . . . 54
3.3b Confidence contour plot for the line energy . . . 54
3.4 Toroidal models fits to Mrk1210 spectrum . . . 55
3.4a Fit with the baseline model . . . 55
3.4b Confidence contour plot for the line energy . . . 55
3.5 DecoupledMYTorusmodel fit to Mrk1210 spectrum . . . 56
3.6 Long-term behavior of Mrk1210 . . . 59
3.7 Hard and Fe line fluxes . . . 61
3.8 Two local CT AGN. . . 63
3.8a IC3639 . . . 63
3.8b NGC7674 . . . 63
4.1 X-ray surveys discovery space . . . 68
4.2 Introduction on NuSTAR surveys . . . 69
4.2a Luminosity - redshift plane . . . 69
4.2b Fraction of resolved CXB intensity. . . 69
4.3 NuSTAR UDS. . . 70
4.3a The field in the X-ray band. . . 70
4.3b Area vs exposure coverage. . . 70
4.4 Real vs simulation. . . 73
4.5 Reliability and completeness . . . 76
4.5a Reliability. . . 76
4.5b Completeness at the 97% reliability threshold. . . 76
4.6 Sky coverage of the survey. . . 78
4.7 Aperture photometry on simulations. . . 79
xix
4.9 Detection on simulations. . . 81
4.10 Net counts and fluxes of the detected sources in UDS97. . . 82
4.10a Counts distribution. . . 82
4.10b Fluxes distribution. . . 82
4.11 NIR image of uds59 field . . . 83
4.12 Match with XMM-Newton and Chandra catalogs. . . 84
4.12a Primary counterpart separation. . . 84
4.12b NuSTAR vs XMM-Newton and Chandra fluxes. . . 84
4.13 Optical counterparts for our sample. . . 85
4.13a Redshift distribution. . . 85
4.13b Lx− z plane. . . . 85
4.14 UDS97: NHdistribution. . . 87
4.15 UDS97: HR−z plane . . . 88
4.16 Hardness ratio diagnostic . . . 90
4.16a HR−Net counts plane. . . 90
4.16b HR−NHplane . . . 90
4.17νFνspectra of the 10 CT candidates in the UDS field . . . 93
4.18 NHfor our CT candidates . . . 94
4.19 Measured CT fraction compared with models. . . 95
A.1 Chandra spectrum of Mrk1210 . . . 103
xxi
List of Tables
2.1 Megamaser sample, global properties, and references. . . 22
2.2 NuSTAR observation details for the eight sources analyzed. . . 24
2.3 NuSTAR X-ray best fit spectral results for the eight sources analyzed. . . 26
2.4 ρoutvalues as computed by the toy model . . . 38
2.5 RX− Lbolrelations: best fit parameters . . . 41
2.6 Warps depths . . . 43
3.1 History of X-ray observations of Mrk 1210. . . 50
3.2 Mrk1210: summary of spectral analysis . . . 57
3.3 ASCA and NuSTAR parameters . . . 60
4.1 Details of the individual UDS observations. . . 71
4.2 Observed vs simulated counts. . . 74
4.3 Completeness as a function of flux, 97% reliability catalog. . . 76
4.4 Summary of detection, UDS97 sample. . . 77
4.5 Detection on simulations and data mosaics. . . 92
4.6 Summary of properties of the 10 CT candidates. . . 96
A.1 C0 observation; best fitting parameters. . . 104
B.1 Results of the refined broadband spectral analysis for the 10 CT candidates.106 B.2 UDS catalog, I. . . 111
1
Chapter
1
Introduction
This first Chapter is a brief introduction to the main topic of this Thesis, which aims to study obscured Active Galactic Nuclei (AGN), both in the local and more distant Universe, with NuSTAR. A quick review of AGN main properties is presented, focusing mainly on X-ray AGN. In this context, a deeper view of general X-ray AGN spectra and the integrated Cosmic X-ray Background are needed. The Chapter is then concluded presenting the NuSTAR telescope and its early and recent scientific results in the obscured AGN topic.
1.1
Preamble
Active Galactic Nuclei (AGN) represent an exciting and hot topic in modern astro-physics. Since the first optical spectrum of a quasar was obtained in the sixties (Schmidt, 1963), the field has undergone a great expansion and lot of work has been done in or-der to detect, characterize, and study in detail a wide variety of samples, ranging from single-object case studies to large surveys with almost millions of sources.
The multi-wavelength approach to astronomy has greatly enriched the amount of knowl-edge in each field. Also AGN, thanks to their unique spectral signature across all the electromagnetic spectrum, can be observed and studied at almost every energy, from radio toγ-rays, as shown in Figure 1.1.
According to the so-called AGN unified model (Antonucci, 1993; Urry and Padovani, 1995), any AGN in the Universe is empowered by an accreting supermassive black hole (SMBH; MBH≥ 106M¯). Accretion phenomena are ubiquitous in the Universe, since accretion disks are predicted (and effectively observed, in most cases) around protoplanets, protostars, white dwarfs, neutron stars, stellar-mass black holes, and SMBHs. As clearly seen in Figure 1.1, different wavelengths probe different parts of the AGN structure. The accretion disk of AGN emits in the optical-UV band, while the X-ray emission is thought to be generated by an hot electron plasma which upscat-ters the optical-UV photons of the accretion disk in the close vicinity of the central BH (few gravitational radii, where the gravitational radius is defined as rg= 2GMBHc−2), called corona. Part of the energy output of the system is absorbed by matter outside
FIGURE1.1: AGN spectral energy distribution (SED), where the flux emitted by a prototypical AGN is shown as a black solid line. Compo-nents invoked to explain the emission in the various energy bands are labeled with different colors and styles. It is clear from the figure that different wavelength regimes probe different parts of the AGN struc-ture and paradigm. Also shown is the template of a starburst galaxy in
light gray. Figure adapted from Harrison (2014).
the accretion disk (at the ∼ pc scale); if dust is present in the gas, radiation is absorbed and re-emitted in the IR band, and such a structure is called dusty torus. The torus, being axisymmetric, has a crucial role in the simplest version of the unified model of AGN. The line of sight with respect to the torus, and its geometry, are considered to be responsible for the difference between the unobscured and obscured AGN, at least in the local Universe (z < 1). When considering large redshift intervals, evolutionary effects become more and more important, challenging the standard version of the uni-fied model, where the geometry of the system is the only parameter. This picture has indeed evolved in recent years, and more parameters are now considered as driving the general evolution of AGN, like the luminosity, the accretion rate, and the timescale associated to the obscured and unobscured phases (Hopkins et al., 2006; Hickox et al., 2014). The radio band, together with the γ-ray band, probes non thermal emission coming from free electrons or jets arising from the central rotating BH. The latter is employed to select and study a particular class of AGN, called blazars, where the highly variable emission is dominated by the jet, pointing directly toward the observer. Blazars and strong radio sources have a different spectral energy distribution (SED),
1.2. X-ray AGN 3
together with different physical properties, with respect to “normal” (i.e. radio quiet) AGN, and will not be discussed in this Thesis.
1.2
X-ray AGN
Common ways to efficiently detect AGN include radio, mid-infrared (MIR), optical and X-ray selections. Each of them has its strengths and weaknesses (for a recent discus-sion, see, e.g., Brandt and Alexander, 2015). The X-ray selection method is probably the most efficient one to date, thanks to the penetrating power of X-rays, mainly in the hard X-ray band (E > 5 − 10 keV), which makes them less prone to obscuration biases or contamination from other processes, which afflict, for example, the optical and MIR bands. Moreover, X-ray emission is thought to be a universal feature in the AGN phenomenon, and X-ray luminosities larger than Lx&1042erg s−1, which are not explained by other stellar or accretion processes, provide a strong tracer for the pres-ence of an AGN, while the radio band selects preferentially the so-called “radio-loud” (RL) AGN1. On the other hand, AGN X-ray selection requires a substantial amount of observing time, due to the difficulty of focusing X-rays (especially hard X-rays) and to the intrinsic faintness of the majority of distant AGN, which can reach fluxes as faint as Fx∼ 10−17erg cm−2s−1.
1.2.1 AGN X-ray spectra
The X-ray spectrum of an AGN is composed by a mixture of different components, contributing at different levels depending on geometry, accretion rate, and obscuration. The majority of the X-ray emission can be mainly ascribed to the primary continuum arising from the corona (dashed line in Figure 1.2). The primary continuum has the functional form of a power law, N(E) ∝ E−Γ, with a photon index Γ usually between 1.8 and 2, over almost three decades in energy, between ∼0.1 and ∼ 400 keV. At low energies (below few keV) the power law suffers absorption from the Galaxy and, for obscured AGN, from the dusty torus, while at high energies (hundreds of keV) the continuum gets exponentially cutoff, due to the limit set by the hot electron plasma temperature. On top of the primary power law, there is also the reflection component (dot-dashed line in Figure 1.2), coming from photons which are reflected (i.e. scattered back, or absorbed and re-emitted) on the accretion disk or the torus inner walls. The characteristic shape of a reflection component includes a bump at 20 − 30 keV and an ubiquitous and prominent fluorescent iron Kαline at 6.4 keV, which can be broad or narrow, depending on the location where they both arise. Broad iron lines are usually observed in unobscured AGN, where the line of sight to the accretion disk is free of absorption, the reflection is due to photons emitted from the corona and reflected from the accretion disk, and the broadening of the line is due to special and general relativity
1Recently, Padovani (2017) proposed to rename RL and RQ AGN as “jetted” and “non-jetted” AGN,
respectively, in order to reflect the presence (or not) of a prominent radio jet dominating the radio emission of the AGN itself.
black hole (e.g., Fabian, 2008). On the other hand, in obscured AGN the line of sight to the inner accretion disk is likely to be blocked by intervening matter, and most of the reflection and the line (which is usually narrow) are though to originate on much larger scales (perhaps the inner torus walls, see Gandhi, Hönig, and Kishimoto, 2015, while recent work also suggests a ∼ kpc scale origin, at least for the iron line; see Bauer et al., 2015), and the line increasing equivalent width with increasing obscuration is due to the suppression of the underlying continuum. Long term monitoring of sources showing reverberating reflection and iron lines can shed light on the origin of such features (see the case of Mrk1210 presented in Chapter 3). Finally, at even lower energies (E < 2 − 3 keV), the spectrum of an unobscured AGN shows the so-called “soft excess” (dotted line in Figure 1.2), for which several interpretations have been given, despite a definitive answer is still missing (could be due to reflection of ionized gas; e.g., Fabian et al., 2012). The arising soft emission in obscured AGN, on the other hand, is thought to be due to electron scattering in an ionized zone extended on a size scale larger than the obscuring structure (Bianchi and Guainazzi, 2007), and is well modeled by a power law resembling the primary one (i.e., with roughly the sameΓ), rescaled by a factor of a few percent.
0.1
10
1
10
100
1000
−410
−30.01
keV
2(Photons cm
−2s
−1keV
−1)
Energy (keV)
FIGURE1.2: Zoom-in on the typical unobscured AGN X-ray (100 eV − 1
MeV) SED, where the primary power law is labeled as the dashed line, the reflection and iron fluorescence line are labeled with dot-dashed lines, and the so-called “soft excess” is modeled as a black body and indicated by the dotted line. The spectrum is absorbed by a typical
1.2. X-ray AGN 5
X-ray spectroscopy is a powerful tool to study in detail the X-ray emission from an AGN. It provides fundamental parameters, like the photon index of the primary power law or the high-energy cutoff, which are in turn related to the physics or physical prop-erties of the hot electrons of the corona and its optical depth, the obscuring status of the source and its column density along the line of sight, lines equivalent width, X-ray fluxes and luminosities. In particular, the de-absorbed (i.e., corrected for absorption) X-ray luminosity can be used to get an estimate of the total (i.e., bolometric) luminos-ity, applying a proper bolometric correction factor kBol, such that Lbol= kbolLX. On the other hand, an estimate of the SMBH mass allows to calculate the Eddington luminos-ity LEdd, which is defined as the maximal luminosity which an accreting system can have. Beyond this limit, the radiation pressure overbalances gravity and the accreting material is expelled from the system. The ratio between the bolometric luminosity and the Eddington luminosity is defined as the Eddington ratio,λEdd, and is a probe of the accretion rate onto a black hole, and is then defined asλEdd= Lbol/LEdd∝ kbolLX/MBH.
FIGURE1.3: Effects of different NHon AGN X-ray spectrum withΓ= 2, affected by photoelectric absorption and Compton downscattering at the highest NH. The numbers label the logarithm of the column density
In analogy with the more famous and intense Cosmic Microwave Background (CMB, Penzias and Wilson, 1965), the discovery of the existence of a Cosmic X-ray Back-ground in the early sixties (CXB, Giacconi et al., 1962) greatly boosted the research on the nature of this diffuse emission, which was immediately recognized as extragalac-tic in origin. As of today, most of the CXB intensity has been resolved into discrete sources, although for E < 10 keV (Worsley et al., 2005; Hickox and Markevitch, 2006; Xue et al., 2011), thanks to the large number of surveys performed by important facili-ties like Chandra (Weisskopf et al., 2000) and XMM-Newton (Jansen et al., 2001). Both these instruments brilliantly surveyed the X-ray sky for almost twenty years now, but they are limited mostly to soft X-ray energies (E < 10 keV) and suffer a substantial absorption bias. It is well known, indeed, that if an X-ray source is obscured by a cer-tain amount of gas NHalong the line of sight to the observer, expressed in cm−2, the X-ray flux can be significantly attenuated, and only a fraction of the intrinsic flux of photons reach the observer, while most of them get scattered or photo-absorbed. The optical depthτof the intervening gas can be expressed asτ= NHσT, whereσT is the Thomson scattering cross-section. When the optical depth becomes comparable to, or larger than one, the gas becomes Compton-thick (CT), and the corresponding column density is NH&σ−1T = 1.5 × 1024 cm−2. Above the CT threshold, also the high-energy emission (> 10 keV) is suppressed by downscattering. An example of how the typical X-ray spectrum of an AGN is modified by an intervening column density is shown in Figure 1.3. In principle, the intrinsic emission from the AGN is totally suppressed below E < 4 keV by a CT column density. However, Figure 1.3 shows only the primary continuum suppression and no reflection nor the scattered power law are included. Considering a mixture of populations of AGN with a distribution in redshift, luminos-ity, and obscuration, one can build a model of the CXB, which represents the integrated emission from AGN at all redshifts, luminosities, and obscuration (Comastri et al., 1995), and fit it to the data.
As shown in Figure 1.4, obscured AGN (i.e., 1022<NH< 1024cm−2; also called Compton-thin) account for most of the CXB emission above 2 keV (long dashed component in Figure 1.4), while unobscured AGN (i.e., NH< 1022cm−2) dominate below 2 keV (short dashed component in Figure 1.4). Finally, a population of heavily obscured sources is accounted for, to fit the measured peak of the X-ray background between 20 and 30 keV (e.g. Gilli, Comastri, and Hasinger, 2007), and is labeled as the dot-dashed line. Al-though not being dominant, such contribution is significant. Assuming indeed that the peak of the CXB could be modeled by Compton-thin AGN only , the relative fraction of obscured sources would significantly overestimate the observed one. The fraction of CT AGN is then a key ingredient of population synthesis models, and while some models assume a relatively high intrinsic fraction of CT AGN (e.g., ∼ 40% of all AGN; Gilli, Comastri, and Hasinger, 2007), others adopt different recipes with a much lower fraction of CT AGN in order to fit the observed CXB spectrum, adding other physical
1.2. X-ray AGN 7
FIGURE1.4: CXB spectrum between 0.1 − 400 keV, measured by vari-ous instruments. The best-fitting model of Comastri et al. (1995) is la-beled as the black solid line, while contributions from unobscured (NH < 1022 cm−2), Compton-thin (1022
< NH < 1024 cm−2) and Compton-thick (NH > 1024 cm−2) AGN are labeled as the short-dashed, long-dashed and dot-long-dashed lines, respectively. Figure adapted from
Comas-tri (2004).
parameters such as the strength of the reflection component or the spin of SMBHs, based on observations of statistically significant samples (Treister, Urry, and Virani, 2009; Akylas et al., 2012; Akylas et al., 2016; Vasudevan et al., 2016).
Regardless of their exact fraction, CT AGN are also often considered as a crucial evo-lutionary phase by many galaxy evolution models, mainly related to merging episodes (see Figure 1.5), in which a large fraction of cold gas is funneled toward the central SMBH, which actively grows and subsequently influences the host galaxy (Sanders et al., 1988; Hopkins et al., 2006; Ricci et al., 2017). This co-evolution of the SMBH with its host galaxy gives then rise to the well-known BH-host scaling relations, such as the MBH− Mbulge, or the MBH−σ∗(Magorrian et al., 1998; Ferrarese and Merritt, 2000). Therefore, active SMBHs hidden by CT obscuration need to be taken into account by theoretical models, both population synthesis and galaxy evolution, but represent also an observing challenge. Indeed, there are indications that many of the AGN closest to our Milky Way are significantly absorbed (Arévalo et al., 2014; Puccetti et al., 2014; Bauer et al., 2015; Annuar et al., 2017) and CT absorption is commonly observed in
FIGURE 1.5: Cartoon of the merger-driven galaxy evolution model. Mergers are expected to funnel a large amount of cold gas towards the central SMBHs, which eventually merge and actively grow buried in a dense shell of cold gas. The feedback from the obscured (and possibly CT) quasar then expels the surrounding gas, making the AGN shine as unobscured and impacting (positively or negatively) the host galaxy
star formation. Figure adapted from Alexander and Hickox (2012).
the local Universe (e.g., Maiolino et al., 1998; Risaliti, Maiolino, and Salvati, 1999). Nonetheless, great efforts have to be done in order to robustly detect these sources in the distant Universe (i.e., at redshift z > 1, e.g. Gilli et al., 2011; Lanzuisi et al., 2015). Despite the enormous successes of Chandra and XMM-Newton, the large majority of the CXB above 10 keV remains unresolved. This is due to the technological difficulty of focusing hard X-rays, and till few years ago, only coded mask instruments, such as Swift-BAT and INTEGRAL, were employed to survey the hard X-ray sky. Deep sur-veys with these instruments were able to resolve up to few percent (1 −2%) of the total CXB above 10 keV (Churazov et al., 2007; Krivonos et al., 2007; Ajello et al., 2008; Bur-lon et al., 2011; Vasudevan, Mushotzky, and Gandhi, 2013; Ricci et al., 2015; Akylas et al., 2016; Koss et al., 2016), but the picture changed with the advent of the Nuclear Spectroscopic Telescope Array (NuSTAR).
1.3
The
Nuclear Spectroscopic Telescope Array
NuSTAR, launched in 2012 (Harrison et al., 2013), is the first focusing hard X-ray telescope, and as such represented a quantum leap forward in hard X-ray astronomy. It operates between 3 and 78 keV, and is equipped with an array of eight CdZnTe detectors separated in two focal plane modules (FPMA and FPMB, respectively). A sketch of the NuSTAR instrument is presented in Figure 1.6.
Thanks to its innovative focusing optics, NuSTAR gained a factor of ∼ 100 in sensitivity with respect to coded-mask instruments. As of today, NuSTAR is the only instrument to extend the focusing capabilities beyond 10 keV (see Figure 1.7). With a point spread function (PSF) of half-power diameter (HPD) of 5800, and a full width at half maximum (FWHM) of 1800, imaging in the hard X-ray band with a reasonable spatial accuracy has become possible. The drawback of such novel technology has been a rather high background affecting deep observations, since the NuSTAR metallic mast, when fully deployed in orbit, prevents the optics to be perfectly screened by leaking photons.
1.3. The Nuclear Spectroscopic Telescope Array 9
FIGURE1.6: Sketch of the NuSTAR instrument. The top figure shows the final configuration of the telescope, with the metallic mast extended once it reached its orbit. The bottom figure shows a zoom of the focal plane, where the couple of four-chips CdZnTe detectors lies. Figure
adapted from Harrison et al. (2013).
In particular, as explained in Wik et al. (2014) and as shown in Figure 1.8, the NuSTAR background is the sum of different components: below 20 keV, its signal is dominated by photons which are not focused by the mirrors and leak through the open structure of the telescope producing a spatially-dependent pattern (i.e., aperture background). There are also solar photons, a neutron background, and a minor contribution from the focused, but unresolved, sources of the CXB (i.e., fCXB). Above ∼ 20 keV, the back-ground is instrumental, and is composed of a nearly flat power law (Γ ≈ 0) with a forest of activation lines, most notably between ∼ 25 − 35 keV.
One of the primary scientific goals of the NuSTAR mission is to study both local and distant AGN, mainly looking for CT AGN with the aim of directly detecting the contrib-utors to the CXB peak at ∼ 20 − 30 keV. NuSTAR is the optimal instrument to tackle these tasks, thanks to its high-energy bandpass which makes it less biased to absorp-tion with respect to low energy instruments. To reach this key science goal, a series of Extragalactic surveys have been undertaken, both in the local (z < 0.5) and distant (z&1) Universe. In the local Universe, together with some pilot studies on nearby and well-known CT AGN, such as Circinus (Arévalo et al., 2014), NGC1068 (Bauer et al., 2015) and NGC4945 (Puccetti et al., 2014), a survey of ∼ 100 bright AGN detected by Swift-BAT was conducted (see Balokovi´c et al., 2014, for some early results; Balokovi´c et al., in prep). In particular, a subsample of these bright, local AGN is composed by water megamasers, on which we are going to focus in the next Chapter. NuSTAR is
FIGURE 1.7: NuSTAR effective area as a function of energy (orange line), compared with other focusing optics. NuSTAR overlaps with XMM-Newton, Chandra, Suzaku and Swift-XRT in the soft X-ray en-ergy band, extending the focusing capabilities beyond 10 keV. Figure
adapted from Harrison et al. (2013).
now beginning a new survey in the local Universe, called NuLANDS, with the aim of obtaining an unbiased view of the local absorption distribution of AGN (Boorman et al., in prep).
As of the deep Extragalactic surveys, a wedding-cake approach has been adopted, from a wide area, shallow survey of the COSMOS field (Civano et al., 2015), up to a deep survey of the ECDFS field (Mullaney et al., 2015). An important role is also played by the Serendipitous survey (Alexander et al., 2013; Lansbury et al., 2017b), which recently released its 40-month Catalog (Lansbury et al., 2017b). Other surveys of well-known, multi-wavelength deep fields include the EGS (Aird et al., in prep), CDFN (Del Moro et al., in prep), and UKIDSS-UDS (Masini et al., submitted) surveys.
To date, the surveys undertaken by NuSTAR both in the local and distant Universe provided, among others, important results in the understanding of the physics of ob-scured AGN. For example, detailed spectral analysis of the high signal-to-noise ratio (SNR) spectra of nearby CT AGN revealed the complexity of the absorbing medium, which is often described as a sum of different absorbing layers (Bauer et al., 2015), or with spatially decoupled reflection and transmission components (Arévalo et al., 2014). Moreover, the detection for the first time of hard X-ray variability, likely due to the in-trinsic continuum piercing through the patchy torus, gave a remarkable evidence for
1.3. The Nuclear Spectroscopic Telescope Array 11
FIGURE1.8: The NuSTAR background (black for FPMA, red for FPMB)
is made up of different contributions, arising from solar, aperture, focused but unresolved CXB, and instrumental components. Figure
adapted from Wik et al. (2014).
the clumpiness of the obscuring structure around AGN (Puccetti et al., 2014; Marin-ucci et al., 2016). On the other hand, the NuSTAR deep extragalactic surveys have so far resolved the ∼ 35% of the CXB in the NuSTAR hard (8 − 24 keV) band (Harrison et al., 2016), and allowed the first direct measurement of the > 10 keV X-ray luminosity function (LF) to be measured at z > 0.1 (Aird et al., 2015), together with providing a less biased view on the distant AGN population as a whole.
In the next Chapters, we are going to discuss in greater detail the NuSTAR contribu-tion in the search and study of CT AGN, going from the local to the distant Universe.
13
Chapter
2
Obscured AGN with NuSTAR −
The local Universe
In this Chapter, the NuSTAR view of obscured and Compton-thick AGN in the local Universe is presented. Such objects are an important laboratory and test ground for AGN physics, in order to understand the properties and signature of heavy obscuration around SMBHs.
After a general introduction on X-ray spectroscopy, which is the main tool used to per-form data analysis throughout this Thesis, the discussion will focus on megamasers, which are a optimal sample of local, heavily obscured AGN. The majority of disk mega-masers come with an exquisite measurement of their BH mass, and thanks to radio interferometric observations, allow to study the physics of the obscuring medium at the sub-pc scale. After compiling a sample with both high-quality radio and NuSTAR data, results of X-ray spectroscopy of the entire sample are presented, and an analytical toy model to explain the link between sub-pc scale megamaser disks and pc-scale obscur-ing tori is developed. In the last part of the Chapter, a few applications of the results obtained on megamasers to the physics of AGN are presented. This Chapter is mainly based on: “NuSTAR observations of water megamaser AGN”; Masini, A., Comastri, A., Balokovi´c, M., Zaw, I., et al.; 2016; A&A; 589, A59.
2.1
A discussion on X-ray spectroscopy
Throughout this Thesis, the spectral analysis is always carried out using the XSPEC software (Arnaud, 1996), which allows visualization, modeling and fitting of X-ray spectra. The usual procedure is to start fitting the spectra with simple power law models for an initial visual inspection of the broadband spectral curvature and X-ray absorption. One then builds up more complex models, motivated by the presence of typical features such as the Compton hump, the iron line(s), the high-energy cutoff, the soft excess, and so on (see Section 1.2.1 for a discussion on the principal compo-nents contributing to the X-ray emission from an AGN).
2.1.1 Phenomenological models for X-ray spectroscopy
Many models have been developed in the past years to explain and fit the X-ray spectra of AGN, regardless the level of obscuration. One of the advantages of these models is that they are relatively fast and easy to implement. Moreover, they are employed to make comparison with previous result in the literature. Some of the most commonly used phenomenological models when dealing with Seyfert 2 AGN (i.e., obscured AGN) includeplcabs(Yaqoob, 1997) andpexrav(Magdziarz and Zdziarski, 1995), to model the hard X-ray continua. The former describes X-ray transmission of an intrinsic power law with an exponential cutoff through an obscuring medium, taking the effects of Compton scattering into account. However, it is limited to ∼ 15 − 20 keV depending on the exact value of the column density. The latter models Compton reflection on a slab of neutral material with infinite optical depth, and provides a good approximation for the reflection from the accretion disk.
1
2
5
10
20
10
−510
−410
−3keV
2(Photons cm
−2s
−1keV
−1)
Energy (keV)
FIGURE 2.1: Example of a phenomenological model for a typical
Compton-thick spectrum (NH= 1024cm−2) between 1−50 keV. The pho-ton index isΓ= 1.8 and the fraction of scattered power law is 1%. The transmitted primary power law (plcabs), the reflection/fluorescence components (pexravandzgauss), and the scattered power law are la-beled as the dashed, dot-dashed and dotted lines, respectively. The total spectrum is the solid black line. Note that the normalizations are quite arbitrary, since the models are independent. We adopted here a nor-malization for the reflection component a factor of two lower than the
transmitted one, i.e. a reflection parameter R = 0.5.
2.1. A discussion on X-ray spectroscopy 15
to obscured AGN spectra; however, one should always check that the ad-hoc combi-nation of such models does not violate any basic physical principle (like the energy conservation law, for example, having more reflected emission of the primary one). Moreover, as pointed out by Murphy and Yaqoob (2009), using plcabs and pexrav
may produce a bias toward fits dominated by the direct continuum. Results obtained with such phenomenological models need to be tested against more self-consistent and physically motivated models.
2.1.2 Toroidal models for X-ray spectroscopy
A bunch of such physically motivated models, based on Monte Carlo simulations, have been developed in the last decade, but only a couple of them are publicly available to date, like MYTorus (Murphy and Yaqoob, 2009) and Torus (Brightman and Nan-dra, 2011). Despite having slightly different geometries (sketches of the two models are shown in Figure 2.2), free parameters and implementations, they both model the hard X-ray spectrum emitted through a toroidal reprocessor, consisting of a transmit-ted continuum (photons passing through the torus without interacting), a scattered or reflected component that is made up of photons that interact with matter via Compton scattering, and emission lines (mostly iron Kαand Kβ).
(A)
(B)
FIGURE2.2: (A). Sketch of theMYTorusmodel, with the most impor-tant parameters labeled. The geometry is fixed, with an half-opening angle of 60°, equivalent to c/a = 2. Notice that the line of sight NHis dif-ferent from the equatorial NH, unlessθobs= 90°. Figure adapted from Murphy and Yaqoob (2009). (B). Sketch of theTorusmodel, where the absorbing medium is arranged as a sphere without two polar bicones. Two angles are then defined, which are labeled in the figure asθtor(i.e., the half-opening angle of the torus) andθobs(i.e., the inclination of the system with respect to an external observer). The different shadings do not indicate different density, which is assumed uniform instead.
1
2
5
10
20
10
−510
−410
−3keV
2(Photons cm
−2s
−1keV
−1)
Energy (keV)
FIGURE 2.3: Same parameters and conventions of Figure 2.1, but
adopting a default MYTorus model with θobs= 90°. Only one normal-ization is needed here, because all the components are self-consistently
computed.
MYTorusallows a dynamic decoupling of these three components to simulate differ-ent geometries. It can be used in its default configuration (“MYToruscoupled”, Figure 2.2a), modeling a classical “donut-shaped” toroidal reprocessor with a fixed covering factor of 0.5 (i.e., the half-opening angleθtorof the torus is 60°, measured as the angle between the axis of the system and the edge of the torus itself; see Figure 2.3 for an example), or in a more complex way, called “MYTorusdecoupled”.
The total X-ray emission reaching a distant observer suffers of attenuation (pho-toelectric absorption and scattering) by the intervening screen of matter, proportional to e−τ, whereτis the optical depth of the absorbing medium. However, also photons which would not reach the observer are randomly scattered inside the line of sight by the same processes, contributing to the total emission. In addition to this transmitted and scattered radiation through the obscuring medium, part of the reflection from the inner far side of the reprocessor may not intercept the material on the near side of it. In this case, the far-side reflection, at least below ∼ 10 keV, can dominate the ob-served spectrum. This physical situation is parameterized decoupling the inclination angles of the transmitted and scattered components of theMYTorusmodel, as sketched in Figure 2.4. Even if the attenuation and scattering into the line of sight share the same physical process, they are distinct in theMYTorus model, and result in two dif-ferent spectral shapes. The forward-scattered emission and associated emission lines
2.1. A discussion on X-ray spectroscopy 17
FIGURE 2.4: Sketch of how a particular physical situation (e.g. a patchy and clumpy torus) can be modeled with a decoupled MYTorus
model. Figure adapted from Yaqoob (2012).
are approximated using aMYTorusedge-on reflection spectrum, obtained by fixingθobs to 90° (green line in Figure 2.4), while theMYTorusface-on reflection spectrum is mod-eled by fixing the inclination angle of the systemθobs to 0° (blue line in Figure 2.4). The relative strength of these two components (front and back-scattered) is encoded in two constants, namely AS90and AS00, which are left free to vary. Their respective line components for this geometry are normalized with AL90and AL00. In the most general case, the column density NHobscuring the direct continuum can be decoupled from the column density responsible for the back reflection or the forward reflection or both. A single NHvalue is often adopted for the sake of simplicity, but see Yaqoob (2012) for an exhaustive example of the use of the model in its decoupled mode. This decoupled configuration allows to simulate different geometries and covering factors with respect to the default one ofMYTorus, although it is difficult to compute the covering factor of any specific situation.
On the other hand, theTorusmodel does not decouple the three components, but has the opening angle (allowing the measurement of the covering factor; e.g., Brightman et al., 2015) and the iron abundance as free parameters. In the following, we always assume a nearly edge-on inclination of the reprocessor (i.e., we fix the inclination angle of the system,θobs, to ∼ 90°), even if the toroidal geometry is slightly different between the two models1.
1As pointed out by Liu and Li (2015), en edge-onTorusmodel in a CT regime may overestimate the
Finally, to model the aforementioned scattered power law at low energies, the general procedure is to tie all the power law parameters to the primary one (i.e., photon index, redshift, normalization) and multiply it by a constant, namely fs, which is a free pa-rameter in the fit that quantifies the fraction of the primary power law scattered at low energies.
2.2
The NuSTAR survey of bright
Swift-BAT AGN
As already discussed in Section 1.3, in the last few years, NuSTAR began a compre-hensive program of hard X-ray surveys, both Galactic (e.g, Mori et al., 2015; Tomsick et al., 2017; Fornasini et al., 2017) and Extragalactic (e.g., Civano et al., 2015; Mul-laney et al., 2015; Lansbury et al., 2017b).
As part of its Extragalactic Survey program, a survey of ∼ 100 bright AGN detected by Swift-BAT was also conducted (see Balokovi´c et al., 2014, for some early results; Balokovi´c et al., in prep). In particular, a subsample of these bright, local AGN is com-posed by water megamasers.
This class of objects is particularly interesting because of an observed empirical corre-lation between high obscuration and detected maser emission at ∼ 22 GHz.
2.3
Megamasers
A maser is, in analogy with a laser, a physical phenomenon in which a background radi-ation field stimulates emission by a populradi-ation of properly excited atoms or molecules. The difference between the well known laser and a maser is about the frequency at which the emission happens: lasers are in the optical band, masers in the microwaves. Consider an atom excited in a metastable energy level: if an incoming photon has the right frequencyν, and the right energy Eν= hνequal to the energy difference between the metastable and stable energy levels, the atom will be stimulated to relax in the stable energy level, emitting a second photon with the same frequency, phase and di-rection of the incoming one. This phenomenon is well known since a century, and was first studied by Einstein (1916).
Masers were first studied in laboratory, and then discovered in astrophysical sources. The first ones were hydroxyl and water masers, associated to protostars, HII regions and molecular clouds within the Milky Way (Perkins, Gold, and Salpeter, 1966; Litvak, 1969). Such masers were classified as masers or kilomasers, based on their isotropic luminosity with respect to the solar luminosity, of the order of 103 L¯. Later on, OH and H2O extragalactic masers were discovered (Churchwell et al., 1977), and were classified as megamasers, having an isotropic luminosity L > 106 L¯. Megamasers were usually spatially coincident with the nuclei of those galaxies in which they were residing. Due to its nature, the maser emission requires no thermodynamical equi-librium in a population of atoms or molecules, which has to be energetically pumped
2.3. Megamasers 19
(i.e., with molecules in a metastable excited state). In particular, precise physical con-ditions must be met in order to have non-thermal equilibrium, which depend on the masing molecule; for the water molecule, high density and temperature are required (107< nH< 1011 cm−3, 400 < T < 1000 K; see Lo, 2005). In addition to these physical conditions, the geometry of the system plays a crucial role, since the gain of the stimu-lated emission depends on the path length. This is due to the very nature of stimustimu-lated emission, since the emitted photon has the same direction of the incoming one, rapidly giving rise to a narrow beam of photons that, in turn, stimulates the emission of other photons in the same direction.
In general, water megamasers are due to a rotovibrational transition of the H2O molecule at 22.23 GHz. Many other transitions are possible at different frequencies, but in this Thesis we are going to focus on 22 GHz water megamasers. They were associ-ated to some sort of nuclear activity since their discovery in the late seventies, and became gradually more and more studied. Nowadays, depending on their geometry, three types of water megamasers are known: jet megamasers, outflow megamasers, and disk megamasers (see Tarchi, 2012, for a review).
2.3.1 Disk megamasers
The typical spectral signature for the presence of a disk megamaser is a triple-peaked profile of the 22 GHz maser line, where the principal peak, called the systemic one, is redshifted at the systemic velocity of the galaxy, while other two smaller peaks (or, better, line complexes) symmetrically bracket the systemic one, equally redshifted and blueshifted from it. These two secondary peaks are called high-velocity peaks and are interpreted as the signature of an edge-on rotating disk. Such structures rapidly gained the scientific interest of a large community, since they provide evidence for ro-tating molecular clouds around massive central objects. Being the tracers of accretion of molecular disks onto compact objects at the sub-pc scale, the physics and geometry of accretion can be studied with unprecedented detail up to Mpc distances. Moreover, the maser spots sometimes follow a Keplerian rotation curve (with NGC4258 being the archetypal system), allowing the enclosed mass to be precisely computed. Disk mega-masers represent today the “golden standard” for SMBHs masses, and by monitoring the systemic maser spots, also the geometric distance to the host galaxy can be mea-sured with a precision as high as ∼ 3% without assuming any cosmological model (e.g., Reid et al., 2013). The Megamaser Cosmology Project2 (MCP) aims at using a clean sample of megamaser disks to get a cosmology-independent estimate of the Hubble constant H0. Figure 2.5 shows the maser spectrum of one of the latest disks discov-ered by the MCP, NGC5765B (Gao et al., 2016), while Figure 2.6a and 2.6b show the VLBI map and Position-Velocity (P-V) diagram, respectively. The VLBI map shows a clear thin disk with an edge-on geometry structure, where the spots are color-coded by
their Local Standard Rest (LSR) velocity. In the P-V diagram, the Keplerian rotation of the blue and redshifted spots is demonstrated.
FIGURE2.5: Maser spectrum of NGC5765B, where the systemic peak
stands in the middle of other two complexes, called high-velocity peaks, zoomed into the two insets. Note that each of the peaks represents a so-called maser spot, presumably a molecular cloud rotating and emitting water maser emission. Such a triple-peaked spectrum is the evidence for an edge-on rotating disk. Figure adapted from Gao et al. (2016).
2.4
Disk Megamasers and SMBHs demographics
The scientific interest for water megamasers with a disk geometry is not limited to cos-mology, but also extends to galaxy evolution and SMBHs demographics. Recently, disk megamasers started to catch the interest of a larger and larger community, thanks to their “golden” measurements of masses (van den Bosch et al., 2016). These particular megamasers are always found in late type spiral galaxies, often with a circumnuclear bar and/or a nuclear pseudobulge. Moreover, disk megamasers are found around low-mass SMBHs (MBH≤ 107), and are systematically offset by the famous and already mentioned MBH−σ∗ relation (Greene et al., 2016). Megamasers become then more and more important as their number grows, to calibrate the MBH−σ∗ relation, or to explore its universality. Moreover, precise masses from megamasers can be used to cross-calibrate different methods to calculate SMBH masses (e.g., reverberation map-ping, gas/stellar dynamics) and better study systematics in each method.
2.5. Disk Megamasers and obscured AGN 21
(A) (B)
FIGURE 2.6: (A). VLBI map of the maser spots in NGC5765b, color-coded by their local standard rest (LSR) velocities. The green spots mark the systemic masers, while the blue and red spots mark the high-velocity features. The geometry is of an edge-on thin disk. (B). Position-velocity (P-V) diagram of the detected maser spots in NGC5765b. The fits to the high-velocity spots are of a Keplerian rotation curve. Figures
adapted from Gao et al. (2016).
2.5
Disk Megamasers and obscured AGN
From the point of view of AGN, there is strong evidence that water megamasers with a disk geometry tend to be found in Seyfert 2 (Sy2) galaxies and, in particular, in Compton-thick ones (Greenhill, Tilak, and Madejski, 2008), which according to the AGN unification scheme, are likely to be those where the obscuring structure is seen nearly edge-on. Their importance in modern astrophysics has been already discussed in Section 1.2.2.
High-quality hard X-ray (> 10 keV) data coupled with high-resolution radio maps of the nuclear emission allow new studies of the physics of obscured AGN. Some previous work concentrated on the connection between masing activity and high obscuring col-umn densities in active nuclei, identifying some general and phenomenological results (Greenhill, Tilak, and Madejski, 2008; Castangia et al., 2013). However, many ques-tions are still unanswered. Physical condiques-tions, such as the temperature, density, and pressure of matter in the vicinity of the SMBH, are still uncertain. It is not completely clear whether the maser emission is associated with the outer part of the accretion disk or if it is part of the toroidal structure obscuring the nucleus along our line of sight.
Chapter 2. Obscured AGN with NuST AR − The local Universe
Puccetti et al. (2014). (6) - AGN central mass. (7) - References for column (6): Gre03 - Greenhill et al. (2003); Til08 - Tilak et al. (2008); Kon08 - Kondratko, Greenhill, and Moran (2008); Kuo11 - Kuo et al. (2011); Lod03 - Lodato and Bertin (2003); McC13 - McConnell and Ma (2013); Yam12 - Yamauchi et al. (2012). (8) - Dust sublimation radius, calculated using the relation from Gandhi et al. (2009). See §2.7 for details. (9) Maser disk inner and outer radii. (10) References for column (9): Gre97 Greenhill, Moran, and Herrnstein (1997); Kon05
-Kondratko, Greenhill, and Moran (2005).
Name z NH log(L2−10) Ref. MBH Ref. Rd Disk size Ref.
[1024cm−2] [erg s−1] [106M¯] [pc] [pc]
(1) (2) (3) (4) (5) (6) (7) (8) (9) (10)
NGC 1068 0.0038 > 5.6 43.34 Bau15 8.0 ± 0.3 Lod03 0.27 0.65 - 1.1 Gre97 NGC 1194 0.0136 1.4+0.3−0.2 42.78 this work 65 ± 3 Kuo11 0.14 0.54 - 1.33 Kuo11 NGC 1386 0.0029 5 ± 1 41.90 this work 1.2+1.1
−0.6 McC13
† 0.05 0.44 - 0.94 Til08 NGC 2273 0.0061 > 7.3 43.11 this work 7.5 ± 0.4 Kuo11 0.20 0.034 - 0.20 this work* NGC 2960 0.0165 0.5+0.4
−0.3 41.41 this work 11.6 ± 0.5 Kuo11 0.03 0.13 - 0.37 Kuo11 NGC 3079 0.0037 2.5 ± 0.3 42.15 this work 2.4+2.4−1.2 McC13† 0.07 0.4 - 1.3 Kon05 NGC 3393 0.0125 2.2+0.4−0.2 43.30 this work 31 ± 2 Kon08 0.25 0.17 - 1.5 Kon08 NGC 4388 0.0084 0.44 ± 0.06 42.59 this work 8.5 ± 0.2 Kuo11 0.11 0.24 - 0.29 Kuo11 NGC 4945 0.0019 3.5 ± 0.2 42.52 Puc14 1.4+0.7−0.5 McC13† 0.10 0.13 - 0.41 this work** IC 2560 0.0098 > 6.7 42.98 this work 3.5 ± 0.5 Yam12 0.17 0.087 - 0.335 Yam12 Circinus 0.0015 8.7 ± 1.5 42.57 Are14 1.7 ± 0.3 Gre03 0.11 0.11 - 0.4 Gre03 NGC 4258 0.0015 0.087 ± 0.003 41.2 Cas13 39 ± 3 Til08 0.02 0.12 - 0.28 Til08 NGC 6264 0.0340 > 1 42.6 Cas13 29.1 ± 0.4 Kuo11 0.11 0.24 - 0.80 Kuo11 UGC 3789 0.0109 > 1 42.3 Cas13 10.4 ± 0.5 Kuo11 0.08 0.084 - 0.30 Kuo11 †Maser method mass for which in the original paper an uncertainty is not provided. The error given by McConnell and Ma (2013) is overestimated.
††Error replaced by the average error of maser method; see §2.6.2. *New maser disk extension estimate from VLBI maps.
2.6. Data and spectral analysis 23
2.6
Data and spectral analysis
2.6.1 The sample
To build up a sample of disk megamaser sources with high-quality maser maps, precise black hole mass estimates, and hard X-ray spectral coverage, we cross-correlated a list of VLBI-mapped water megamasers from the Megamaser Cosmology Project3 (MCP, see Henkel et al., 2012) with NuSTAR observations and well known disk maser sources studied in the literature. We found 11 objects. We then enlarged the sample by adding three more sources with VLBI radio maps available, but lacking NuSTAR data (refer to Castangia et al., 2013, for X-ray and maser disk properties of these). The total sample is then composed of 14 sources, which are all the disk water megamasers known today with both precise VLBI maps and hard X-ray spectra. Their main properties are listed in Table 2.1. However, we emphasize that this is not a complete sample of all the water megamasers known today, which can be found in Pesce et al. (2015).
2.6.2 Data reduction
We present NuSTAR hard X-ray spectral results for 11 sources. In particular, we use archival data for NGC 1194, NGC 1386, NGC 2273, NGC 2960, NGC 3079, NGC 3393, NGC 4388, and IC 2560, for which observation dates and exposure times can be found in Table 2.2. For NGC 4945, NGC 1068, and the Circinus galaxy, spectral parameters are taken from Puccetti et al. (2014), Bauer et al. (2015), and Arévalo et al. (2014), respectively.
The raw events files were processed using the NuSTAR Data Analysis Software pack-age v. 1.4.1 (NuSTARDAS)4. Calibrated and cleaned event files were produced using the calibration files in the NuSTAR CALDB (20150225) and standard filtering criteria with thenupipelinetask. We used thenuproductstask included in the NuSTARDAS package to extract the NuSTAR source and background spectra using the appropriate response and ancillary files. We extracted spectra and light curves in each focal plane module using circular apertures of different radii, aimed at optimizing the signal-to-noise ratio at high energies for every source (see Balokovi´c et al. in prep., for further details). Background spectra were extracted using source-free regions on the same de-tector as the source. All spectra were binned to a minimum of 20 photons per bin using the HEAsoft taskgrppha.
NGC 1194
NGC 1194 is a nearby Seyfert 1.9 galaxy. It hosts a circumnuclear maser disk, which allowed a precise measurement of the BH mass of (6.5 ± 0.3) × 107 M¯ (Kuo et al., 2011). Fitting the spectrum with an absorbed power law using a Galactic column re-turns an uncharacteristically hard photon index (Γ ∼ 0.5) and leaves large residuals,
3http://safe.nrao.edu/wiki/bin/view/Main/PublicWaterMaserList