THE APPLICATION OF GC-C-IRMS TO THE
AUTHENTICATION AND CHARACTERISATION
OF FOODS AND BEVERAGES
Katryna A. van Leeuwen
Bachelor of Science (Hons)
A thesis submitted in fulfilment of the requirements for the degree of
Doctor of Philosophy.
Faculty of Science
School of Agricultural and Wine Sciences Charles Sturt University, Wagga Wagga
Australia
iii
TABLE OF CONTENTS
______________________________________________________________________
TABLE OF CONTENTS ………… iii
CERTIFICATE OF AUTHORSHIP ………… v
DEDICATION ………… vi
ACKNOWLEDGEMENTS ……….. vii
PAPERS AND MANUSCRIPTS FROM THIS THESIS ……….. viii
OTHER PUBLICATIONS ………… ix
AUTHOR CONTRIBUTION STATEMENTS ………… x
LIST OF ABBREVIATIONS ………… xi
ABSTRACT …………. 1
CHAPTER ONE …………. 3
AIMS AND OBJECTIVES …………. 4
INTRODUCTION …………. 5
REFERENCES ……….. 12
CHAPTER TWO ……….. 14
INTRODUCTORY COMMENTS ……….. 15
LITERATURE REVIEW ……….. 16
Paper 1 van Leeuwen, K. A., Prenzler, P.D., Ryan, D. & Camin, F. (2014). Gas Chromatography-Combustion-Isotope Ratio Mass Spectrometry for Traceability and Authenticity in Foods and Beverages. Comprehensive Reviews in Food Science and Food
Safety, 13(5): 814-837. DOI:10.1111/1541-4337.12096.
LITERATURE REVIEW UPDATE ……….. 40
REFERENCES ……….. 44
CHAPTER THREE ……….. 45
INTRODUCTORY COMMENTS ……….. 46
iv
Paper 2 van Leeuwen, K. A., Prenzler, P.D., Ryan, D., Paolini, M. & Camin, F. (2017). Differentiation of wood derived vanillin from synthetic vanillin in distillates implementing GC-C-IRMS for δ13C.
Submitted to Rapid Communications in Mass Spectrometry: 21 Jul 2017
Manuscript ID: RCM-17-0231
CHAPTER FOUR ..……… 78
INTRODUCTORY COMMENTS ……….. 79
RESEARCH PAPER ……….. 80
Paper 3 van Leeuwen, K.A., Camin, F., Jerónimo, E., Vasta, V., Prenzler, P. D., Ryan, D., & Bessa, R. J. B. (2017). Dietary effects on stable carbon isotope composition of polar and neutral fatty acids in the intramuscular fat of lambs. Journal of Agricultural and Food
Chemistry, Article ASAP. DOI:10.1021/acs.jafc.7b02999.
CHAPTER FIVE ………. 116
INTRODUCTORY COMMENTS ………. 117
REFERENCES ………. 119
RESEARCH PAPER ………. 120
Paper 4 van Leeuwen, K. A., Paolini, M., Laursen, K. H., Micheloni, C., Prenzler, P. D., Ryan, D., & Camin, F. (2017). Bulk H, C, N, O and S stable isotope ratios and δ15N and δ13C of amino acids for possible differentiation between organic and conventional tomatoes.
In the format of the journal: Journal of Agricultural Food Chemistry (To be submitted)
EXPERIMENTAL REPORT ………. 160
Report 1 Tomato fruit extraction of free amino acids
CHAPTER SIX ………. 184
CONCLUSIONS ………. 185
vi
DEDICATION
______________________________________________________________________
This thesis is dedicated to my husband and daughters for their love, support and belief in me during my PhD candidature.
And, to my father who passed away during my PhD candidature.
vii
ACKNOWLEDGEMENTS
______________________________________________________________________
This project has been funded with support from Fondazione Edmund Mach and from CSU and the EH Graham Centre for Agricultural Innovation.
I would like to thank and am very grateful for my supervisors, Assoc Prof Paul Prenzler and Dr Danielle Ryan from CSU and Dr Federica Camin from FEM, who guided me through the PhD process and were very understanding to my situation and difficulties while studying via a distance, in three different countries.
I would like thank all my isotope colleagues at FEM for attempting to teach me Italian and all I know about IRMS: Luana Bontempo, Matteo Perini, Mauro Paolini, Luca Ziller, Agostino Tonon, Marco Simoni and everyone else whom I have chatted with over coffee. I would like to thank everyone (Karryn Hann, Kamala Anggamuthu) at CSU who helped through the PhD process and to Marie Rose, Paul Burton and Michael Loughlin for technical assistance in the chemistry lab during my short stay in Wagga Wagga.
I would like to thank, finally yet importantly, my family in Australia, Italy and my adopted family in New Zealand for all their support throughout my candidature.
viii
PAPERS AND MANUSCRIPTS FROM THIS THESIS
______________________________________________________________________
Paper 1. van Leeuwen, K. A., Prenzler, P.D., Ryan, D., & Camin, F. (2014). Gas chromatography-combustion-isotope ratio mass spectrometry for traceability and authenticity in foods and beverages. Comprehensive
Reviews in Food Science and Food Safety, 13(5): 814-837.
DOI:10.1111/1541-4337.12096.
Submitted to Comprehensive Reviews in Food Science and Food Safety: 2 Jun 2014
Accepted: 5 Dec 2014
Published online: 19 Aug 2014
Paper 2. van Leeuwen, K. A., Prenzler, P.D., Ryan, D., Paolini, M., & Camin, F. (2017). Differentiation of wood derived vanillin from synthetic vanillin in distillates implementing GC-C-IRMS for δ13C.
Submitted to Rapid Communications in Mass Spectrometry: 21 Jul 2017
Manuscript ID: RCM-17-0231
Paper 3. van Leeuwen, K.A., Camin, F., Jerónimo, E., Vasta, V., Prenzler, P. D., Ryan, D., & Bessa, R. J. B. (2017). Dietary effects on stable carbon isotope composition of fatty acids in polar and neutral fractions of intramuscular fat of lambs. Journal of Agricultural and Food Chemistry, Article ASAP. DOI:10.1021/acs.jafc.7b02999.
Submitted to Journal of Agricultural and Food Chemistry: 29 Jun 2017
Accepted: 3 Oct 2017
Published online: 3 Oct 2017
Paper 4. van Leeuwen, K. A., Paolini, M., Laursen, K. H., Micheloni, C., Prenzler, P. D., Ryan, D., & Camin, F. (2017). Bulk H, C, N, O and S stable isotope ratios and δ15N and δ13C of amino acids for possible differentiation between organic and conventional tomatoes.
In the format of the journal: Journal of Agricultural Food Chemistry
ix
OTHER PUBLICATIONS
______________________________________________________________________
1. van Leeuwen, K. A., Ryan, D., Prenzler, P.D. & Camin, F. (2014)
Research: Chemistry creating consumer certainty. Chemistry in Australia, ISSN: 0314-4240.
http://search.informit.com.au/documentSummary;dn=703739875085563;res=IE LAPA
xi LIST OF ABBREVIATIONS ______________________________________________________________________ ‰ – “per mil” 15:0 – pentadecanoic acid 16:0 – palmitic acid 17:0 – heptadecanoic acid 18:0 – stearic acid
18:1 cis-11 – cis-11-octadecenoic acid
18:1 cis-9 – oleic acid
18:2n-6 – linoleic acids 18:3n-3 – α-linolenic acid 1σ – standard deviation 2σ – measurement of uncertainty 5-HMF – 5-hydroxymethylfurfural AA – atomic absorption Ala – alanine
ANOVA – one-way analysis of variance
Asn – asparagine
Asp – aspartate
xii C – carbon
C. ladanifer – Cistus ladanifer
C0 – control diet
C3 – Calvin photosynthetic pathway
C4 – Hatch-Slack photosynthetic pathway
C6 – diet supplemented with oil
CAM – Crassulacean acid metabolism photosynthetic pathway
CAP – Common Agricultural Policy
CBS – Caribou Hoof Standard
CD – spectrophotometry
CL0 – diet with Cistus ladanifer
CL6 – diet with both oil and Cistus ladanifer
CLA – conjugated linoleic acid
CO2 – carbon dioxide
Conv – conventional
corr – corrected
CSIA – compound specific isotopic analysis
DM – dry matter
EA-IRMS – elemental analyser-isotope ratio mass spectrometry
EC – European Commission
xiii EEC – European Economic Community
EI – electron impact ionization
ER – Emilia Romagna
Es-GC – enantioselective-gas chromatography
EtOH:pyr – ethanol:pyridine
EU – European Union
FA – fatty acid(s)
FAME – fatty acid methyl ester(s)
FID – flame ionisation detector
GABA – γ-aminobutyric acid GC – gas chromatography
GC-C-IRMS – gas chromatography-combustion-isotope ratio mass spectrometry
GC-MS or GC/MS – gas chromatography-mass spectrometry
GC-P-IRMS – gas chromatography-pyrolysis-isotope ratio mass spectrometry
Gln – glutamine
Glu – glutamic acid
Glx – glutamate and glutamine combined
Gly – glycine
GMO – genetically modified organisms
H – hydrogen
xiv He – helium
HPLC – high-performace liquid chromatography
HR-NMR – high-resolution-nuclear magnetic resonance spectroscopy
HSD – Honest Significant Difference
HS-SPME – headspace-solid phase microextraction
IAEA – International Atomic Energy Agency
ICP-AES – inductively coupled plasma atomic emission spectroscopy
i-IST – internal isotopic standard
Ileu – isoleucine
IR – infrared spectroscopy
IRMS – isotope ratio mass spectrometry
iSTD – internal standard
KHS – Kudu Horn Standard
LC-PUFA – long chain-polyunsaturated fatty acids
Leu – leucine
MDGC – multidimensional gas chromatography
me-15:0 – methyl pentadecanoate
me-16:0 – methyl palmitate
me-17:0 – methyl heptadecanoate
me-18:0 – methyl stearate
xv me-18:1 cis-9 – methyl oleate
me-18:2n-6 – methyl linoleate
me-18:3n-3 – methyl linolenate
MNM – methyl N-methylanthranilate MS – mass spectrometry N – nitrogen N2 – nitrogen nd – not detected NH4+ – ammonium NL – neutral lipids Nleu – norleucine NO3- – nitrate
NOP – National Organic Program
Nval – norvaline
O – oxygen
O2 – oxygen
Org – organic
PC – principal component
PCA – principal component analysis
PDO – protected denomination of origin
xvi Phe – phenylalanine
PL – polar lipids
Pro – proline
Proc MIXED – MIXED procedure
PUFA – polyunsaturated fatty acids
RuBisCO – ribulose-1,5-biphosphate carboxylase/oxygenase
S – sulphur
SD – standard deviation
SEM – standard error of means
Ser – serine
SFA – saturated fatty acids
SNIF-NMR – site-specific isotopic fractionation nuclear magnetic resonance spectroscopy
SPME – solid phase microextraction
Thr – threonine
TSG – traditional specialty guaranteed
UN – unstructured covariance
Val – valine
VCDT – Vienna Canyon Diablo Troilite
V-PDB – Vienna Pee Dee Belemnite
xvii δ – delta
δ13C – stable isotope ratio of carbon expression, 13C/12C δ15N – stable isotope ratio of nitrogen expression, 15N/14N δ18O – stable isotope ratio of oxygen expression, 18O/16O δ2H – stable isotope ratio of hydrogen expression, 2H/1H δ34S – stable isotope ratio of oxygen expression, 34S/32S
1
ABSTRACT
______________________________________________________________________ Traceability and authenticity perform an important role in keeping the food and beverage industries honest for the protection of the general consumer and for the decent producer. The process to investigate the authenticity and traceability of food and beverages is through analytical techniques and methods. One such technique is the gas chromatography-combustion-isotope ratio mass spectrometry (GC-C-IRMS) and compound specific isotopic analysis (CSIA) to analyse different compounds in a variety of matrices, as the name suggests, for isotope ratios of C and N.
The purpose of this thesis was the implementation GC-C-IRMS to develop methods to detect adulterations in distillates using δ13C for vanillin; to trace dietary effects on intramuscular fat in sheep using δ13C of fatty acid methyl esters; and to differentiate between different farming systems (organic vs. conventional) with δ13C and δ15N of amino acids from tomatoes.
The first study was the development of a method for a single compound, vanillin, for δ13C. The determination of whether a distillate has been adulterated, by the addition of synthetic vanillin, to enhance the overall quality of the beverage could be detected. Vanillin ranges were determined and compared with those in literature for synthetic, natural and ex-lignin vanillin. Distillate samples, rum, whisky etc, were analysed for their δ13C vanillin value, which were compared against the determined vanillin ranges. The vanillin in 32 distillates were in the δ13C range for ex-lignin, there was one spirit, however, which was found to have synthetic vanillin.
2
The second study was of greater analytical complexity than the first study as 4 fatty acids (FA) δ13C values were analysed in polar (PL) and neutral (NL) lipids of the intramuscular fat of lambs. The lambs (24) were fed 4 different diets supplemented with oil and Cistus
ladanifer L. (a tanniferous shrub). The research question was to understand whether the
increase in intramuscular fat for lambs fed a diet supplemented with both oil and C.
ladanifer, could be explained mostly by the incorporation of diet preformed FA or by
increased de novo FA synthesis. It was shown that, with respect to 16:0, the increase of intramuscular FA was due to continual de novo FA synthesis for lambs fed a diet supplemented with oil and C. ladanifer. The results also showed that diets supplemented with oil prevented de novo FA synthesis from occurring; therefore, the inclusion of C.
ladanifer to the diet repressed the oil effect.
The last study, of even greater analytical complexity, focussed on the analysis of 9 amino
acids δ15N and δ13C values for the differentiation between tomatoes grown organically and conventionally. Amino acids are involved in many metabolic pathways in the plant; therefore, tracing the N uptake from the fertilizer to the plant and subsequent fruit could be possible. Glx functioned as an internal standard to remove the effects of external factors. The analysis of the amino acids Ala, Val, Ileu, Leu, Gly, Pro, Thr, Glx and Phe
for δ15N and δ13C with particular focus on Glx for δ13C, provided separation between tomatoes grown organically and tomatoes grown conventionally.
3
CHAPTER ONE
______________________________________________________________________
AIMS & OBJECTIVES INTRODUCTION REFERENCES
4
AIMS & OBJECTIVES
______________________________________________________________________ The overall aim of this study was to develop analytical methods for the authentication and characterisation of food and beverage matrices by measuring isotopic ratios of C and N using gas chromatography-combustion-isotope ratio mass spectrometry (GC-C-IRMS). Having extensively reviewed the literature, it was apparent that there were several more areas of the application of GC-C-IRMS that could be explored with regards to food and beverage authentication. In order to advance knowledge in this field of study, these applications needed to include analytical challenges due to matrix effects, chromatographic effects (particularly baseline separation of analytes); and sample preparation and derivatisation, which in GC-C-IRMS can introduce fractionation. Thus, three objectives were chosen covering these different aspects of methodological development and application:
1. To develop a δ13C GC-C-IRMS method to enable differentiation of natural and synthetic vanillin in a variety of distillates for detection of beverage adulteration.
2. To determine, using δ13C, if fatty acids (FA) in the intramuscular fat of lambs fed with four different dietary regimes were produced due to a higher de novo synthesis or due to a higher accumulation of dietary fat.
3. To differentiate tomato fruits grown under conventional and organic farming regimes by analysis of the δ15N composition of amino acids within the fruits.
5
INTRODUCTION
______________________________________________________________________ The authenticity, traceability and nutritional quality of food and beverages is becoming increasingly important around the world. There are many reasons for this for example food related illnesses and diseases have become more widespread and the use of genetically modified organisms (GMO) in foods are more prevalent. Also, consumers are increasingly aware of the food chain process and desire food grown organically rather than conventionally. Likewise the interest in high quality and authentic products as defined as PDO, PGI and TSG (protected denomination of origin, protected geographical origin and traditional specialty guaranteed, respectively) is strengthening. Finally as our understanding of the links between diet and health improves, consumers are increasingly interested in foods and beverages with the potential to lead to better health outcomes. An example of this is the research that shows that different lipids in the diet can have profound effects on susceptibility to certain diseases, such as heart disease, leading to dietary advice and consumer demands for certain types of lipids.
Food and beverages of high quality are more costly to produce, and these costs are then passed on to the consumer. Producers of foods and beverages of inferior quality, produced at a lower cost, could therefore be tempted to adulterate by the addition on flavour/aroma compounds to their produce to simulate high quality produce that demand higher market prices. This type of activity is fraudulent and is termed as adulteration. There are numerous other ways in which food and beverages can be adulterated, such as misrepresentation and/or mislabelling, substitution with an inferior product and extending a product via the supplementation of permissible additives with subsequent non-disclosure of such additives. Adulterations of products could pose serious health risks to consumers and loss of trust in the product for the consumer. To protect the consumer and
6
the producer, the European Union has set strict controls (EU Directive 79/112/EEC & Directive 2000/13/EC) to address the problem of adulteration of foods and beverages.
Traceability of food and beverages facilitates the production process of the foodstuffs to be followed from beginning (farm) to end (retailer). This process ensures confidence in the product for the consumer. Moreover, if a foodstuff was contaminated, being able to trace the production process for that foodstuff would allow the determination of the source of the contamination. Indeed the provision of the European Regulation EC, 178/2002 aims to eliminate all inequitable and counterfeit products for the benefit and the protection of both the consumer and producer.
However, while EU directives and regulations provide a legislative framework, implementation requires the availability of analytical methodologies capable of detecting fraudulent activity. Moreover, with increased consumer demand for healthy products (as mentioned above), analytical methods that are also capable of providing more information on the nutritional quality of food, are needed. This thesis will examine the possibilities that gas chromatography-combustion-isotope ratio mass spectrometry (GC-C-IRMS) offers in terms of determining food authenticity and nutritional quality. This will be achieved via three well-defined studies as outlined below. It should be noted that the versatility of GC-C-IRMS is demonstrated through studies of increasing analytical complexity as well as covering both authenticity and nutritional quality aspects, of importance to consumers. The studies, in increasing order of complexity, are:
• the determination of isotope ratios for a single element (carbon), for a single compound (vanillin), to determine if adulteration of spirits can be detected;
7
• the determination of isotope ratios for a single element (carbon), for a class of related compounds (fatty acid methyl esters), to determine if diet can influence the nutritional quality of lamb;
• the determination of isotope ratios for multiple elements (esp. carbon and nitrogen), for chemically varied compounds (amino acids), to determine if organically grown tomatoes can be distinguished from those grown by conventional methods.
Analysis of spirits
Of major concern for the beverage industry is the addition of flavour/aroma compounds to the beverage as it presents a loss of income for authentic producers. Additions of characteristic flavours and aromas to specific beverages can be especially difficult to detect and requires state of the art analytical instrumentation such as mass spectrometry based isotopic ratio instrumentation. Of late, GC-C-IRMS for δ13C has been used to analyse for compounds characteristic to certain beverages, such as citrus liqueurs for monoterpene adulteration (Schipilliti, Bonaccorsi, Cotroneo, Dugo, & Mondello, 2013). GC-C-IRMS enables the analysis of single compounds (compound specific isotope analysis; CSIA) in a matrix whereas IRMS analyses the whole sample. The benefit of GC-C-IRMS is that compounds can be analysed separately for their isotopic ratios within a matrix and therefore if a compound was added to a matrix it would have a different isotope ratio to that of the matrix due to their different mechanisms of formation. Usually, with adulteration of a product to influence aroma/flavour, synthetic versions of the characteristic compound would be added as they are cheaper than the compound when produced naturally. This analysis becomes more difficult with the complexity of the compound. For example vanillin can be produced naturally, synthetically and can also be produced biosynthetically from naturally produced compounds like ferulic acid and
8
curcumin (from turmeric), or derived from lignin from wood (Greule et al., 2010; Ruff, Hör, Weckerle, König, & Schreier, 2002). The various production pathways impacts the isotopic ratios which can then be exploited for the detection of adulteration.
As distillates are generally stored and aged in oak barrels, compounds such as vanillin are leached into the beverage. One objective of this study was to develop an analytical method implementing GC-C-IRMS to establish if it is possible to determine the source of vanillin in a distillate (wooden barrel it is stored in, or by synthetic vanillin addition) by measuring its δ13C value.
Analysis of intramuscular fat in lambs
From a nutritional quality perspective, saturated fatty acids (SFA), conjugated linoleic acid (CLA) and long chain-polyunsaturated fatty acids (LC-PUFA) and their subsequent impact on human health, are gaining increased attention. The development of cardiovascular diseases in humans is related to the intake of SFA, however intake of CLA isomers and LC-PUFA can be beneficial for human health resulting in reduced risk of cancer, diabetes and atherosclerosis (Jerónimo et al., 2010; Jerónimo, Alves, Prates, Santos-Silva, & Bessa, 2009; Vasta et al., 2009).
Both SFA, CLA and LC-PUFA are found in ruminant meats (Alves & Bessa, 2009; Nagao & Yanagita, 2005; Vasta et al., 2009). Manipulation of meat composition such that it contains increased concentrations of CLA and LC-PUFA, such as eicosapentaenoic and docosahexaenoic acids which are known to have anti-inflammatory, antithrombotic, and anti-atherogenic effects, and reduced concentrations of SFA, would be beneficial for the meat eating society (Givens, 2005; Jerónimo et al., 2009).
9
The concentration of CLA in meat is dependent on the diet of the animal and due to the ruminal biohydrogenation of the essential fatty acids linoleic acid and linolenic acid, which are solely derived from the diet, to form stearic acid from which other fatty acids are derived (Bessa et al., 2007; Sackmann et al., 2003; Vasta et al., 2009). Stearic, oleic and palmitic acid can also be formed by de novo synthesis. Increasing the amount of these essential fatty acids in the diet could increase the formation of these fatty acids in the muscle and fat of the ruminant (Jerónimo et al., 2010; Raes K, De Smet S, Balcaen A, Claeys E, & D., 2003). De novo synthesis by the animal is depressed when there is an abundance of fatty acids derived from the diet (Chilliard, 1993). Traceability of the ruminant meat to its food source should be possible, as the composition of fatty acids in ruminant meat can be derived from the diet. Implementing GC-C-IRMS for analysis δ13C values of fatty acids in the intramuscular fat of lambs compared to dietary fatty acids for has increasing complexity compared to single compound analysis as for distillates especially since there are metabolic processes occurring in the rumen, such as unsaturated fatty acid hydrogenation and isomerisation and de novo synthesis of fatty acids (Alves & Bessa, 2009).
Analysis of tomatoes
As people become more aware of what they are eating through their own research, they have become more interested in how their food is produced and how healthy it is for them, for example, conventionally grown products versus organically grown products. Organic products are deemed healthier, friendlier for the environment and safer as they are not plied with insecticides or synthetic fertilizers like conventional products (Laursen, Schjoerring, Kelly, & Husted, 2014). Organic products, due to their production costs, command high prices from the consumer, whereas conventional products are much cheaper to produce. Adulterations such as mislabelling a conventionally grown product
10
as organic for increased profits are constantly occurring (Huck, Pezzei, & Huck-Pezzei, 2016) and are difficult to detect. How is it possible to differentiate between a tomato grown organically and a tomato grown conventionally, when physically the two look the same? It is known that synthetic fertilisers are different from organic fertilisers due to their mode of formation with respect to their δ15N values. Synthetic fertilisers have δ15N values between ‒6‰ and +6‰ and organic fertilisers (e.g. animal manures) have δ15N values between +1‰ and +37‰ (Bateman & Kelly, 2007). As plants uptake nitrogen from the soil these values could be reflected in the plant and subsequently in the fruit of the plant (tomato). Indeed analysis of bulk (whole sample) tomatoes for δ15N by can differentiate between plants grown organically and plants grown conventionally (Nakano, Uehara, & Yamauchi, 2003). However, the uptake of nitrogen by plants is more complicated than just a simple uptake of nitrogen from fertilizers, as there are other factors that affect nitrogen uptake, and the resultant δ15N value. Factors such as temperature, soil type, moisture content, type of chemical fertilizer applied, differences in agricultural practices, variations in deposits of atmospheric nitrogen all play a role (Bateman, Kelly, & Woolfe, 2007; Choi, Ro, & Lee, 2003). It has also been shown that nitrogen can affect the δ13C values of a plant due to high rates of fertiliser and can also be influenced by other environmental factors (Högberg, Johannisson, & Hällgren, 1993; Senbayram, Dixon, Goulding, & Bol, 2008).
Nitrogen uptake is facilitated by the conversion of nitrate and ammonia into amino acids. Amino acids in plants are involved in many metabolic pathways such as secondary metabolism, plant defense, and cell component and protein synthesis (Molero, Aranjuelo, Teixidor, Araus, & Nogués, 2011). Their measurement could be used to track the metabolic pathway of nitrogen in plants. Environmental parameters that could affect nitrogen uptake might also impact on amino acid composition and hence their isotopic ratio. Acknowledging all these factors, another objective of this study was to determine
11
if the analysis of amino acids in the tomatoes by GC-C-IRMS for δ15N and δ13C could differentiate between conventionally and organically grown tomatoes.
12
REFERENCES
______________________________________________________________________ Alves, S. P., & Bessa, R. J. B. (2009). Comparison of two gas-liquid chromatograph
columns for the analysis of fatty acids in ruminant meat. Journal of
Chromatography A, 1216(26), 5130-5139. 10.1016/j.chroma.2009.04.079
Bateman, A. S., & Kelly, S. D. (2007). Fertilizer nitrogen isotope signatures. Isotopes in
Environmental and Health Studies, 43(3), 237-247.
10.1080/10256010701550732
Bateman, A. S., Kelly, S. D., & Woolfe, M. (2007). Nitrogen isotope composition of organically and conventionally grown crops. Journal of Agricultural and Food
Chemistry, 55(7), 2664-2670. 10.1021/jf0627726
Bessa, R. J. B., Alves, S. P., Jerónimo, E., Alfaia, C. M., Prates, J. A. M., & Santos-Silva, J. (2007). Effect of lipid supplements on ruminal biohydrogenation intermediates and muscle fatty acids in lambs. European Journal of Lipid Science and
Technology, 109(8), 868-878. 10.1002/ejlt.200600311
Chilliard, Y. (1993). Dietary fat and adipose tissue metabolism in ruminants, pigs, and rodents: A review. Journal of Dairy Science, 76(12), 3897-3931. 10.3168/jds.S0022-0302(93)77730-9
Choi, W.-J., Ro, H.-M., & Lee, S.-M. (2003). Natural 15N abundances of inorganic nitrogen in soil treated with fertilizer and compost under changing soil moisture regimes. Soil Biology and Biochemistry, 35(10), 1289-1298. 10.1016/s0038-0717(03)00199-8
Givens, D. I. (2005). The role of animal nutrition in improving the nutritive value of animal-derived foods in relation to chronic disease. Proceedings of the Nutrition
Society, 64(3), 395-402. 10.1079/pns2005448
Greule, M., Tumino, L., Kronewald, T., Hener, U., Schleucher, J., Mosandl, A., & Keppler, F. (2010). Improved rapid authentication of vanillin using δ13C and δ2H values. European Food Research and Technology, 231(6), 933-941. 10.1007/s00217-010-1346-z
Högberg, P., Johannisson, C., & Hällgren, J.-E. (1993). Studies of 13C in the foliage reveal interactions between nutrients and water in forest fertilization experiments. Plant
and Soil, 152(2), 207-214. 10.1007/bf00029090
Huck, C. W., Pezzei, C. K., & Huck-Pezzei, V. A. C. (2016). An industry perspective of food fraud. Current Opinion in Food Science, 10(Supplement C), 32-37. 10.1016/j.cofs.2016.07.004
Jerónimo, E., Alves, S. P., Dentinho, M. T. P., Martins, S. V., Prates, J. A. M., Vasta, V., Bessa, R. J. B. (2010). Effect of grape seed extract, Cistus ladanifer L., and vegetable oil supplementation on fatty acid composition of abomasal digesta and intramuscular fat of lambs. Journal of Agricultural and Food Chemistry, 58(19), 10710-10721. 10.1021/jf1021626
Jerónimo, E., Alves, S. P., Prates, J. A. M., Santos-Silva, J., & Bessa, R. J. B. (2009). Effect of dietary replacement of sunflower oil with linseed oil on intramuscular fatty acids of lamb meat. Meat Science, 83(3), 499-505. 10.1016/j.meatsci.2009.06.033
Laursen, K. H., Schjoerring, J. K., Kelly, S. D., & Husted, S. (2014). Authentication of organically grown plants – advantages and limitations of atomic spectroscopy for multi-element and stable isotope analysis. Trends in Analytical Chemistry, 59(0), 73-82. 10.1016/j.trac.2014.04.008
13
Molero, G., Aranjuelo, I., Teixidor, P., Araus, J. L., & Nogués, S. (2011). Measurement of 13C and 15N isotope labeling by gas chromatography/combustion/isotope ratio mass spectrometry to study amino acid fluxes in a plant–microbe symbiotic association. Rapid Communications in Mass Spectrometry, 25(5), 599-607. 10.1002/rcm.4895
Nagao, K., & Yanagita, T. (2005). Conjugated fatty acids in food and their health benefits.
Journal of Bioscience and Bioengineering, 100(2), 152-157. 10.1263/jbb.100.152
Nakano, A., Uehara, Y., & Yamauchi, A. (2003). Effect of organic and inorganic fertigation on yields, δ15N values, and δ13C values of tomato (Lycopersicon
esculentum Mill. cv. Saturn). Plant and Soil, 255(1), 343-349.
10.1023/a:1026180700963
Raes K, De Smet S, Balcaen A, Claeys E, & D., D. (2003). Effect of diets rich in N-3 polyunsatured fatty acids on muscle lipids and fatty acids in Belgian Blue double-muscled young bulls. Reproduction Nutrition Development, 43(4), 331-345. 10.1051/rnd:2003029
Ruff, C., Hör, K., Weckerle, B., König, T., & Schreier, P. (2002). Authenticity assessment of estragole and methyl eugenol by on-line gas chromatography−isotope ratio mass spectrometry. Journal of Agricultural and Food Chemistry, 50(5), 1028-1031. 10.1021/jf011204h
Sackmann, J. R., Duckett, S. K., Gillis, M. H., Realini, C. E., Parks, A. H., & Eggelston, R. B. (2003). Effects of forage and sunflower oil levels on ruminal biohydrogenation of fatty acids and conjugated linoleic acid formation in beef steers fed finishing diets. Journal of Animal Science, 81(12), 3174-3181.
Schipilliti, L., Bonaccorsi, I., Cotroneo, A., Dugo, P., & Mondello, L. (2013). Evaluation of gas chromatography-combustion-isotope ratio mass spectrometry (GC-C-IRMS) for the quality assessment of citrus liqueurs. Journal of Agricultural and
Food Chemistry, 61(8), 1661-1670. 10.1021/jf3028073
Senbayram, M., Dixon, L., Goulding, K. W. T., & Bol, R. (2008). Long-term influence of manure and mineral nitrogen applications on plant and soil 15N and 13C values from the Broadbalk Wheat Experiment. Rapid Communications in Mass
Spectrometry, 22(11), 1735-1740. 10.1002/rcm.3548
Vasta, V., Mele, M., Serra, A., Scerra, M., Luciano, G., Lanza, M., & Priolo, A. (2009). Metabolic fate of fatty acids involved in ruminal biohydrogenation in sheep fed concentrate or herbage with or without tannins. Journal of Animal Science, 87(8), 2674-2684. 10.2527/jas.2008-1761
14
CHAPTER TWO
______________________________________________________________________
INTRODUCTORY COMMENTS LITERATURE REVIEW
Paper 1 van Leeuwen, K. A., Prenzler, P.D., Ryan, D., & Camin, F. (2014). Gas Chromatography-Combustion-Isotope Ratio Mass Spectrometry for Traceability and Authenticity in Foods and Beverages. Comprehensive Reviews in Food Science and Food
Safety, 13(5): 814-837. DOI:10.1111/1541-4337.12096.
LITERATURE REVIEW UPDATE REFERENCES
15
INTRODUCTORY COMMENTS
______________________________________________________________________
This chapter provides an overview of what isotopes are, the history of the analysis of isotopes by GC-C-IRMS, the measurement of isotopes in foodstuffs and beverages and why GC-C-IRMS is a powerful tool for determining authenticity and/or traceability of edible products. The literature review was undertaken to identify what was previously done with GC-C-IRMS for the analysis of food and beverages to help define the scope of my research. Following the manuscript is a brief summary of articles published since the review was submitted for publication (2 Jun 2014)
40
LITERATURE REVIEW UPDATE
______________________________________________________________________
Since submission of van Leeuwen and others (2014), various articles implementing GC-C-IRMS for analysis of food and beverages have been published. Topics include the analysis of essential oils, edible oils and fats, beverages, vinegars and grains (Table 1)
These topics match those presented in van Leeuwen and others (2014), and show that GC-C-IRMS continues to be an active area or research. In terms of this thesis, however, it is important to ensure that no other studies have been conducted that detract from the novelty of the work that I have undertaken. As will be demonstrated, below, there have been some studies that are aligned with my work, but none that impact on my contribution of new knowledge to the field.
Articles of particular interest in relation to my research (see Chapter 1, Aims &
Objectives) are δ13C analysis of vanillin in foodstuffs for authenticity (Schipilliti and others 2017); bulk analysis (δ13C, δ2H, δ15N) of milk powder and compound specific (δ13C, δ2H) analysis of fatty acids in feed and farm water and their impact on dairy milk composition for traceability (Ehtesham and others 2015); and the analysis of amino acid δ15N values for grains, wheat and legumes and δ13C for wheat for differentiation of conventional and organic farming systems (Styring and others 2014; Paolini and others 2015).
Starting with the work of Schipilliti and others (2017), this study reported on identifying vanillin in baked products and used solid phase microextraction (SPME) to extract headspace vanillin, prior to GC-C-IRMS. In my work, SPME was not feasible due to the high concentration of ethanol in the distillates interfering with analyte absorption on the
41
fibre. Thus, a liquid-liquid extraction method needed to be developed and validated for use with distillates. Moreover, my work is the first report for the δ13C analysis of authentic vanillin in distillates. This allowed differentiation of vanillin derived from the wood of the storage barrel and adulterations by the addition of synthetic vanillin in distillates.
The research by Ehtesham and others (2015) confirmed that the isotopic ratios of farm water and grass fed to cows are reflected in the animal (deNiro and Epstein 1978) through analysis of its milk, which could enable the milk to be traced back to its geographic source. The research that I undertook also confirmed that the diet is reflected in the animal, but my study went a step further to determine the effect certain feed types had on the production of fatty acids in the animal. This knowledge facilitates greater insight on how to influence the animal’s diet for the production of ‘healthier’ quality meat for human consumption.
The amino acid analysis for wheat and grains (Styring and others 2014; Paolini and others 2015) to differentiate between organic and conventional farming systems implemented the measurement of δ15N values (Styring and others 2014; Paolini and others 2015) and δ13C values (Paolini and others 2015) to trace the amino acid uptake in the plant. The focus of my research was on tomato fruits grown under the organic and conventional farming regimes, but with comprehensive analysis of δ13C, δ15N, δ2H, δ18O and δ34S for the whole tomato and δ13C and δ15N for single amino acids to enable differentiation between the two systems.
Note: Table 1 and references in the text are in the style of the journal: Comprehensive Reviews in Food Science and Food Safety.
44
REFERENCES
______________________________________________________________________ Arana VA, Medina J, Esseiva P, Pazos D, Wist J. 2016. Classification of Coffee Beans
by GC-C-IRMS, GC-MS, and 1H-NMR. J Anal Methods Chem 2016, 11.
DeNiro MJ, Epstein S. 1978. Influence of diet on the distribution of carbon isotopes in animals. Geochim Cosmochim Acta 42(5), 495-506.
Ehtesham E, Hayman A, Van Hale R, Frew R. 2015. Influence of feed and water on the stable isotopic composition of dairy milk. Int Dairy J 47(0), 37-45.
Faberi A, Marianella RM, Fuselli F, La Mntia A, Ciardiello F, Montesano C, Mascini M, Sergi M, Compagnone D. 2014. Fatty acid composition and δ13C of bulk and individual fatty acids as marker for authenticating Italian PDO/PGI extra virgin olive oils by means of isotopic ratio mass spectrometry. J Mass Spectrom 49(9), 840-849.
Hansen A-MS, Fromberg A, Frandsen HL. 2014. Authenticity and traceability of vanilla flavors by analysis of stable isotopes of carbon and hydrogen. J Agri Food Chem 62(42), 10326-10331.
Nimmanwudipong T, Gilbert A, Yamada K, Yoshida N. 2015. Analytical method for simultaneous determination of bulk and intramolecular 13C-isotope compositions of acetic acid. Rapid Commun Mass Spectrom 29(24), 2337-2340.
Nisbet MA, Tobias HJ, Brenna JT, Sacks GL, Mansfield AK. 2014. Quantifying the contribution of grape hexoses to wine volatiles by high-precision [U13C]-glucose tracer studies. J Agri Food Chem 62(28), 6820-6827.
Paolini M, Ziller L, Laursen KH, Husted S, Camin F. 2015. Compound-specific δ15N and δ13C analyses of amino acids for potential discrimination between organically and conventionally grown wheat. J Agri Food Chem 63(25), 5841-5850.
Schipilliti L, Bonaccorsi I, Cotroneo A, Dugo P, Mondello L. 2015. Carbon isotope ratios of selected volatiles in Citrus sinensis and in orange-flavoured food. J Sci Food Agric 95(14), 2944-2950.
Schipilliti L, Bonaccorsi IL, Mondello L. 2017. Characterization of natural vanilla flavour in foodstuff by HS-SPME and GC-C-IRMS. Flavour Frag J 32(2), 85-91.
Spangenberg JE. 2016. Bulk C, H, O, and fatty acid C stable isotope analyses for purity assessment of vegetable oils from the southern and northern hemispheres. Rapid Commun Mass Spec 30(23), 2447-2461.
Styring AK, Fraser RA, Bogaard A, Evershed RP. 2014. The effect of manuring on cereal and pulse amino acid δ15N values. Phytochemistry 102(0), 40-45.
van Leeuwen KA, Prenzler PD, Ryan D, Camin F. 2014. Gas chromatography-combustion-isotope ratio mass spectrometry for traceability and authenticity in foods and beverages. Comp Rev Food Sci Food Safety 13(5), 814-837.
45
CHAPTER THREE
______________________________________________________________________
INTRODUCTORY COMMENTS RESEARCH PAPER
Paper 2 van Leeuwen, K. A., Prenzler, P. D., Ryan, D., Paolini, M., & Camin, F. (2017). Differentiation of wood derived vanillin from synthetic vanillin in distillates implementing GC-C-IRMS for δ13C.
Submitted to Rapid Communications in Mass Spectrometry: 21 Jul 2017
Manuscript ID: RCM-17-0231
Presented in the style of the journal: Rapid Communications in Mass Spectrometry.
46
INTRODUCTORY COMMENTS
______________________________________________________________________
Vanillin is an important flavour and aroma compound in distillates such as whiskey and brandy and it is a quality marker for the beverage. To improve the quality of sub-standard beverages and therefore sell them at a higher price, adulterations via the addition of synthetic compounds, such as vanillin, ensues. This chapter focuses on the isotopic δ13C analysis of vanillin by GC-C-IRMS for the authentication of distillates.
47
Differentiation of wood derived vanillin from synthetic vanillin in
distillates implementing GC-C-IRMS for
δ
13C
Short title: δ13C of vanillin in distillate using GC-C-IRMS
Katryna A. van Leeuwenab, Paul D. Prenzlerb, Danielle Ryanb, Mauro Paolinia, Federica Camina*
a Department of Food Quality and Nutrition, Research and Innovation Centre, Fondazione
Edmund Mach, Via E. Mach 1, 38010 San Michele all’Adige, Trento, Italy
b School of Agricultural and Wine Sciences, EH Graham Centre for Agricultural
Innovation, Charles Sturt University, Wagga Wagga, NSW 2678, Australia
*Corresponding author: [email protected]
Fax: +39 0461 615149
48
Abstract
Rationale: Typical storage in oak barrels release in distillates different degradation
products such as vanillin, whichplays an important role in their flavour and aroma. The addition of vanillin, as well as other aroma compounds, of different origin is prohibited by European laws.
As vanillin from different sources have different δ13C values, δ13C could be used to determine whether the vanillin is authentic (lignin-derived), or if it has been added from another source (e.g. synthetic).
Methods: The δ13C values for vanillin derived from different sources including natural, synthetic, and tannins, were measured by gas chromatography-combustion-isotope ratio mass spectrometry, after diethyl ether addition and/or ethanol dilution. A method for analysing vanillin in distillates after dichloromethane extraction was developed. Tests were undertaken to prove the reliability, reproducibility and accuracy of the method with standards and samples. Distillate samples were run to measure the δ13C values of vanillin and to compare them to values for other sources of vanillin.
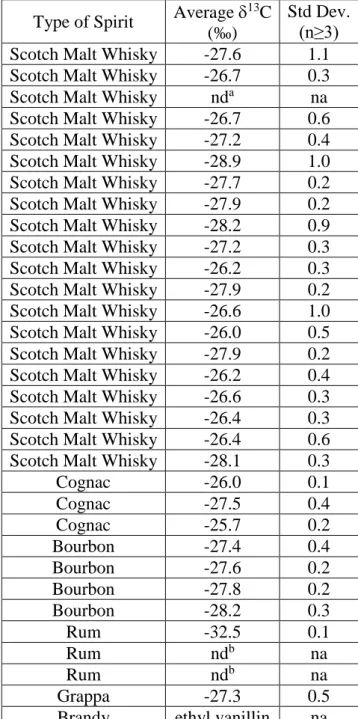
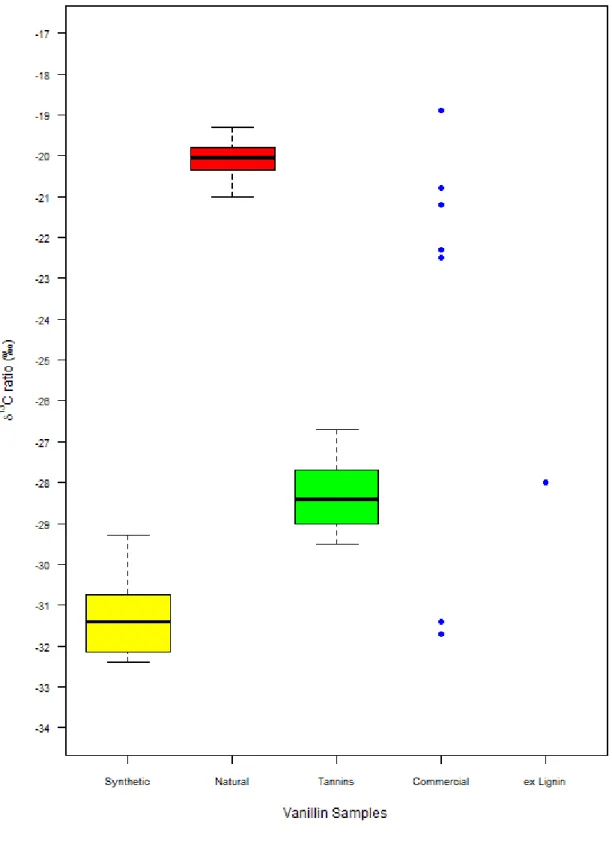
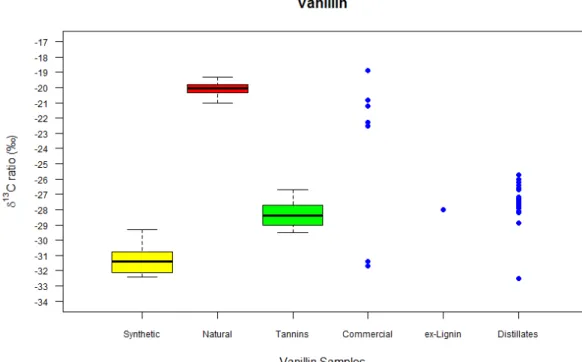
Results: δ13C values were determined for: natural vanillin extracts (-21.0‰ to -19.3‰, 16 samples); vanillin exlignin (28.2‰, 1 sample); and synthetic vanillin (32.6‰ to -29.3‰, 7 samples). Seventeen tannin samples were found to have δ13C values of -29.5‰ to -26.7‰, which were significantly different (p<0.05) from the natural and synthetic vanillins. The vanillin measured in distillates (-28.9‰ to -25.7‰) were in the tannin range, however one spirit (-32.5‰) was found to have synthetic vanillin.
Conclusions: The results show that synthetic vanillin added to a distillate was able to be
differentiated from that of vanillin derived from oak barrels by δ13C values. The GC-C-IRMS method could be a useful tool in the determination of adulteration of distillates.
49
Keywords
Vanillin; authentication; compound-specific; GC-C-IRMS; distillate
1. INTRODUCTION
Distilled and fermented beverages, “distillates”, such as whisky, brandy, rum and grappa are commonly aged in oak barrels [1, 2]. Generally, the storage of distillates in oak barrels can impart a more complex palette of flavour and aroma to the beverage [1, 3] compared to those that are unoaked. Adulteration of distillates with synthetic or bio-synthetic aroma compounds is prohibited by the European Commission (EC) Regulation No. 110/2008, which states that rum, whisky, grain spirit, wine spirit, grape marc spirit and fruit marc spirit cannot be sweetened or flavoured, though plain caramel can be added for colour enhancement and any additions to the spirits need to be declared. As such, adulteration is fraudulent and constitutes a major economic problem, as manufacturers seek to improve the quality and monetary value of their product through the unauthorised addition of key aroma compounds to their beverages.
An important step in the production of distillates is storage in oak barrels, commonly derived from American or French oak [4, 5]. The oaking process imparts important aroma and flavours to the distillate depending on: species and origin of the wood; seasoning of the oak for barrel making; toasting of the oak and at different levels (light, medium and heavy); the length of time the distillate is in contact with the wood; and the barrel storage environment [1]; but the factor that influences the overall sensory aspect of the distillate from the wood is heat [6]. As the lignin, cellulose, hemicellulose and other extractives in the wood of the barrel break down, due to the toasting process, degradation products such as volatile phenols [7], furan aldehydes [8] and vanillin [7, 9] are released into the distillate [3, 7]. In the first few months of maturation these compounds are released into the distillate
50
Further into the maturation process of the distillates, lignin is slowly degraded by a process known as ethanolysis (reaction of lignin with the distillate ethanol to produce an ethanol-lignin soluble compound which is then oxidised) releasing more compounds into the distillate [1, 10-12]. Furan aldehydes, such as furfural, 5-methyl furfural and 5-HMF, which derive from the degradation of hemicelluloses and celluloses [5] , have been shown to increase as the length of maturation time increases [8], imparting caramel, toasty and honey flavours [5, 13] , and may also create the sensation of “hotness” to the beverage [13, 14].
It is well known that vanillin (4-hydroxy-3-methoxybenzaldehyde) plays an important role in the flavour and aroma of distillates [1, 15-17] such as brandy [18], rum [19] and whiskey, [1] and it defines the overall quality of the beverage [18]. Vanillin is reported to have a
“vanilla” and “sweet” aroma [19, 20] with an aroma threshold in 40% ethanol of 22 µg/L [19]. According to Maga, [21] vanillin has a taste threshold of 100 µg/L in 40% ethanol which means that a minute quantity of vanillin is required to fraudulently alter the flavour of a distillate. The cost of natural vanillin from Vanilla spp. is estimated to be USD 1500/kg compared to the much cheaper synthetic vanillin that costs between USD 10 – 20/kg (http://www.evolva.com/vanillin/#sthash.ztwstm6p.dpuf). Because of this significant price difference, adulteration of natural vanillin with biosynthetic and synthetic vanillin has been reported in several types of foodstuffs [22-25].
Fortunately, vanillin derived from different sources such as natural, synthetic, biosynthetic and extracted from lignin may be discriminated on the basis of the stable isotope ratio of carbon, namely 13C/12C expressed in δ13C. Natural vanillin derived from the tropical orchid, Vanilla (mainly the species V. planifolia, V. tahitensis and V.
51
-22‰ to -14‰ [23, 26-38], whereas biosynthetic (ex-ferulic acid and turmeric) and synthetic (lignin and guaiacol precursors) vanillin have significantly lower δ13C values (38‰ to -29‰ and -30‰ to -27‰, respectively) [23].
Analysis of compound specific stable isotope ratios by gas chromatography-combustion-isotope ratio mass spectrometry (GC-C-IRMS) offers a highly sensitive and selective approach for the detection of adulteration, however very little work on the adulteration of distillates has been conducted. Mostly the analysis of distillates by GC-C-IRMS has focused on the analysis of ethanol and the higher alcohols by GC/MS and IRMS, [39-41] however there is one report using GC-C-IRMS on volatile components of citrus liqueurs[42]. In the current study, a method for measuring δ13C of vanillin found in distillates has been developed. In order to determine the source of vanillin in the distillates, a range of sources of vanillin were also subjected to GC-C-IRMS and their δ13C values are reported.
2. EXPERIMENTAL 2.1 Standards and reagents
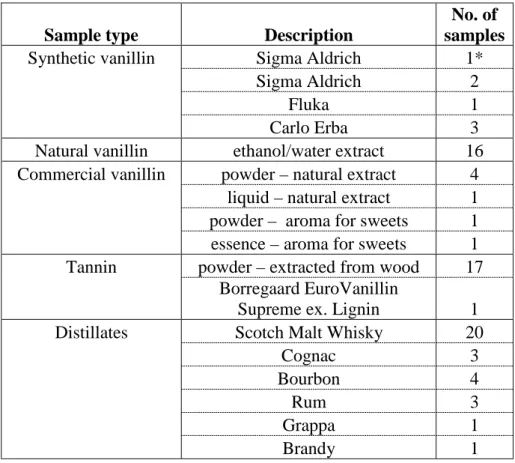
The reagents: diethyl ether, dichloromethane, and potassium metabisulfite were purchased from Sigma Aldrich, Milan, Italy. A synthetic vanillin (99% purity), termed “vanillin standard” (Table 1) was used for method development purposes and was purchased from Sigma Aldrich, Milan, Italy. Ethanol was purchased from Fluka, Milan, Italy. Sodium sulfate was bought from Carlo Erba, Milan, Italy. Hydrogen chloride and sodium chloride were purchased from Merck, Milan, Italy.
52
2.2 Samples
Commercial edible samples containing vanillin (including 4 powders of natural extract and sugar, 1 natural extract and sugar syrup, 1 essence aroma for sweets, 1 powder aroma for sweets) were bought from local stores in Italy and France (Table 1). Three synthetic reagents of vanillin were purchased from Carlo Erba (99%), one from Fluka (Milan, Italy) and two from Sigma Aldrich (99%) and all were purchased in Milan (Italy). Sixteen commercial industrial food vanillin (ethanol/water) extracts were acquired in Italy. Seventeen commercial tannin samples were bought in Italy. Borregaard EuroVanillin Supreme ex. Lignin (termed “vanillin ex-lignin”), 99.6% purity, was supplied by Eigenmann & Veronelli, Italy. Distillate samples comprising 20 Scotch Malt Whisky, 3 Cognac, 4 Bourbon, and 3 Rum were provided by The Scotch Whisky Research Institute (Edinburgh, UK). Two distillate samples, a Grappa and a Brandy, were purchased locally in Italy. For method development purposes (see below), a young Grappa (no detectable vanillin), was purchased locally.
2.3 Sample preparation
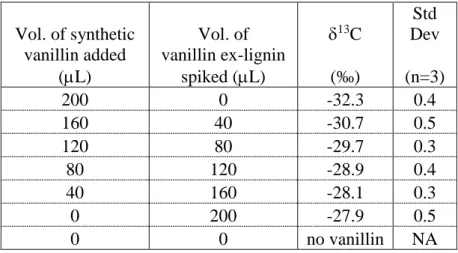
The vanillin standard, other synthetic vanillins, and the vanillin ex-lignin were made up as 1 mg/mL solutions in ethanol. For repeatability measures, a 10 ppm vanillin solution was made in model distillate (water and ethanol) as follows: ethanol (60 mL) was spiked with 100 µL of 1 mg/mL vanillin standard and made to 100 mL with deionised water. For the limit of adulteration test, volumes of vanillin standard and vanillin ex-lignin (Table 2) were added to 25 mL of the young grappa.
2.3.1 Edible commercial powders and extracts
Commercial samples (powder: 1 g; extract/essence: 2 mL) were prepared in ethanol (2.5 mL; 1 mL). Samples were then vortexed, and (deionised) water (powder: 2.5 mL; extract:
53
3 mL) was added and the samples were vortexed again to obtain a homogenous solution. Diethyl ether (5 mL) was then added, the samples were mixed, and layers were allowed to separate. The diethyl ether layer was removed and concentrated to dryness under N2 at room temperature. The concentrates were dissolved in ethanol (1 mL) and vortexed, then diluted 8-fold with a series of 3 two-fold dilutions with ethanol. The samples were transferred to a GC/MS vial for analysis.
2.3.2 Natural vanillin extracts
Diethyl ether (3 mL) was added to the vanillin extract (3 mL) and the sample was shaken for approx. 2 min before the layers were allowed to separate. The diethyl ether layer was removed and concentrated to dryness under N2 at room temperature. The concentrate was dissolved in ethanol (1 mL) and then vortexed. The sample was diluted 8-fold as above and then injected into the GC-C-IRMS.
2.3.3 Tannin samples
Ethanol (0.9 mL) was added to the tannin sample (100 mg) and vortexed to help dissolve the sample. Deionised water (2.1 mL) was then added to completely dissolve the sample and the solution was again vortexed. Diethyl ether (3 mL) was added, the sample shaken by hand and the layers were allowed to separate. The diethyl ether layer was removed and retained. The water layer was re-extracted with diethyl ether (1 mL) and the ether extracts were combined and then concentrated to dryness under N2 at 30 °C. The sample was dissolved in ethanol (0.3 mL) and vortexed, transferred to an insert in a GC/MS vial prior to analysis.
54 2.3.4 Distillate samples
The distillate (30 mL) was adjusted to pH 1 with aqueous HCl (1M). The ethanol was then removed via rotary evaporation at 50 psi and 30 °C using a Heidolph rotary evaporator and filtered using a 45 µm Cellulose Acetate filter (Minisart NML, hydrophilic, non-sterile, Sartorius, Germany). The sample was then extracted with dichloromethane (3 x 3 mL), dried under sodium sulfate, concentrated to dryness under N2 at 30 °C and dissolved in 0.2 mL of dichloromethane. The sample was then transferred to an insert in a GC/MS vial prior to analysis.
For those distillates where 5-HMF co-eluted with vanillin, 50 mg potassium metabisulfite was added to 25 mL distillate. The mixture was shaken to dissolve the distillate, then extracted as above, and the extract was analysed by GC-C-IRMS.
2.4 Instrumental methods
2.4.1 Elemental analysis (EA) of the vanillin standard, vanillin ex-lignin and 5-hydroxymethylfurfural (5-HMF)
The δ13C values of the vanillin standard, vanillin ex-lignin and 5-HMF were measured implementing an elemental analyzer (Flash EA 1112, Thermo Scientific, Bremen, Germany), furnished with an autosampler (Finnigan AS 200, Thermo Scientific) and interfaced to a DELTA V isotope ratio mass spectrometer (Thermo Scientific) through a ConFlo IV dilutor (Thermo Finnigan, Bremen, Germany) (see Fig. S1, Supporting information). The temperature of the combustion reactor was 910 °C and for the reduction reactor the temperature was 680 °C, the post reactor GC-column temperature was 45 °C. The He carrier gas had a flow rate of 120 mL/min, the reference gas flow rate was 150 mL/min and the oxygen flow rate was 250 mL/min. The cycle (run time) was 320 s, with a sampling delay of 15 s and an oxygen injection end of 5 s. For EA-IRMS measurements,
55
tin capsules (SÄNTIS analytical AG, Teufen, Switzerland) were used. Samples and standards (2 different casein standards, one used as the working standard and the other as a control within the sequence) were weighed (0.8 mg) in replicate. A blank sample was run first in the sequence and then the working standard (x2), the samples in replicate, the control (x2) and at the end of the sequence, the working standard (x2). Daily calibration checks were undertaken using the calibrated working casein standard (MRI 64) and controlled with the other casein standard (MRI 63).The isotopic values were calculated against two in-house standards and calibrated against the international reference materials: L-glutamic acid USGS 40 (IAEA-International Atomic Energy Agency, Vienna, Austria), mineral oil NBS-22 (IAEA) and sugar IAEA-CH-6 (IAEA). The values were expressed in δ‰ against the international standard (Vienna Pee Dee Belemnite (V-PDB) for δ13C). The uncertainty of measurements (2σ) was ±0.3‰.
2.4.2 GC-C-IRMS analysis of samples for δ13C of vanillin
δ13C and retention time for the vanillin standard was determined by GC-C-IRMS and identified by GC/MS with selected ions (m/z: 152, 151, 81, 109, 123) and compared with the NIST library (NIST Standard Reference Database 1A NIST/EPA/NIH Mass Spectral Library (NIST 08) and NIST Mass Spectral Search Program (Version 2.0f)).
A Trace GC Ultra (GC Isolink + ConFlo IV, Thermo Scientific, Bremen, Germany) furnished with an autosampler (Triplus, Thermo Scientific) and a ZB-FFAP column (30 m x 0.25 mm i.d. x 0.25 µm film thickness, Phenomenex, Milan, Italy) installed. The GC was interfaced to an IRMS (DELTA V, Thermo Scientific, Bremen, Germany) and a single quadrupole MS (ISQ Thermo Scientific, Bremen, Germany) by an open split device.
56
The commercial vanillin samples, synthetic samples, vanillin extract and some distillate samples were analysed with the following method (‘short’ method); the initial oven temperature was 65 °C and was held for 1 min and then increased to the final oven temperature of 250 °C at a rate of 20 °C/min and held at this temperature for 16 min. The method of analysis for the tannin samples was as for the commercial vanillin samples except that the final hold time was 26 min. The amount of sample and standard injected in splitless mode was 0.4 µL with a splitless time of 2 min. Helium was used as the carrier gas and the flow rate was 1.4 mL/min. For the distillate samples (‘long’ method) the initial oven temperature was 50 °C and held for 10 min, it was then increased at a rate of 3 °C/min to 90 °C and held for 2 min, and increased again to 250 °C at a rate of 6 °C/min and then held at this temperature for 20 min. The flow rate of He was 1.2 mL/min. The sample was injected in splitless mode with a splitless time of 2 min and the volume injected was 0.6 µL (for the standard the volume injected was 0.4 µL). The injector temperature for all samples was 260 °C and the transfer line temperature was 200 °C. Electron impact (EI) was the mode of ionization at 70 eV.
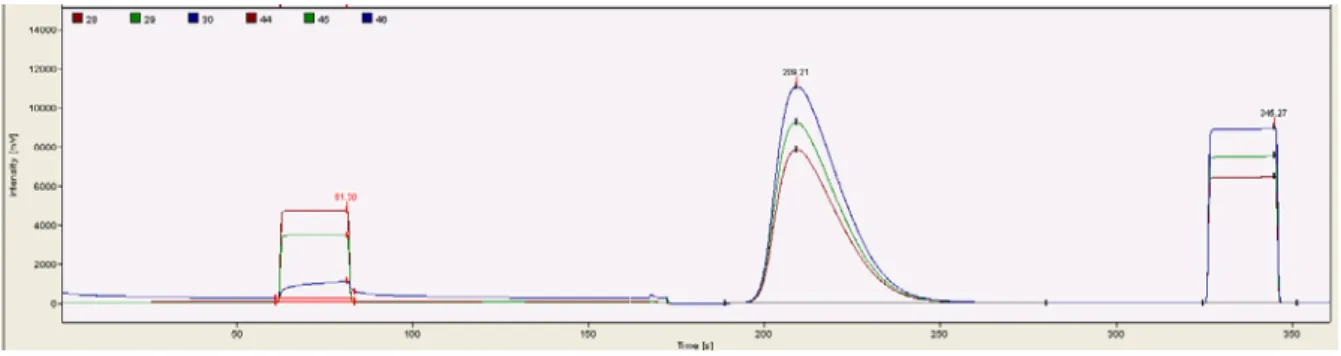
Compounds eluting from the GC column were split 90:10, IRMS:MS, respectively. Before the eluent flows via an open split to the IRMS it is first combusted to CO2 and H2O in a combustion reactor which consists of an alumina tube (320 mm length) comprising three braided wires of nickel oxide, copper oxide and platinum (0.125 mm diameter, 240 mm length) centered within the tube. A Nafion® membrane inside a water trap removed water vapor from the eluent/sample. The combustion reactor was operated at a temperature of 1030 °C.
The performance of the instrument was monitored using the vanillin standard δ13C value, which was measured by GC-C-IRMS before, within, and at the end of each run. Three
57
direct injections of CO2 were similarly undertaken at the beginning and end of each sample run. Each sample was measured in triplicate and the isotopic ratio was expressed in δ‰ relative to V-PDB (Vienna – Pee Dee Belemnite) for δ13C according to the notation developed by Brand and Coplen [43]. A correction was applied to the instrumental data to account for the δ13C value difference between the measurement of the vanillin standard by EA-IRMS and that of GC-C-IRMS.
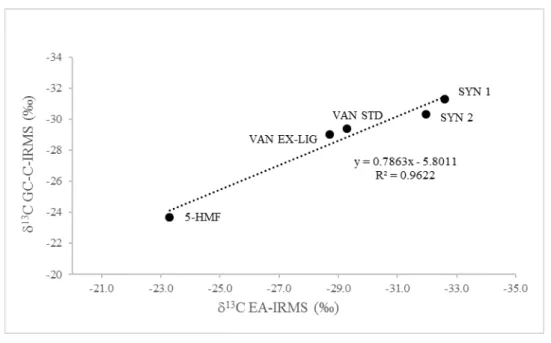
The accuracy of the GC-C-IRMS δ13C values for the vanillin standards, 5-HMF and the vanillin ex-lignin was established by plotting the δ13C values against the δ13C values determined by EA-IRMS. The δ13C values obtained by EA-IRMS were the mean of at least two measurements. The δ13C values obtained by GC-C-IRMS were the mean of at least three measurements. The δ13C values were shown to be linearly correlated thus demonstrating the integrity of the method (see Fig. S2).
The repeatability (1σ) of the ‘short’ and ‘long’ method for GC-C-IRMS analysis was evidenced by analyzing 10 times (average of three measurements each) a vanillin standard, a vanillin extract, a grappa spiked with vanillin ex-lignin and the model distillate. For the ‘short’ method it was ±0.1‰ for the vanillin standard, ±0.2‰ for the vanillin extract and ±0.3‰ for the model distillate. For the ‘long’ method it was ±0.5‰ for δ13C of the vanillin standard, ±0.4‰ for grappa and ±0.1‰ for model distillate. For a distillate (Scotch Malt Whisky) sample the standard deviation of two replicates (average of three measurements each) for the GC-C-IRMS analytical runs was ±0.4‰ for δ13C.
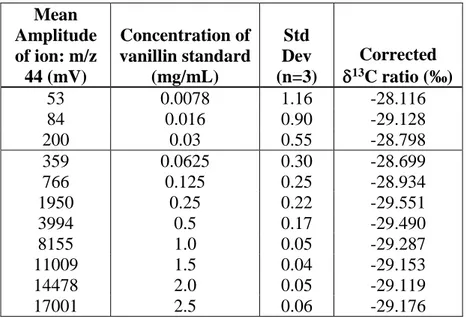
Reliable measurements of the isotope ratios were achieved when the amplitude of the m/z ion 44 was greater than 350 mV. This occurred for vanillin concentrations ≥ ~63 µg/mL
58
as shown in Table S1 and Figure S3 (Supporting Information). At this concentration, the standard deviation of the δ13C of vanillin was ≤ 0.30, which was deemed acceptable to give reliable isotope ratios.
Statistical analysis
Basic statistics of the samples, such as mean, standard deviation and linear correlation were done in excel. The results were statistically analysed by one-way ANOVA, Tukey’s Honest Significant Difference (HSD) test, and a boxplot combined with a scatterplot using the R program (R Core Team (2016). R: A language and environment for statistical computing. R Foundation for Statistical Computing, Vienna, Austria. (URL
https://www.R-project.org/).
3. RESULTS AND DISCUSSION 3.1 Sample selection
This work required measuring δ13C values in various sources of vanillin in order to establish typical ranges. As this study was interested in oaked distillates, 17 tannin samples and one ex-lignin sample were selected to provide sufficient δ13C values to cover the range expected from this source. In addition, seven synthetic vanillin samples were tested to provide an indication of δ13C values expected if adulteration of the distillates occurred. In terms of the distillates, 32 samples were chosen covering a variety of starting plant products – barley/wheat (Scotch malt whisky); grapes (cognac, grappa, brandy), corn (bourbon) and sugar cane (rum).
The report is divided into three sections. First, typical δ13C ranges were measured in sources of vanillin as described above. This was followed by development of a GC-C-IRMS method capable of determining δ13C values in distillates. As will be discussed
59
below, the complexity of the aroma profile arising from some distillates meant that there was co-elution of other volatile compounds with vanillin. Attempts to resolve this issue are covered below. The third section reports the δ13C values found in the distillates, with evidence presented that one distillate was adulterated with synthetic vanillin.
3.2 GC-C-IRMS of vanillin from tannins, from vanilla and synthetic vanillin
Vanillin in distillates derives from wood lignin and therefore measuring the δ13C values of this type of vanillin was required. As well as wood lignin, vanillin can be derived from the use of tannin coadjuvants, which is permitted in distillate production. Thus the δ13C of vanillin ex-lignin and of authentic vanillin from 17 samples of commercial tannins were determined. The δ13C values range between -29.5‰ and -26.7‰ and mainly agree with those found in the literature: from -28.2‰ to -26.8‰ [23, 26, 30, 32, 33, 37, 44, 45]. The δ13C values also partially overlap with those of synthetic vanillin (ex-guaiacol): from -36.2‰ to -27.4‰ [23, 26-28, 30, 33-35, 37] and biosynthetic (ex-turmeric): from -29.3‰ to -28.7‰ [23] (Fig.1).
For comparison, samples of natural vanilla extracts, commercial food powder and food extracts and synthetic vanillin were analysed. The natural vanillin extracts (21.0‰ to -19.3‰) had values of δ13C within the range found in the literature for natural vanillin (-21.8‰ to -14.6‰) [23, 26-38]. They also have a higher δ13C than for the tannin and the vanillin ex-lignin (mentioned above) which is expected, as their formation follows different photosynthetic pathways (CAM vs C3). The synthetic vanillin/commercial reagents of vanillin (-32.6‰ to -29.3‰) showed that their δ13C values were within the range for synthetic vanillin in the literature (mentioned above) and are lower than δ13C values for natural vanillin, but slightly overlap the lower end of the tannin δ13C range.
60
A one-way ANOVA comparing the means of the differently sourced vanillin confirmed that the δ13C ratios for synthetic vanillin, tannin extracted vanillin and natural vanillin were significantly different (p<0.05). Furthermore, Tukey’s HSD test showed that the synthetic vanillin, tannin extracted vanillin and natural vanillin were different from each other, whereas the tannin extracted vanillin and the vanillin ex-lignin were not different, which was expected.
The analysis of commercial food vanillin, as a powder or an extract, to be added to baked goods such as cakes and biscuits, resulted in 5 of the products (-22.5‰ to -18.9‰) with their δ13C value in the range of natural vanillin and 2 of the products (-31.7‰ & -31.4‰) in the range of synthetic vanillin. Indeed these 2 products had labels with the words ‘aroma for sweets’ and they therefore weren’t labelled as ‘natural’, providing further confirmation of the validity of the method.
3.3 Development of the method for analysis of δ13C of vanillin in distillates
As mentioned above, distillates are aged in oak barrels, sometimes up to 20 years or longer, and there is the possibility that the process of aging changes the isotopic ratios of compounds over time through fractionation. This would mean that δ13C values could not be used to identify sources of vanillin. Therefore an experiment was undertaken to confirm that the δ13C values of vanillin do not change during the extraction and aging process of the distillate. The vanillin isotope ratio for a grappa stored in a new oak barrel was compared to that of the same grappa stored in a seven year old oak barrel. As expected, the concentration of vanillin was much higher in the grappa from the old oak barrel than for the new barrel, because vanillin is leached from the barrel over time. However, the δ13C values did not change: that of vanillin for the new oak barrel was