1
ALMA MATER STUDIORUM – UNIVERSITÀ DI BOLOGNA
Dottorato di Ricerca in Scienze della Terra, della Vita e dell’Ambiente
Curriculum Biologico – Ciclo XXX
Settore Concorsuale: 05/B1 - Zoologia e Antropologia
Settore Scientifico Disciplinare: BIO/08 - Antropologia
Impact of non-LTR retrotransposons in
the differentiation and evolution of
Anatomically Modern Humans
Tesi presentata da:
Etienne Guichard
Coordinatore Dottorato: Supervisore:
Prof. Giulio Viola Dr. Alessio Boattini
3
INDEX OF CONTENTS
p. 5 - ABSTRACT
p. 7 - INTRODUCTION
p. 7 - Modern and archaic humans
p. 8 - The human genome and Transposable Elements p. 10 - Active non-LTR retrotransposons in the human genome p. 12 - Retrotransposition
p. 13 - Host defense mechanisms p. 14 - Aims of the study
p. 15 - METHODS
p. 15 - RI identification between AMH and HN/HD
p. 18 - RI identification between AMH and chimpanzee reference sequences and RT-DB p. 18 - Computational validation procedure
p. 19 - Archaic-specific insertions in 1000 Genomes populations and inter-specific RI estimation p. 19 - Assessment of AMH-specific RI in 1KG samples and frequency-based population tree p. 20 - TMRCA estimates of genetic regions surrounding AMH-specific RI
p. 20 - 3P-CLR selection estimates for regions surrounding an insertion p. 21 - AMH-specific RI, genes and preferential expression
p. 22 - Gene Ontology functional analyses
4 p. 25 - RESULTS
p. 25 - RIs identification
p. 27 - Archaic-specific RIs and insertional polymorphisms p. 29 - AMH-specific RIs in present-day populations
p. 31 - Genomic features of loci targeted by AMH-specific RIs p. 38 - Gene Ontology of genes targeted by AMH-specific RI
p. 42 - Evidences of RI contribution in the molecular differentiation of AMH
p. 47 - DISCUSSION
p. 48 - AMH-specific RIs and functional variability increase at targeted loci p. 49 - Population distribution of RIs and natural selection
p. 51 - Impact of RIs in modern humans
p. 53 - CONCLUSIONS AND FUTURE PERSPECTIVES
p. 55 - REFERENCES
5
ABSTRACT
Transposable Elements are biologically important components of eukaryote genomes. In particular, non-LTR retrotransposons (N-LTRrs) extensively shaped the human genome throughout evolution. In this study, we compared retrotransposon insertions differentially present in the genomes of Anatomically Modern Humans, Neanderthals, Denisovans and Chimpanzees, in order to assess the possible impact of retrotransposition in the differentiation of the human lineage. Briefly, we first identified species-specific N-LTRrs and established their distribution in present day human populations. These analyses shortlisted a group of N-LTRr insertions that were found exclusively in Anatomically Modern Humans. Notably, these insertions targeted genes more frequently than randomly expected and are associated with an increase in the number of transcriptional/splicing variants of those genes they inserted in. The analysis of the functionality of genes targeted by human-specific N-LTRr insertions seems to reflect phenotypic changes that occurred during human evolution. Furthermore, the expression of genes containing the most recent N-LTRr insertions is enriched in the brain, especially in undifferentiated neurons, and these genes associate in networks related to neuron maturation and migration. Additionally, we also identified candidate N-LTRr insertions that have likely produced new functional variants exclusive to modern humans, which show traces of positive selection and are now fixed in all present-day human populations. In sum, our results strongly suggest that N-LTRr impacted our differentiation as a species and have been a constant source of genomic variability all throughout the evolution of the human lineage.
7
INTRODUCTION
Modern and archaic humans
Anatomically Modern Humans (AMH) appeared in Africa at least 200 thousands of years ago (kya), although recent studies antedate them to about 350 kya (Hublin et al. 2017, Schlebusch et al. 2017). AMH went out of Africa between 80-130 kya (Out of Africa II) through the Middle East, expanding towards Europe, Asia and later Southeast Asia, Oceania and the Americas.
Other Homo species had already migrated out of Africa before Homo sapiens appearance (Out of Africa I): H.
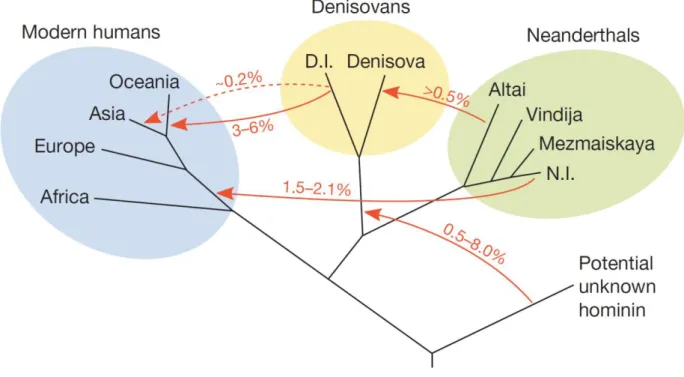
erectus in Asia, H. floresiensis in Southeast Asia, H. neanderthalensis and Denisova in Europe and Siberia. Homo neanderthalensis (HN) and Denisova (HD) are the closest extinct relatives to AMH (Figure 1). Theyare sister groups, being more closely related to each other than they are to Homo sapiens. Their split from the modern human lineage is estimated to have occurred between 550 thousands of years ago (kya) and 765 kya, after which they colonized Eurasia long before Anatomically Modern Humans (AMH) left Africa. The population split between these archaic populations is estimated at 381-473 kya (Prüfer et al. 2014). However, after AMH colonized Eurasia and encountered HN and HD, gene flow seems to have occurred between the different species: portions of HD- and HN-derived DNA are in fact present in modern human populations.
8
This gene flow seems to have occurred in both directions: in fact, HN mitochondrial DNA is closer to that of AMH than it is to that of HD. This is explained with an introgression of Homo sapiens DNA into the European Neanderthal populations that occurred more than 100 kya (Posth et al. 2017).
Neanderthals seem to have appeared about 500 kya in Europe: their remains have been found in Spain, France, Germany (Neander Valley, from where the species gets its name) (Krings et al. 1997; Schmitz et al. 2002; Sánchez-Quinto and Lalueza-Fox, 2015)and Croatia (Vindija cave) (Kuhlwilm et al. 2016; Ahern et al. 2005); at the same time they were also present in Asia, as testified by remains found in Russia (Mezmaiskaya and Denisova caves) (Pinhasi et al. 2011; Briggs et al. 2009). HN characteristic cranial and post-cranial morphology prompted its classification as a new species. Despite their strong physical features and their remarkable cranial volume (about 1500-1600 cc, slightly larger than Homo sapiens) (Stringer 1984; Holloway 1985), Neanderthals probably did not experience a cultural evolution such as the one that occurred for Homo
sapiens (Pearce et al. 2013).
Denisovans left far less fossil traces than Neanderthals: a distal phalanx of the hand and two molars (dated ~41.000 years ago), all found in the same archaeological site, the Denisova cave in southern Siberia (Sawyer et al. 2015). This is the same cave where the fossil remains of Altai Neanderthals have been found.
Notably, the genomes of some individuals belonging to HN and HD have been previously sequenced, assembled and published (Green et al. 2010; Meyer et al. 2012; Prüfer et al. 2014; Sawyer et al. 2015), two of which are high-coverage: one HD and one HN, both from the Altai mountains in southern Siberia (Meyer et al. 2012; Prüfer et al. 2014). This can allow for molecular comparisons of modern and archaic human DNA.
The human genome and Transposable Elements
The human genome is a complex structure composed of many different types of elements. Only roughly 1.5% of it accounts for protein-coding genes. The vast majority of our genetic material is made of non-genic sequences, such as Satellite DNA and Transposable Elements (Lander et al. 2001).
Transposable Elements (TEs) were discovered in the mid-1940s by Barbara McClintock and are DNA sequences that are able to move or replicate in genomes (Richardson et al. 2015). Although TEs have for long
9
been dismissed as "selfish", "parasites" or simply "junk DNA" (Orgel and Crick, 1980; Doolittle and Sapienza, 1980), the advent of whole genome DNA sequencing, in conjunction with molecular genetic, biochemical, genomic and functional studies, has revealed that TEs are biologically important components of mammalian genomes whose activity has extensively shaped the structure and function of our own genome (Richardson et al. 2015). TEs are known to be involved in several evolutionary and adaptive processes such as the generation of genes and pseudogenes (Ohshima et al. 2003; Moran et al. 1999; Sayah et al. 2004), fine-tuning transcriptional regulation of genes (Speek 2001; Han et al. 2004; Chuong et al. 2017), generation of somatic mosaicism (Bailie et.al. 2011; Muotri et al. 2005; Evrony et al. 2012), the increase in complexity and evolution of gene regulatory networks (Feschotte 2008) and the alteration of epigenetic mechanisms as processes of fine-scale and reversible regulation (Fedoroff 2012). Some of the most notable biological processes associated with the domestication of TE-derived sequences are the insurgence of the V(D)J system of acquired immunity (Kapitonov and Jurka, 2005; Koonin and Krupovic, 2014; Huang et al. 2016) and placental development (Lynch et al. 2011, Lavialle et al. 2013), but they also play key roles in embryogenesis (Gerdes et al. 2016; Friedli and Trono, 2015) and neurogenesis (Notwell et al. 2015; Muotri et al. 2005; Evrony et al. 2012). In sum, in addition to their role in growing the size of eukaryotes' genomes, active TEs are continually impacting the functioning and evolution of genomes.
Notably, the activity of TEs throughout evolution has generated more than two thirds of the human genomic material (Lander et al. 2001; Kapusta et al. 2013).
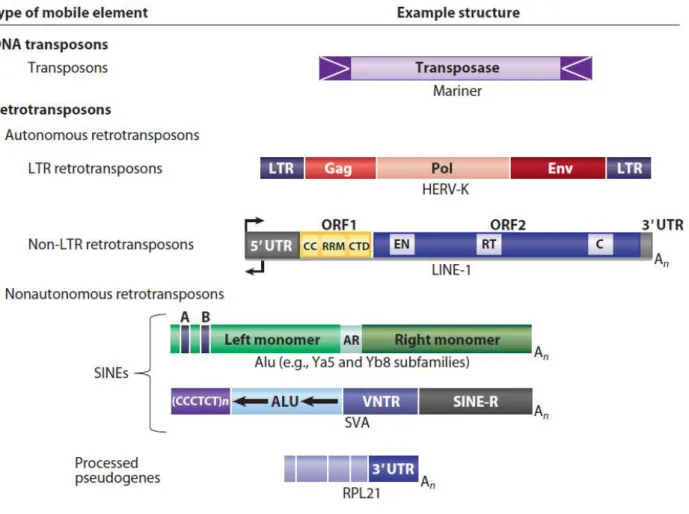
TEs can be divided in two categories based on their mobilization mechanism and functionality (Figure 2): DNA transposons that move via a cut-and-paste mechanism, being cleaved from their genomic site and inserting in a new target site, and retrotransposons, which are transcribed in a RNA intermediate that is then reverse-transcribed and inserted in the new target site, thus duplicating in a copy-and-paste like mechanism. Retrotransposons are grouped into two classes, depending on the presence or absence of a Long Terminal Repeat (LTR). LTR retrotransposons mimic modern retroviruses and have a similar mobilization mechanism. Non-LTR retrotransposons, instead, mobilize with a unique mechanism and are the most abundant TEs in our genome.
10
In modern humans, only a limited number of TE subfamilies from the non-LTR-retrotransposon (N-LTRr) class are currently active, i.e. Long and Short INterspersed elements (LINEs and SINEs). Indeed, the ongoing activity of LINEs and SINEs in humans offers a constant source of inter-individual variability in human populations and can sporadically generate new genetic disorders (Kazazian et al. 1988; Richardson et al. 2015).
Figure 2. Classification of TEs present in the human genome (Beck et al. 2011).
Active non-LTR retrotransposons in the human genome
LINE-1s (or L1s) are the most successful and abundant (bp-wise) retrotransposons in the human genome: they comprise at least 17% of our nuclear DNA with more than 500.000 copies (Richardson et al. 2015). Despite being the only active autonomous retrotransposons in our genome, the overwhelming majority of L1s are retrotransposition defective (RD-L1) and cannot move because they are 5’ truncated, internally rearranged, or otherwise mutated (Lee et al. 2007). Full-length Retrotransposition-competent L1s (RC-L1s)
11
are abundant, however only 80 to 100 copies of L1s on average are actually active in the human genome (Wei et al. 2001).
A full-length LINE-1 element is around 6kb in length (Dombroski et al. 1991; Scott et al. 1987) and contains a ~900bp long 5' untranslated region (5' UTR) with internal promoter activity (Swergold 1990), two open reading frames (ORFs), a ~150bp long 3' UTR, and a poly(A) tail (Scott et al. 1987). ORF1 encodes for a ~40kDa protein with RNA binding and nucleic acid chaperone activities (Hohjoh and Singer 1997; Kulpa and Moran 2005). ORF2 encodes for a ~150kDa protein with reverse transcriptase (RT) and endonuclease (EN) activities (Feng et al. 1996; Mathias et al. 1991). Both proteins are required for the mobilization of L1 within the human genome (Moran and Gilbert 2002).
SINEs are non-autonomous elements that are L1 retrotransposition-dependent. The two main families of SINEs, in humans, are Alus and SVAs. Alus are, by far, the most common (copies-wise) retrotransposon in our genome. The typical full-length Alu element is ~300 bp long and has a dimeric structure determined by the fusion of two 7SL-RNderived monomers (Kriegs et al. 2007); those two monomers are separated by an A-rich linker region. The Alu 5’ region contains an internal RNA polymerase III promoter and the element ends with an oligo dA-rich tail of variable length.
SVAs are hominoid-specific retrotransposons and are named after the three components of their sequence: an antisense Alu-like region, a Variable Number Tandem Repeats (VNTR) region and the 3’LTR of the endogenous retrovirus HERV-K10 (SINE-R) (Wang et al. 2005); they also terminate in a poly(A) tail. The VNTR region is composed of a variable number of copies of a 35–50 bp sequence, 490 bp in total on average, that is derived from the 3’ end of the ENV gene. More than half of the SVA elements in human genomes are full-length (~2kb), but may vary in size as a result of polymorphisms in their VNTR region copy number (48-2306bp) (Wang et al. 2005). It seems that they do not have an internal promoter, but they could have a sequence with promoter activity within the flanking portion of element (Wang et al. 2005).
12
Retrotransposition
Retrotransposition (Figure 3) starts with the generation of a full-length L1 mRNA from a preexisting L1 in the genome that is subsequently translated to generate a RiboNucleoprotein Particle (RNP) (Moran and Gilbert 2002; Deininger et al. 2003). The L1 RNP is a retrotransposition intermediate that contains both the L1 proteins and their encoding mRNA, associated in cis. Indeed, this preferential association, or cis-preference, likely represents a mechanism whereby L1 has ensured its evolutionary success as RC-L1 RNPs will most frequently mobilize RC-L1 mRNAs (Moran and Gilbert 2002; Moran et al. 1996; Wei et al. 2001; Goodier and Kazazian 2008). In some cases, however, ORF1 and ORF2 proteins can bind other cellular mRNAs (including Alu and SVA mRNAs), thus mobilizing them in trans (Ohshima et al. 2003; Beck et al. 2011); this way, non-autonomous retrotransposons are able to retrotranspose by utilizing L1-encoded proteins.
13
The RNP is then re-introduced in the nucleus where retrotransposition takes place with a process known as Target-site Primed Reverse Transcription (TPRT). In TPRT, the L1-encoded EN recognizes and cleaves a loose consensus sequence, liberating a free 3'OH that is used by the L1-encoded RT to prime first strand cDNA synthesis (Moran and Gilbert 2002; Goodier and Kazazian 2008; Beck et al. 2011). It is thought that the same activities are involved in second strand cDNA synthesis, resulting in a new N-LTRr inserted elsewhere in the genome.
Notably, most de novo N-LTRr insertions are flanked by variable size Target Site Duplications (TSDs) and L1 insertions are often 5'-truncated (Moran and Gilbert 2002; Goodier and Kazazian 2008). Thus, it is possible that 5' truncation could represent a host defense mechanism that reduces the number of potentially active L1s in a genome by aborting reverse transcription before the element can be copied in full.
Host defense mechanisms
Retrotransposition and the cellular DNA repair machinery are known to interact at least in cell culture retrotransposition assays (Morrish et al. 2002; Morrish et al. 2007; Suzuki et al. 2009); various host factors seem to be also involved in discrete stages of retrotransposition and the 5' truncation process (during or immediatly after TPRT), such as the polymerase-delta-associated sliding DNA clamp PCNA, key nonsense-mediated decay factor UPF1 and interactors PABPC1 and MOV10 (Taylor et al. 2013).
N-LTRrs are regarded as potentially very dangerous for their host genomes because of their high mutagenic potential. Their activity has been previously associated with apoptosis, DNA damage and repair, tumor progression, cellular plasticity, and stress response. Currently, 124 insertions of L1s, Alus, and SVAs in humans are known to be disease-causing in the germline (Goodier 2016). Studies have characterized several defense mechanisms that act against N-LTRrs mobility other than the common 5’ truncation of new integrants, such as APOBEC proteins (Wissing et al. 2011), the exonuclease Trex1 (Stetson et al. 2008), Piwi proteins and Piwi-interacting RNAs (Malone and Hannon 2009), DNA methylation (Bourc’his and Bestor 2004; Yoder et al. 1997), the Aicardi-Goutières syndrome gene product SAMHD1 (Zhao et al. 2013) and small RNAs generated by the antisense L1 promoter (Yang and Kazazian 2006). These host mechanisms act to control currently
14
active N-LTRrs and likely could have contributed to reduce the mobility of previously active subfamilies, but may require co-evolutionary fine-tuning to control the mobilization of future sub-families (Muñoz-Lopez et al. 2011).
However, these researches do not explain the proliferation of N-LTRrs which, together with the aforementioned impact that insertions can have on their target loci, seems to point out at a possible functional role for N-LTRrs in their host genomes.
Aims of the study
In this study, we aimed to explore the role of N-LTRrs in the differentiation and evolution of the genus Homo. In order to do that, we compared the repertoire of Retrotransposon Insertions (RIs) present in the genome of modern humans with those present in modern-day chimpanzees, as well as with those of our closest extinct relatives, Neanderthals and Denisovans.
Although often discussed and speculated, the effects and implications of RIs on the evolution of the human lineage are mostly unknown. Here, and for the first time, we evaluated the potential impact of RIs in our species differentiation; additionally, we have also analyzed how RIs that are specific to AMH and absent in HN, HD and chimpanzees could have affected the genomic loci surrounding them. In order to shed light on the molecular dynamics of AMH differentiation and evolution, we aimed at characterizing Rl locations, identifying potential selective pressures and inferring functional/regulatory alterations that might have occurred as a consequence of species-specific RIs. Thus, the reconstruction of the mechanisms through which retrotransposition impacted the evolution of the human lineage can allow for a better understanding of how our genome is evolving in real time.
15
METHODS
RI identification between AMH and HN/HD
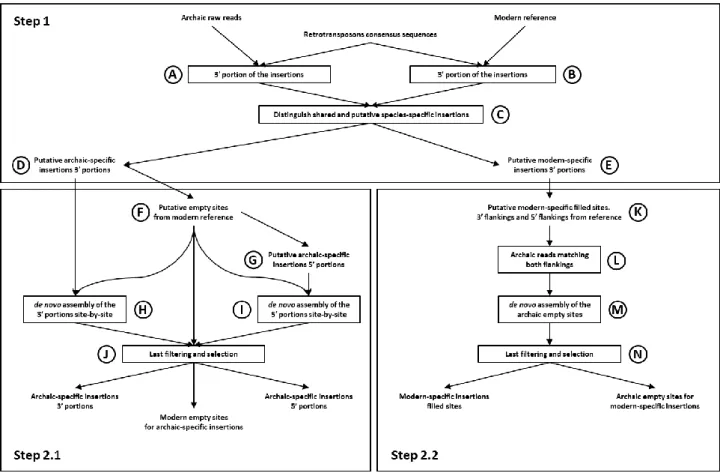
Available RI identification tools such as RetroSeq (Keane et al. 2012), Tangram (Wu et al. 2014), Tea (Lee et al. 2012), MELT (Gardner et al. 2017), etc. are primarily based on mapping paired-end DNA-sequencing reads. However, and given that a large portion of previously sequenced ancient DNAs is composed of single-ended reads, here we devised a methodology for detecting differentially present RIs in AMH, HD and HN genomes based on single-ended reads (Figure 4). In particular, our methodology is intended to identify confirmed species-specific RIs upon which to infer the impact that RIs might have had in our species differentiation. The methodology uses well-known bioinformatic tools such as the BLAST+ package (Camacho et al. 2008), ABySS (Simpson et al. 2009), BEDTools (Quinlan and Hall, 2010) and RepeatMasker (Smit et al. 2013-2015), implementing them with custom R or Perl scripts for filtering, conversion and general data management.
Figure 4. Schematic representation of the methodology used for RI identification between pairs of compared
16
The methodology was designed on a simulated dataset composed of 100 random locations in the human reference genome GRCh37-hg19, bot genic and intergenic. In 50 of the 100 random loci, an RI was artificially added simulating a non-reference retrotransposition event, while in the other 50 an existing reference RI was artificially removed reconstructing an empty (pre-insertional) site. RI artificially added or removed accounted for Alu, LINE-1 and SVA elements, both full length and truncated. All the thresholds used during the procedure (most notably blastn ones) were defined in order to retrieve all simulated insertions. After successfully completing the simulated procedure, the same methodology and thresholds were optimized and finally applied to real genomic data.
Step 1) We retrieved consensus sequences of the most recent non-LTR retrotransposons from RepBase (Bao et al. 2015) (AluYa5, AluYb8, AluYb8a1, AluYb9, AluYb10, AluYb11, AluYk13, LINE-1HS, SVA_A, SVA_B, SVA_C, SVA_D, SVA_E, SVA_F), as well as the genomic material of the species to compare (reference sequence GRCh37-hg19 for AMH, the raw reads of the DNA sequencing for both HN and HD). Specifically, the genomes analyzed in this study are those of two individuals, a Neanderthal and a Denisovan, who lived in the Denisova cave at different times (Meyer et al. 2012; Prüfer et al. 2014). These two genomes were selected for their relatively high coverage and ready availability. The selected retrotransposon sequences were identified in both genomes using blastn (A,B), setting the identity parameter to 95%. This was done in order to allow the identification of retrotransposons diverging as much as 5% from their consensus sequence. Because of the repetitive nature of TEs, each insertion has been associated to its unique genomic target. For AMH, this was done by extending TEs matches by 100 bp in the 3’ direction and in the 5’ direction in the reference sequence (3’ and 5’ flanking sequences). The same could not be done for the archaic DNA, having reads averaging 100 bp as a starting point. Many new retrotransposon insertions are 5’ truncated, thus the length and 5’ end of an insertion is not known beforehand. For this reasons, we implemented a custom R script to select the reads that matched at least 30 bp of the 3’ end of the retrotransposon’s sequence and that had at least 30 bp of flanking sequence in the 3’ direction. In order to take account of differential length of the insertions poly-A tails in respect to the consensus sequences we allowed for 25 bp of margin between insertions and flankings. The sequences of the 3’ ends of insertions with their respective flankings were then compared between the
17
two species using blastn, with identity parameter set to 95% (C). Sequences that were present in one species’ DNA and not in the other were selected as putatively species-specific insertions, thus producing two lists: putative archaic-specific insertions 3’ portions (D) and putative modern-specific insertions 3’ portions (E). Step 2.1) The 3’ flanking portions of the putative-archaic specific insertions were used to identify their respective “empty” (pre-insertional) sites in the AMH genome, aligning them with blastn (identity 95%). The selected 3’ portions of the empty sites were extended in the 5’ direction, thus retrieving the sequence corresponding to the 5’ flankings to the putative archaic-specific insertions. The whole empty sites from the AMH genome (200 bp long) and their 3’ and 5’ portions (both 100 bp) were classified in separate sets, using shared codes for sequences belonging to the same site (F). Then, the 5’ portions of the modern-specific empty sites were identified in the archaic DNA-sequencing reads library, using blastn (identity 95%). We then filtered archaic reads containing a match of at least 30 bp to a modern-specific “empty” site’s 5’ portion and at least 30 bp of non-matching bases 3’ of them. These reads should thus contain both the 5’ flanking site and the 5’ terminal portion of the RI (G). The reads pertaining to the two sets of putative archaic-specific insertions 3’ and 5’ portions were associated to their corresponding modern-specific “empty” sites. This allowed to perform de novo assemblies site-by-site using the software ABySS (parameter k set to 40, H,I). Only sequences that were unambiguously assembled for both the 3’ and 5’ portions and that had a clear match for a modern-specific empty site were kept to produce the final sets of confirmed archaic-specific insertions 3’ and 5’ portions, as well as confirmed empty sites from the AMH reference genome (J).
Step 2.2) The putative modern-specific insertions 3’ portions were extended to cover the full insertion as well as 100 bp of flankings in both directions (K). Archaic DNA reads were matched against the 3’ and 5’ flanking sequences using blastn (identity 95%). Reads with at least 30 bp match to both flanking sequences were selected. By doing this, the selected reads spanned the whole empty (pre-insertional) site (L). After associating the archaic reads corresponding to the putative empty sites to their respective modern-specific insertions, de novo assembly site-by-site was performed with ABySS (parameter k set to 40, M). Only putative modern-specific insertions whose flankings corresponded to an unambiguously assembled archaic empty site were selected as confirmed AMH-specific insertions (N).
18
RI identification between AMH and chimpanzee reference sequences and RT-DB
In order to identify RIs differentially present in the genomes of AMH and chimps, we first retrieved all RI from element families which are known to have been recently active (all AluJ, AluS and AluY subfamilies, all LINE-1HS and LINE1-PA subfamilies, all SVAs) in the two species reference sequences (GRCh37-hg19 and panTro5) from RepBase (Bao et al. 2015). The 5’ and 3’ flanking regions (100 bp) for all retrieved insertions were aligned using blastn (identity 95%) to the genome of the other species in order to find the respective putative empty (pre-insertional) sites. Two matching sequences (at least 85 bp), in close proximity to each other (less than 50 bp), were selected as a putative “empty” site for each “filled” site. These putative empty sites were then aligned back to the first species DNA using blastn (identity 95%) in order to confirm them as pre-insertional loci. After this procedure, we obtained the insertions specific to the first species (i.e. absent in the second) and vice versa.
We also generated a database of insertions, called RT-DB, that contains RIs retrieved from the human reference sequence GRCh37-hg19. RT-DB represent all reference insertions of AluS and AluY subfamilies, LINE-1HS, LINE-1PA2, LINE-1PA3, LINE-1PA4 and all SVAs (~666,000 RIs).
Computational validation procedure
After RI identification, all insertions were validated computationally. Putatively modern-specific RI were selected for having only one matching empty (pre-insertional) site unambiguously assembled from ancient DNA reads. All validated AMH-specific insertions and their absence from the assembled archaic empty sites were verified using RepeatMasker. Putatively archaic-specific insertions were instead selected for having unambiguously assembled both portions of each insertions and matching only one empty (pre-insertional) site in the modern reference genome. All archaic-specific insertions 3’ and 5’ portions were verified with RepeatMasker, as was their absence from the modern-specific empty sites. All archaic- and AMH-specific insertions were also verified for presence of the poly-A tail of the inserted element and TSDs flanking the RI.
19
Archaic-specific insertions in 1000 Genomes populations and inter-specific RI estimation
All archaic specific insertions loci were checked in 1000 Genomes (1KG) Phase3 (The 1000 Genomes Project Consortium 2015) .vcf files for the identification of non-reference variants present in modern day individuals. Archaic RI frequency was then averaged in modern populations according to the 1000 Genomes project annotations.
In order to estimate the amount of RI insertions that are polymorphic between populations we checked for the presence of Archaic RI in one AFR individual, then incrementally added other AFR individuals to the comparison. The rate by which polymorphic insertions were identified produced a curve that reaches a plateau after 20 individual confrontations. Applying this model to AMH insertions results in estimated 554 and 376 non-polymorphic-between-species AMH insertions (vs HN and HD respectively).
Assessment of AMH-specific RI in 1KG samples and frequency-based population tree
AMH-specific insertions present in the human reference GRCh37-hg19 may be polymorphic within the broader human population. However, lack of aligned reads spanning the insertion is, in itself, necessary but not sufficient to diagnose the absence of a given insertion within an examined resequenced genome. Even if present, indeed, given the high similarity to other copies of the same transposable element elsewhere in the genome, a given insertion may display no aligned reads due to multiple-mapping filterings. To assess presence/absence of a given insertion we therefore estimated the average coverage of the 1100 bps up and down-stream (“surroundings”) of a putative insertion site and compared it with the coverage of the first and last 10 bps within the RI itself (“interfaces”). We therefore avoided any inference based on the coverage of the “core” inserted sequence, since this may have been affected by the multiple-mapping issues described above. We, instead, reckoned that the first and last 10 bps at the interface between the RI and the surrounding loci could be considered unique enough for the mapping algorithm to see them as a single mapping hit. Based on the reads available from the 1000Genomes Phase3 .bam files (The 1000 Genomes Project Consortium 2015) we then considered as:
20
- “diploid present” an insertion displaying a coverage >0 at both interface regions and where at least one interface region shows a coverage greater than ½ of the average surrounding coverage;
-“haploid present” an insertion displaying a coverage >0 at both interface regions and where both the interface regions show a coverage smaller than or equal to ½ of the average surrounding coverage;
- “absent” if at least one of the interface regions or the surroundings have zero coverage.
Our assessment approach is conservative with respect to the presence of a given insertion, since it is designed to overestimate absence. We then calculated population frequencies of presence of any given insertion, based on all the individuals available from 1000 Genomes Phase 3 (The 1000 Genomes Project Consortium 2015).
For each RI we calculated the absolute delta frequency per each pair of populations and we averaged it for all the insertions. The obtained matrix of average differences in presence/absence of human specific insertions was used to build a neighbour joining tree using the Ape R package (Paradis et al. 2004).
TMRCA estimates of genetic regions surrounding AMH-specific RI
The time to the Most Recent Common Ancestor (TMRCA) of each 10kbp regions encompassing a given insertion was estimated as described elsewhere (Inchley et al. 2016) based on 1000 Genomes sequences of AFR samples to avoid potential backwards biases due to the documented Neanderthal introgression in Eurasians (Green et al. 2010). All AFR individuals, and not only carriers of an insertion, were used for this calculations.
3P-CLR selection estimates for regions surrounding an insertion
For the sites surrounding AMH-specific insertions we aimed at identifying those that underwent positive selection after the split between Africa and Eurasia but prior to population differentiations within Eurasia. To do so, we used the Three Population Composite Likelihood Ratio (3P-CLR) statistic (Racimo 2016), to look for regions in the EGDP dataset (Pagani et al. 2016) that show evidence of selection that likely occurred shortly after the expansion out of Africa. The 3P-CLR statistic assumes a 3-population tree model with no post-split
21
migration. To ensure that the individuals used in the 3P-CLR analyses represent the most basal split within living Eurasian populations , we used for our EAS population only Chinese and Japanese individuals from the Mainland East and Southeast Asia macro-population. The EUR individuals used were a random subset of the South and West Europe and East and North Europe populations. The AFR outgroup population consisted of the Yoruban individuals from the EGDP dataset (Pagani et al. 2016). Following indications (Racimo 2016), 100 SNPs (with at least 20 SNPs between them) were sampled in each window of length 1cM. Upon completion of the scan, sampled SNPs were grouped into 200kb bins that were assigned the maximum 3P-CLR score of the sampled SNPs in the window. Windows containing an AMH-specific insertion site and falling within the top 99th percentile of scores from this 3P-CLR test were considered to be under selection along the shared Eurasian branch.
AMH-specific RI, genes and preferential expression
In order to infer characteristics of the sites where AMH-specific RIs occurred, or impact they might have had on their insertional loci in cis, gene- and transcript-annotation tracks for the human reference genome GRCh37-hg19 were retrieved from ENSEMBL (Aken et al. 2016). RI loci for the different databases were identified in those tracks for information on genes containing RI.
Four gene-tracks (All Genes, genes with RT-DB insertions, genes with AMH-specific vs chimp insertions and genes with AMH-specific vs HN/HD insertions) were thus produced and compared for gene proportions and number of annotated transcripts, as well as gene length. Proportion of RI occurred in genes were compared between the tracks and tested with Fisher and binomial tests in R.
The tracks were divided in series containing the number of annotated transcripts for each gene and the gene’s total length, which were then compared between each other and tested with Wilcoxon and Kolmogorov-Smirnov tests in R.
Spearman’s non-parametric correlation tests between gene length, number of transcripts and number of RT-DB insertions (two at a time) were also performed, followed by a partial correlation test between number of transcripts and number of insertions in function of gene length. These tests were executed (in R, functions
22
cor.test and pcor.test respectively; parameter method=”spearman” in both cases) in order to exclude biases due to gene length and its impact on the random chance to observe features associated with it.
Functional annotation data on genes belonging to the aforementioned four tracks were also retrieved from DAVID Bionformatics Resources v6.8 (Huang et al., 2009). For general preferential expression information, nomenclature of tissues belonging to cohesive histological complexes was merged under the categories “Brain”, “Testis”, “Epithelium”, “Placenta”, “Uterus”, “Lung”, “Liver”, “Lymph”, “Kidney”, “Eye”, “Muscle”, “Blood”, “Colon” and “Pancreas”. Only tissues individually called for preferential expression by at least 5% of all human genes were selected for the comparison.
For genes preferentially expressed in the brain, the categories were unpacked into “Brain (general)”, “Undifferentiated Neurons”, “Cerebellum”, “Amygdala”, “Hippocampus”, “Peripheral Nervous System”, “Thalamus”, “Cajal-Retzius Cells”, “Cortex”, “Pituitary”, “Hypothalamus”, “Caudate Nucleus”, ”Dendritic Cells”, “Substantia Nigra”, “Subthalamic Nucleus”, “Corpus Callosum”. In this case, only tissues individually called for preferential expression by at least 0.5% of all human genes were selected for the comparison. Tissue-by-tissue comparisons were tested using Fisher and binomial tests in R.
The lengths of genes displaying preferential expression in the different tissue types were also compared via a pairwise Wilcoxon test (pairwise.wilcox.test function in R with parameter p.adjust.method=”bonferroni”). This generated a matrix of p-values (one for each possible pairwise comparison), which was then inverted (1 - p-value) and used as a matrix of distances for a cluster analysis (hclust function in R, parameter method=”average”). A boxplot highlighting the length of the genes preferentially expressed in the various tissues and a dendrogram showing how the categories clustered in function of gene length were then plotted in R.
Gene Ontology functional analyses
To identify the gene-ontology category of the genes targeted by the AMH-specific RI, both vs chimp and HN/HD, we used ToppCluster (Kaimal et al. 2010), which allows the identification of biological programs using different gene sets to perform contrast and comparative analysis. ToppCluster was set with a
false-discovery-23
rate (FDR) threshold of 0.05 and using “GO: biological process” annotation. The obtained matrix was used to compute the –log10 p-values to obtain significance scores for each functional term. Next, to reduce the redundancy within the GO terms, we used REVIGO (Supek et al. 2011) with parameters set to C=0.7, similarity measure “SimRel” (Schlicker et al. 2006) and using the Homo sapiens database. The scatterplots showing the representation of clusters from multidimensional scaling of the semantic similarities of GO terms were obtained with R. We used these plot to identify GO terms related with similar biological functions and the associated genes were used as input for GENEMania (default parameter) (Warde-Farley et al. 2010). The networks obtained from REVIGO were downloaded and visualized with Cytoscape (Christmas et al. 2005).
Case studies insertional loci annotation and functional inference
The three AMH-specific RI absent in both HN and HD that were identified as recent and displaying peculiar population distribution (see paragraph “Evidences of RIs contribution in the molecular differentiation of AMH” in the RESULTS chapter) were manually characterized using the UCSC Genome Browser (Speir et al. 2016), including genomic insertional locus, conservation of the sequence among primates, RepeatMasker presence/absence of repetitive elements, gene- and transcript-annotation.
To identify splicing motifs at the level of the insertion in the gene SHTN-1 we used Human Splicing Finder (HSF 3.0) (Desmet et al. 2009). HSF 3.0 was interrogated with the sequence of the RI + 100bp of flanking regions and with the reconstructed flanking without the RI itself. This was repeated for the whole intron where the insertion occurred and for the reconstructed intron lacking the specific RI, in order to assess its possible effect in splicing-alteration.
25
RESULTS
RIs identification
After comparing the genome of AMH to those of HN and HD we identified: i) 507 HN-specific and 331 HD-specific putative RIs, and ii) 3215 and 7185 putative AMH-HD-specific RIs vs HN and HD, respectively.
As for the comparison between AMH (GRCh37-hg19) and chimpanzee (panTro5) genomes, we retrieved all RIs annotated in RepBase (Bao et al. 2015) in these two genomes and analyzed the presence/absence of the insertions in the reference sequences of the two species.
Next, we developed a computational validation procedure, through which we managed to eliminate all those insertions that presented uncertainties in mobile element subfamily attribution or whose location might be ambiguous (see METHODS for details). Thus, the following analyses were only performed on the most reliable canonically-inserted RIs identified (Figure 5).
Figure 5. Examples of RI sequences identified by our methodology.
For HD- and HN-specific insertions, the three sequences represent: empty (pre-insertional) site in the modern human reference GRCh37-hg19, 5’ and 3’ portions of the insertion with flankings assembled from the archaic species DNA. For Chimp- and AMH-specific RI, the sequences are: empty (pre-insertional) site in one species reference genome, insertion with flankings in the other species’ reference genome. In all sequences, the inserted retrotransposon is represented in blue, the poly-A tail in yellow, the TSDs flanking the insertion or the single copy of the pre-insertional Target Site in red. The black rectangles on the empty (pre-insertional) sites indicate the exact location where the element inserted.
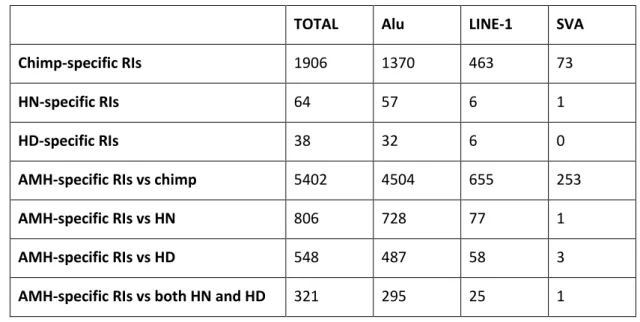
A number of species-specific RIs were computationally validated: 1906 Chimp-specific, 38 HD-specific, 64 HN-specific, 5402 AMH-specific (against chimps), 548 AMH-specific (against Denisova) and 806 AMH-specific
26
(against Neanderthal) (Table 1). The validation method thus excluded approximately 87% of the identified insertions that could present any sort of bias or uncertainty in attribution. Of the validated AMH-specific RIs, 321 were present in the modern human genome and were absent in both HN and HD genomes (Supplemental Table 1).
Table 1. Identified and validated RIs in chimpanzee, HN, HD and AMH genomes.
A large dataset (defined as RT-DB) of ~666,000 reference retrotransposon insertions from the most recent subfamilies of N-LTRrs (i.e. AluS, AluY, LINE-1HS, LINE-1PA2, LINE-1PA3, LINE-1PA4 and all SVAs) present in the reference GRCh37-hg19 was retrieved in order to assess if characteristics of loci targeted by AMH-specific insertions were random, retrotransposition-dependent or peculiar to the human lineage. The comparison of the identified insertions with RT-DB ones revealed that the activity of N-LTRrs in the human lineage has remained constant. Consistently, Alu RIs are far more common than LINE-1 RIs, while SVAs produced only a handful of insertions.
These results strongly suggest that the retrotransposition rate, or insertion maintenance rate, in the human lineage has remained relatively constant (0.6-0.8 insertions/Ky) and, consistently with previously reported results (Hormozdiari et al. 2013), that the rate of RI accumulation in humans has been approximately 2.5 times higher than in chimps (0.29 insertions/Ky).
TOTAL Alu LINE-1 SVA
Chimp-specific RIs 1906 1370 463 73
HN-specific RIs 64 57 6 1
HD-specific RIs 38 32 6 0
AMH-specific RIs vs chimp 5402 4504 655 253
AMH-specific RIs vs HN 806 728 77 1
AMH-specific RIs vs HD 548 487 58 3
27
Archaic-specific RIs and insertional polymorphisms
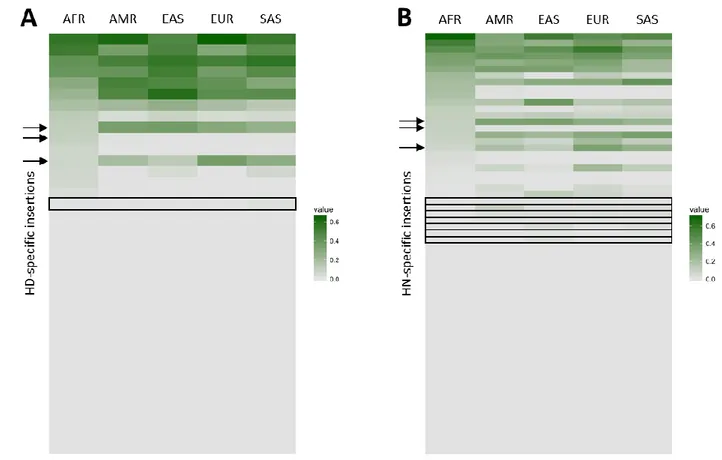
HD- and HN-specific RIs (38 and 64, respectively) were compared between th two species and with present-day AMH populations data from 1000 Genomes Project Phase 3 (Figure 6A-B) (The 1000 Genomes Project Consortium 2015). Based on the available 1000 Genomes Project data, three RIs were found in both archaic species, while nearly half of them (49 out of 102) are polymorphic to various degrees in modern populations. Interestingly, 8 of the insertions (1 HD-specific and 7 HN-specific) are absent in African (AFR) individuals and present at a low frequency only in some (or all) non-AFR populations.
Figure 6. Heatmaps of HD-specific (A) and HN-specific (B) RI distribution in present-day populations.
Each line of the maps represents a single insertion, intensity of the color from grey to green indicates the frequency in modern populations. Arrows indicate three insertions that were identified as shared between HN and HD, rectangles highlight insertions that are putatively introgressed in modern populations post Out-of-Africa.
28
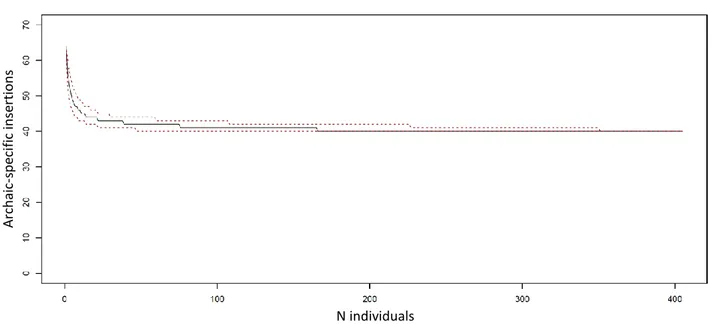
Thus, we speculate that these RIs might have introgressed in AMH via admixture with the archaic species after Homo sapiens migrated out of Africa. Conversely, given the documented presence of Neanderthal introgressed sequences within the genome of Eurasians (Green et al. 2010; Prüfer et al. 2014; Gardner et al. 2017), which in turn forms the majority of the human reference sequence, it may be the case that HN and HD specific insertions present on the human reference due to archaic introgression escaped our detection. Since some putative archaic-specific RIs are polymorphic in modern humans, it is likely that at least some putative modern-specific insertions might be polymorphic in archaic populations as well; unfortunately, we would need many more available ancient genomes to properly test this. However, in order to estimate the number of potential polymorphic AMH-specific insertions, we took advantage of the large amount of population genetics data provided by the 1000 Genomes project, particularly AFR populations, who are less likely to host Neanderthal-derived genomic traits. Indeed, by randomly sampling AFR individuals we observed that a few samples would be sufficient to identify the vast majority of the archaic-specific polymorphic insertions, reaching a plateau at n=20. Similarly, ~45% of the putative species-specific insertions were shown to be polymorphic (Figure 7).
Figure 7. Simulated curve representing random sampling of AFR individuals for the identification and
exclusion of polymorphic archaic-specific insertions.
Red dotted lines indicate 95% confidence intervals.
Arch aic -s p eci fic in se rtio n s N individuals
29
On the other hand, we observed that the 321 detected RIs that were present in AMH and absent in both archaic genomes fall below the ~45% threshold identified with the above procedure (considering polymorphisms against both HD and HN individually). This fact, together with the observation that HD and HN genomes are more divergent than two randomly-chosen AMH genomes (Reich et al. 2010), suggests that the above mentioned 321 insertions may be considered as reliable and truly AMH-specific.
AMH-specific RIs in present-day populations
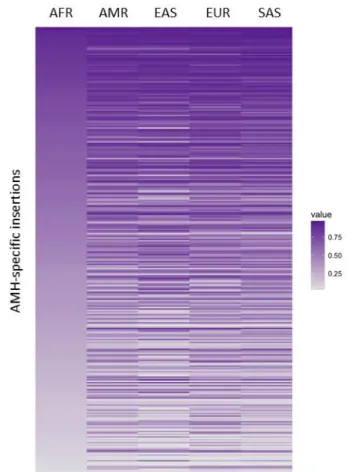
The fact that the detected 321 AMH-specific RI are present in the human reference sequence (GRCh37-hg19) does not necessary imply that they are fixed in all human populations. We therefore evaluated their distribution in present-day populations by comparing the coverage of the unique 3’ and 5’ flanking regions with that of the RI/flanking interface in 1000 Genomes Phase 3 data (Figure 8; more details in METHODS).
Figure 8. Heatmap of AMH-specific RI distribution in in present-day populations.
Each line of the map represents a single insertion, intensity of the color from grey to purple indicates the frequency in modern populations.
30
This analysis revealed that, of the 321 AMH-specific insertions, 24 (7,5%) appear to be fixed or almost fixed in all modern populations (allele frequency > 85%), while 8 (2,5%) are polymorphic in AFR individuals but fixed or almost fixed in all non-African populations (allele frequency < 65% in AFR and > 85% in non-Africans), suggesting that their fixation may be related to the Out-of-Africa event.
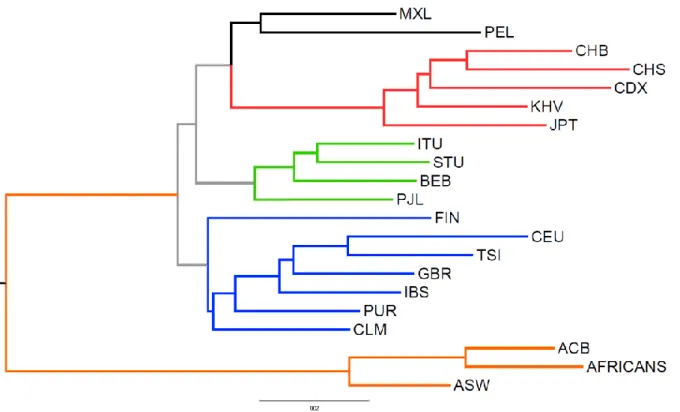
Interestingly, the patterns of RI distribution seem to closely reflect known pre-historic and historic migrations and population dynamics of AMH (Figure 9). In particular, populations of African descent are the more divergent and the Out-of-Africa groups cluster according to clear phylogenetic/phylogeographic relationships, with the expected exceptions of PUR and CLM who cluster with EUR populations and not with AMR, likely because of admixture during the re-colonization of North and South America (Montinaro et al. 2015).
Figure 9. Neighbour joining tree calculated by using AMH-specific RIs in present-day populations as
phylogenetic markers.
Branches in orange are from populations with African descent, blue for European descent, green for South-Asian descent, red for East-Asian descent and black for Native-American descent, as clustered by RI distribution.
Times to the Most Recent Common Ancestor (TMRCA) were also calculated for 10kbp sequences (Inchley et al. 2016) surrounding each insertion site (details in METHODS). Of the 24 insertions that are fixed or almost
31
fixed in al modern populations, we selected those showing a TMRCA compatible with the split between AMH and HN/HD (TMRCA < 800 Kya) as potential candidates for selection/spread along the AMH lineage. Accordingly, we identified two RIs (8%), i.e. an AluYg6 insertion in chr1q25.3 that occurred in the gene EDEM3 and an AluYb9 insertion in chr10q25.3 that also occurred within the sequence of the gene SHTN1. Similarly, only one of the 8 AMH-specific insertions that are likely fixated post Out-of-Africa, an AluYa5 insertion in chr16q22.1, also displays a recent TMRCA. However, it is worth noting that TMRCA estimates were obtained from all the AFR individuals and not only from the carriers of an insertion; therefore, they must only be considered as a general indicator of the “age” of a given site surrounding an insertion or, in other words, as an upper-limit for the retrotransposition event itself.
Three Population Composite Likelihood Ratio (3P-CLR) statistic (Racimo 2016) was also performed on 200kbp loci surrounding each insertion. This analysis revealed that 28 (9.2%) out of the 306 AMH-specific RIs autosomal insertional loci are within the top 0.1% of loci subjected to post Out-of-Africa selection (details in METHODS).
Genomic features of loci targeted by AMH-specific RIs
The huge amount of genetic and genomic data presently available on modern humans allowed us to perform different exploratory analyses on the AMH-specific RIs and their surrounding genomic loci, aimed at evaluating the possible impact of RIs in our species evolution.
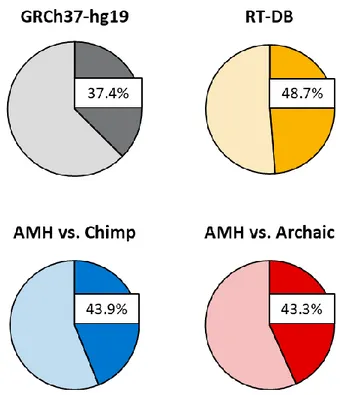
First, we compared selected datasets of RIs (RT-DB, AMH-specific vs chimp and AMH-specific vs both archaic species) with the ENSEMBL gene annotation (Aken et al. 2016) of the reference sequence GRCh37-hg19. We determined that 15367 genes contain insertions of RT-DB (48.7% of the insertions), 1779 genes contain AMH-specific vs chimp RIs (43.9% of the insertions) and AMH-AMH-specific RIs targeted 139 genes after the split with HN/HD (43.3% of the insertions) (Figure 10).
These data suggests that RT-DB insertions targeted genes and gene-related sequences, or have been maintained throughout evolution in those sequences, ~30% more frequently than randomly expected in
32
respect to gene-size/genome-size (p-value < 10-16), while AMH-specific RIs, both vs chimp and vs HN/HD, occurred in genes ~17% more frequently than expected (p-values < 10-16 and < 0.05 respectively).
Figure 10. Proportion of ENSEMBL-annotated genes in the whole reference genome GRCh37-hg19 (grey),
proportion of insertions that occurred in annotated genes for RT-DB insertions (yellow), AMH-specific RI vs chimp (blue) and AMH-specific RI vs both HN and HD (red).
In each diagram, the darker color denotes the percentage of RIs inserted in genes vs RIs inserted in non-genic regions (lighter color).
In addition, the ENSEMBL gene-annotation data revealed that, in general, the majority of genes in AMH genomes tend to have a low number of annotated transcript/splicing variants, with a decreasing trend between the proportion of genes and the number of transcripts (7.584 on average; mode: 1 transcript/gene). Intriguingly, the comparison of genes targeted by RIs in the human lineage with all others present in AMH genomes (Figure 11) revealed an average increase in the number of transcript and splicing variants for those genes that contain RT-DB insertions (8.428 on average, mode: 3 transcripts/gene; p-value < 10-16). Notably, this trend increases further when analyzing RIs that likely inserted after the split with chimps (9.728 on average, mode: 5 transcripts/gene; p-value < 10-16) and after the split with HN/HD (9.863 on average, mode:
33
8.5 transcripts/gene; p-value < 10-6). Consistently, genes targeted by AMH-specific RIs, both vs Chimp and vs HN/HD, also have more annotated transcripts than genes containing RT-DB insertions (p-values < 10-11 and < 0.005 respectively).
Figure 11. Number of annotated transcripts of genes targeted by retrotransposition.
Proportion of genes per number of annotated transcripts for all ENSEMBL-annotated genes in the reference genome GRCh37-hg19 (black dotted line), for genes targeted by RT-DB insertions (yellow lines), for genes containing AMH-specific RIs vs chimp (blue bars) and for genes with AMH-AMH-specific RIs vs both HN and HD (red bars). Below the graph, the table shows statistical significance of the differences between the series calculated with Kolmogorov-Smirnov tests.
We performed further analyses on genes containing RT-DB insertions in order to exclude a possible bias for gene length in the previously reported results. Indeed, a clear correlation is present between number of RIs and number of transcriptional variants (Rho = 0.284, p-value < 10-16), but a strong correlation also exists between gene length and both parameters (Rho = 0.799 with number of RIs, Rho = 0.267 with number of
34
annotated transcripts, both p-values < 10-16). Thus, we performed a partial correlation test between the number of RIs and transcript variants of genes in respect to their length, which resulted in a statistically significant association of the first two parameters even after accounting for the third (Rho = 0.122, p-value < 10-50). This test was repeated considering only genes containing AMH-specific RIs absent in chimps and AMH-specific RIs also absent in both HN and HD: in both cases the correlation between number of RIs and number of transcripts after accounting for gene length was confirmed (Rho = 0.196 with p-value < 10-16 and Rho = 0.240 with p-value < 0.005 respectively).
Next, we retrieved functional annotation data from DAVID Bioinformatics Resources v6.8 (Huang et al. 2009) and we obtained tissue-specific preferential gene expression information for 15126 out of 15367 genes with insertions from RT-DB, 1721 out of 1779 genes targeted by retrotransposition in the human lineage after the split with chimps and 124 out of 139 targeted after the split with HN/HD. Comparisons among these data show that genes targeted by retrotransposition tend to be more expressed than others in specific tissues (Figure 12). Genes containing RT-DB insertions tend to follow the general expression profile of all human genes, with a slight under-expression in some tissues (p-values < 0.05); however, genes targeted by AMH-specific RIs after the split with chimpanzees are more expressed than average in the brain and testis (+8.5% and +2.7% in absolute proportions respectively; p-value < 10-12 and < 10-2 ), while being less expressed in the uterus, lungs, liver, blood and pancreas (decreases between -1.8% and -3.1% in absolute proportions; all p-values < 10-2); finally, genes with AMH-specific RIs absent in both HN and HD are significantly more expressed in the brain and, with respect to genes targeted by RT-DB insertions, in testis (+13.8% and +7.5% in absolute proportions, p-values < 5x10⁻³ and < 0.05).
35
Figure 12. Preferential expression of genes targeted by retrotransposition.
Proportion of all human genes showing preferential expression in different tissues (grey bars); % increase or decrease in absolute proportions for preferential tissue expression of genes targeted by RT-DB insertions (yellow bars), genes containing AMH-specific RIs vs chimp (blue bars) and genes with AMH-specific RIs vs both HN and HD (red bars). Black asterisks mark significant differences between the series and all human genes while yellow asterisks mark significant differences between the series and genes targeted by RT-DB insertions.
We further analyzed genes preferentially expressed in the brain (Figure 13) and observed that genes targeted by RT-DB insertions follow the same expression pattern of all human genes; genes with AMH-specific vs chimps RI are generally highly expressed in the brain and seem to be even more expressed than average in the amygdala and hippocampus, as well as in undifferentiated neurons (+3.4%, +1.5% and +2.0% in absolute proportions respectively, p-values < 10-4 for the amygdala and < 0.05 for both hippocampus and undifferentiated neurons), while showing less expression in Cajal-Retzius and dendritic cells (-1.4% and -0.7% in absolute proportions, p-values < 10-3 and < 0,05); finally, genes containing AMH-specific RIs absent in both
36
HN and HD are significantly more expressed than average in undifferentiated neurons (+9.4% in absolute proportions, p-value < 10-2).
Figure 13. Preferential expression in the brain of genes targeted by retrotransposition.
Proportion of all human genes showing preferential expression in the brain divided by neural regions (grey bars); % increase or decrease in absolute proportions for preferential neural expression of genes targeted by RT-DB insertions (yellow bars), genes containing AMH-specific RIs vs chimp (blue bars) and genes with AMH-specific RIs vs both HN and HD (red bars). Black asterisks mark significant differences between the series and all human genes, yellow asterisks mark significant differences between the series and genes targeted by RT-DB insertions, blue asterisks mark significant differences between the series and genes targeted by AMH-specific RIs vs chimp.
37
Having previously evidenced a correlation between number of RIs present in genes and their length, we tested the possibility that genes showing preferential expression in specific tissues could exhibit a bias in relation to their length. We thus performed a pairwise Wilcoxon test between all series of lengths of genes preferentially expressed in the different tissues. This test showed a relative homogeneity of length of the various groups of genes, albeit with some pairwise confrontations resulting in statistically significant difference between the pairs of series (Figure 14).
Figure 14. Length of genes grouped by preferential expression.
Boxplot depicting the length of all human genes grouped by preferential expression. The letters under each box represent statistical similarity of the series (p-values < 0.05): two boxes sharing the same letter are not statistically different while two that do not share a letter are.
Furthermore, we used the obtained matrix of p-values of the pairwise comparison as a matrix of distances between the series in order to perform a cluster analysis on the different categories (Figure 15). This resulted in the distinction of 3 major groups of genes based on their length distribution: genes preferentially expressed in the Eye, Kidney, Epithelium, Brain and Testis are generally longer, genes expressed in the
38
Pancreas, Blood, Lung and Muscle are shorter, while genes expressed in the Colon, Lymph, Liver, Placenta and Uterus fall in between.
Focusing on genes preferentially expressed in the Brain, which have been highlighted as containing more AMH-specific insertions, they do not seem significantly larger than others and instead form a cohesive group with genes expressed in other tissues that do not seem to contain as many AMH-specific RIs. Thus, these results seem to imply that the impact of gene length on previous analyses (if any) was negligible.
Figure 14. Clustering of genes preferentially expressed in specific tissues based on their length.
Dendrogram representing a cluster analysis performed on all human genes grouped by preferential expression, using p-values resulting from the pairwise Wilcoxon test comparison between all series of length of the genes as a matrix of distances.
Gene Ontology of genes targeted by AMH-specific RIs
In order to examine the functionality of genes targeted by insertions, Gene Ontology (GO) analyses were performed on all genes targeted by AMH-specific RIs, both vs Chimp and vs HN/HD. ToppCluster analyses (Kaimal et al. 2010) revealed that, of the 238 GO terms identified between the two lists, 175 GO terms (73,5%)
39
were overrepresented in genes targeted by AMH-specific RIs vs chimp, whereas 23 (9,7%) were overrepresented in genes targeted by AMH-specific RIs vs both HN/HD (Figure 15).
Figure 15. Heat maps representing -log(p-values) of GO terms associated with genes targeted by
AMH-specific RIs vs chimp (top) and AMH-AMH-specific RIs vs both HN/HD (bottom), order for increased significance in the top row.
Next, we selected the GO terms that were enriched in one group of genes and not in the other as lineage-specific functionalities that might correspond to different moments in the evolution of the human lineage, i.e. hominid-specific GO terms (for terms enriched only in genes targeted by AMH-specific RI vs chimp) and sapiens-specific GO terms (for terms enriched only in genes targeted by AMH-specific RI vs both HN/HD). Interestingly, semantic similarity of hominid-specific GO terms showed that the most enriched functionalities of genes containing AMH-specific RI vs chimp are related to cognition, learning and memory capabilities, vocalization behavior, neuron recognition, dendrite morphogenesis, reflexes and regulation of locomotion (Figure 16). Remarkably, these functionalities associate in networks involving a large number of genes containing AMH-specific RIs vs chimp.
40
Figure 16. Scatterplot representation of the identified hominid-specific GO terms.
The x and y coordinates of the circles were derived from the Revigo analysis, based on multidimensional scaling of the matrix with the GO semantic similarity values. The functional categories associated with genes that form networks are highlighted and labeled.
Even more noticeably, for enriched sapiens-specific GO terms, all functionalities associated in networks are neural-related: synapse maturation and its regulation, neuron maturation and migration, gliogenesis and glia differentiation (Figure 17A-B).
41
Figure 17. Sapiens-specific GO terms.
A) Scatterplot representation of the identified sapiens-specific GO terms. The x and y coordinates of the circles were derived from the Revigo analysis, based on multidimensional scaling of the matrix with the GO semantic similarity values. The functional categories associated with genes that form networks are highlighted and labeled. B) Functionalities of sapiens-specific GO terms associated in networks (if applicable). Red terms are neural-related while blue terms are not.
Genes associated with these GO terms also form a complex network of interactions (Figure 18). Strikingly, two of the genes with the larger amount of interactions in this network are SHTN1 and EDEM3 (1st and 11th scores in order of significance), which contain the previously identified (see above) AluYg6 RI (chr1q25.3) and the AluYb9 RI (chr10q25.3) respectively.
42
Figure 18. Gene network of genes containing AMH-specific RIs absent in both HN and HD with neural
functionalities.
The larger the circle, the more the corresponding gene has interactions with other genes in the network. The sub-network showing strong interactions with the gene SHTN1 is highlighted in the top-right, while the sub-sub-network with more interactions with the gene EDEM3 is highlighted in the bottom-right.
Evidences of RIs contribution in the molecular differentiation of AMH
Since AMH-specific RIs seem to increase the variability of transcripts and tissue-preferential expression of their targeted genes, we next characterized in greater detail the insertional loci of the three “recent” insertions with a peculiar population distribution that were identified above in paragraph “AMH-specific RIs in present-day populations”. The first one, an AluYa5 RI in chr16q22.1 (Figure 19), is polymorphic in AFR populations (average frequency of 55%), but fixed or almost fixed in all non-African populations (with the highest difference in frequency between AFR and non-African populations). Although no role in functional alteration was detected for this RI in its insertional locus, the insertion is associated with signs of post
Out-43
of-Africa selection, as revealed by the 3P-CLR selection estimate that places its genomic locus in the top 0.1% loci.
Figure 19. Annotation of the genomic location and distribution in present-day populations of the AluYa5
insertion on chr16q22.1.
The insertion is highlighted in red. In the map, for each diagram, a darker color indicates the presence of the RI and a lighter one its absence.
The second RI analyzed, an AluYg6 insertion in chr1q25.3, is inserted in gene EDEM3 (mentioned above) and is estimated to be fixed or almost fixed in all AMH populations, while completely absent in chimps, HN and HD, as well as in other primates (Figure 20). Remarkably, there is a shorter EDEM3 annotated alternative transcript ending precisely in correspondence with the poly-A tail of the AluYg6 insertion, resulting in exonization of this RI. This alternative EDEM3 transcript is not annotated in chimpanzees, and we suggest that it is extremely likely that this transcript is a direct consequence of the AluYg6 insertion into gene EDEM3.
44
Figure 20. Annotation of the genomic location and distribution in present-day populations of the AluYg6
insertion on chr1q25.3.
The insertion is highlighted in red and a yellow rectangle highlights an alternative transcript that terminates precisely at the poly-A tail of the RI. In the map, for each diagram, a darker color indicates the presence of the RI and a lighter one its absence.
Finally, the third RI analyzed is an AluYb9 RI in chr10q25.3, which inserted in the 15th intron of the gene SHTN1, antisense in respect to the gene’s transcriptional directionality. This gene has the highest level of interaction in the previously identified network of neural genes. This specific RI is mostly fixed in all AMH populations and absent in HN, HD and chimp genomes, as well as in other primates (Figure 21).
The gene SHTN1 has various annotated transcriptional/splicing variants, two of which lack the first the two exons that flank the intron where the Alu insertion occurred. Intriguingly, the analyses of this intron with Human Splicing Finder 3.0 (Desmet et al. 2009), both as an “empty allele” (with the retrotransposon sequence removed and the original pre-insertional site reconstructed) and as a “filled allele” (with the AMH-specific
45
AluYb9 insertion), revealed that differences in the predicted Splicing Enhancing/Silencing Matrices are present between the two sequences. Remarkably, these analyses revealed the presence of putative splicing silencing peaks in the filed allele. The strongest peak is located precisely in the inserted AluYb9 sequence (Figure 22), suggesting that the Alu insertion may induce a splicing-silencing effect on the SHTN1 gene.
Figure 21. Annotation of the genomic location and distribution in present-day populations of the AluYb9
insertion on chr10q25.3.
The insertion is highlighted in red and yellow rectangles highlight annotated alternatively-spliced products for the gene in which the insertion occurred. In the map, for each diagram, a darker color indicates the presence of the RI and a lighter one its absence.
46
Figure 22. Splicing prediction in the sequence corresponding to the “filled allele” (top, containing the intron
and the AluYb9 insertion on chr10q25.3) and in the sequence corresponding to the “empty allele” (bottom, containing just the intron).
The sequence is oriented in the same transcriptional orientation of the gene, black dotted lines highlight the position of the RI. Pink and red lines represent Splicing Enhancer Matrices, green and blue ones Splicing Silencing Matrices; ochre lines represent the combined strength of Enhancer/Silencing Matrices on the sequence. Arrows highlight silencing signal peaks that occur precisely in the RI sequence.
47
DISCUSSION
In AMH, retrotransposition has been studied mostly for its mutagenic effects and implications in disease insurgence. On the other hand, knowledge about the molecular evolution of our genome relies mostly on simple markers such as SNPs, short InDels and large Copy Number Variants (CNVs), while the role of repetitive/complex regions of the genome is poorly understood. Among others, the complexity of analyses involving repetitive sequences and structural variations in conjunction with the widely used NGS sequencing technology is a challenging task. However, evidences from various Eukaryote organisms suggest that retrotransposition might play an important role in speciation and molecular evolution of genomes (Richardson et al. 2015).
In this study, we evaluated the possible impact of RIs on the differentiation processes that occurred in the human lineage and especially during AMH evolution. In order to do this, we first identified putative species-specific RIs across the genomes of AMH, HN, HD and chimpanzees (Table 1). Notably, the identified RIs reveal a relatively constant retrotransposition/maintenance rate in the human lineage (0.6-0.8 insertions/Ky), which is ~2.5x higher than the rate of N-LTRr mobility/maintenance in chimps (0,29 insertions/Ky). In sum, these data suggest that n-LTRr might have, in a constant manner, impacted our genome throughout the evolution of the human lineage more than they have affected the chimp lineage, despite chimpanzees’ shorter generation time. However, the impact of RIs described in this study is just a minor repertoire of the putative effect that RIs can exert on genome structure and regulation, as i) our study is limited to the identification of RIs on very limited sequencing information from Neanderthal, Denisovan and Chimpanzee genomes; and ii) in this study we could only analyze the impact of RIs in cis, although RIs are known to impact gene expression and genomic architecture both in cis and in trans (Garcia-Perez et al. 2016). Thus, we are just starting to uncover the role of n-LTRrs on human evolution, and future genomic studies on Neanderthals and Denisovans will help revealing the full impact of RIs on the evolution of the human lineage.