ANALYSING THE IMPACT OF RENEWABLE ENERGY REGULATION ON RETAIL ELECTRICITY PRICES
Elisa Trujillo-Baute,
University of Barcelona & Barcelona Institute of Economics, Chair of Energy Sustainability
Pablo del Rio (corresponding author)
IPP-CSIC
Pere Mir-Artigues,
UdL & Energy Sustainability Research Group (UB)
Abstract
Retail electricity prices have substantially increased in the last decade in the European
Union (EU) as a result of different regulations, raising the concern of policy makers. The
growth in the support costs for electricity from renewable energy sources (RES-E) has
often been singled out as a main driver of the increase in these prices. The aim of this
paper is to analyse the degree of influence of RES-E promotion costs on the evolution of
households as well as for industry, with the help of a panel data econometric model. Our
results show that the impact of renewable energy promotion costs on retail electricity
prices is positive and statistically significant, although relatively small. Differences across
consumer types can be observed. An increase of 1% in those costs induces an average
increase of only 0.023% in industrial retail prices and 0.008% in the residential retail
prices. This impact on retail prices is mediated by the type of support scheme which is
adopted, with price-based support instruments showing a greater effect than
quantity-based ones.
Keywords: Electricity prices, renewable energy, public support, feed-in tariffs, quotas.
1. Introduction.
A combination of targets and policies in the climate and energy policy areas has been adopted in the
European Union (EU) for both 2020 and 2030. The 2020 package sets three key targets: a 20% cut in
greenhouse gas emissions (GHG)(from 1990 levels), 20% of EU energy from renewable energy sources
(RES) and a 20% improvement in energy efficiency (European Council 2009). For 2030, these targets
include a 40% cut in greenhouse gas emissions compared to 1990 levels, a 27% share of renewable
energy consumption and 27% energy savings compared to a business-as-usual scenario (European
Council 2014). In its recent Winter Package, the European Commission (2016) recently presented a
package of measures with the aim to contribute to a sustainable energy system in its three dimensions.
These include environmental sustainability (CO2 mitigation and other pollutants), security of energy
supply (diversification and reliability of energy sources) and economic sustainability (a competitive
first, achieving global leadership in renewable energies and providing a fair deal for consumers (European
Commision 2016). In the area of RES, the package includes a revision of the renewable energy Directive,
with cost effective deployment and investor certainty being one of its main objectives (Schmidt 2016).
In this context, the EU and its Member States (MS) have been and are committed to the deployment of
electricity from renewable energy sources (RES-E). In recent years, the share of electricity generation
from renewables in the EU has quickly grown from around 14.8% in 2005 to 25.4% in 2013 (Eurostat
2015). Arguably, the targets in the RES-E Directive for 2010 and the RES Directive for 2020 as well as
MS promotion schemes for RES-E deployment have leveraged significant growth in renewables. RES-E
installed capacity and generation have increased, respectively, from 202 GW and 549 TWh in 2007 to
358 GW and 888 TWh in 2013 (IRENA 2017a, Eurostat 2015). This has been the result of substantial
increases in wind and solar PV deployment, whereas the other renewable energy sources for electricity
have slightly increased (in relative terms) over the same period. According to Eurostat (2015),
generation from wind and solar PV has increased from 104 and 4 TWh in 2007, respectively, to 235 and
81 TWh in 2013. Despite low growth rates, the increase in hydro generation has been relevant in
absolute terms (from 348 TWh in 2007 to 403 TWh in 2013). Biomass generation has increased from 52
TWh to 85 TWh over the same period.
On the other hand, the large and recent increase of RES-E penetration in the EU has raised the concern of
EU and MS policy makers about the costs of RES-E promotion. Policies to promote the diffusion of
renewables in electricity generation were introduced in many EU Member States in the 1990s. This was
mostly motivated by the need to green the electricity supply in order to mitigate GHG emissions and to
help those technologies advance along their learning curves and reduce their costs accordingly. As a result,
RES-E support schemes were adopted. These instruments usually provided a production subsidy (€/kWh)
costs of conventional electricity. These costs were usually passed to electricity consumers in their bills
and have increased considerably in the last years, particularly for wind energy and solar PV. Total wind
energy support costs increased almost three-fold between 2009 and 2013 (from 4883 M€ to 12447M€)
and solar PV increased almost four-fold (from 5855 M€ to 23128 M€)(Ortega and del Río 2016, based on
data from the Council of European Energy Regulators, CEER). The costs of RES-E support are passed to
electricity consumers in their bills and they are often regarded as a main driver of the increase of retail
electricity prices, triggering an EU-wide discussion on the need to limit those costs. First, governments in
EU MS have implemented cost-containment measures, i.e., design elements which have reduced the
overall costs of support in existing RES-E support schemes (Mir-Artigues and del Río 2014, del Río and
Mir-Artigues 2014). Second, the European Commission has stressed the need to have cost-effective and
market-based instruments, suggesting that the predominant RES-E support instrument (feed-in tariffs
(FITs)) have been too expensive and not suitable to integrate an increasing volume of RES-E in electricity
markets (European Commission 2013, 2014a, 2014b).
The concern about higher retail electricity prices which have been triggered by RES-E support costs is
related to the relevance of electricity as an input factor in the production and consumption decisions of
households and firms in all production sectors. The impact of energy regulations on retail electricity prices may result in less money being available in the pockets of households’ breadwinners for other consumption alternatives. This consumer surplus loss is obviously negative for the welfare of households.
On the other hand, the negative impact of higher retail electricity prices on the competitiveness of firms
is currently a major source of concern in the EU Member States, where the importance of a strong economy
and industry is often stressed (European Commission 2015).
Several European Commission Communications stress the need to consider the effects of the different
industries. For example, EC (2012) points out that European industry is on average facing higher retail
electricity prices than industries in other developed economies such as the US, Canada, Mexico and Korea,
and this price gap has increased over the last decade. EC (2014c) argues that a strong industrial base will
be of key importance for Europe’s competitiveness and that a main weakness hampering growth is EU firms facing higher energy prices than most of their leading competitors. EC (2010) emphasises the need
to consider the competitiveness effects of all policy initiatives including energy and environmental
policies. Those communications also suggest the need to have an ex post evaluation of the effects of
legislation/regulation on competitiveness arguing that systematic evaluations of legislation must become
an integral part of smart regulation.
Despite the relevance of the issue, research on the relative impact of the different components of the retail
electricity prices (whether regulatory or non-regulatory ones) and, particularly, on the comparative effect
of RES-E support with respect to other components, has been rather scarce (see next section for a literature
review). To the best of our knowledge, the few contributions have generally focused on a single country
and some of them are rather descriptive. Furthermore, the use of econometric models as a methodological
tool to identify the relation between the relevant variables has been virtually absent. Finally, to the best of
our knowledge, the impact of different types of RES-E support schemes on those prices has not been
analysed before. The aim of this paper is to cover this gap in the literature. An empirical analysis of the
degree of influence of RES-E support costs and different types of RES-E support instruments on the retail
price of electricity (for households as well as for industry) is provided, with a relatively wide time and
geographical coverage (22 out of 28 EU Member States over the 2007-2013 period). Our empirical
application is based on the estimation of an econometric model with panel data, in contrast to the
descriptive approaches and the approach based on electricity market models used in part of the literature.
to the existing literature. Section 3 and 4 describe the methodology and the data, respectively. Section 5
includes and discusses the results of the empirical analysis. Section 6 presents the main conclusions and
provides a discussion of the policy implications of the study.
2. Background and literature review.
The analysis of the impact of RES-E support on retail electricity prices can be placed in the context of the
regulatory analysis of the electricity sector. Among the various economic activities, electricity is
characterised for being one of the most highly regulated sectors. Indeed, the regulatory changes affecting
the electricity sector have been especially intense in the EU in the last two decades and have had an
enormous impact on the structure of the sector and its business agents, as well as on the functioning of the
electricity market itself.
Evaluating the economic impact of the regulations of the electricity sector and the changes in these
regulations is a complex task. The assessment and measurement of the impact of the reform processes and
regulatory changes have been analysed in the relevant literature with different approaches, including a
macroeconomic approach focusing on the analysis of regulatory policies and their impact within the
framework of general equilibrium theory (Chisari et al., 1999) and a quantitative evaluation of a country’s
regulatory framework. We follow the so-called performance-metrics approach in this paper, which has
been widely used in academic studies for evaluating the impact of regulatory changes based on the results
obtained in terms of pricing, investment, accessibility, service quality or the evolution in greenhouse gases
emissions, among others (Cubbin and Stern 2006; Pollitt 2009).
Several regulatory variables can be considered as key drivers of retail electricity prices, including the
promotion costs related to RES-E support, network costs, taxes and levies. Therefore, although the focus
variables.
There is an abundant literature on the analysis of the impact of higher levels of RES-E generation (usually
triggered by RES-E support schemes) on wholesale electricity prices. The literature on the so-called
merit-order effect has focused on the impact of such generation on wholesale electricity prices, leading to the
general conclusion that it results in a reduction of those prices (see Sáenz de Miera et al 2008, Gelabert et
al 2015, Wurzburg et al 2013, Senssus et al 2008, Fischer 2009, among many others). Since RES-E
generation is generally supported with an add-on on the wholesale price paid by electricity consumers in
their bills, the issue is whether the lower wholesale price is partially or totally offset by the RES-E support,
leading to an increase or reduction in the retail prices. The literature has been inconclusive in this regard,
with some contributions showing an increase in retail prices (EIA 2003, Traber and Kemfert 2009,
Costa-Campi and Trujillo-Baute 2015) and others a reduction (Tellus Institute 2002, UCS 2004, Sáenz de Miera
et al 2008, Rathmann 2007). Assumptions about the slopes of the supply of renewable and non-renewable
energy play a crucial role in explaining the different results across studies (Fischer 2009).
However, this paper adopts a different approach. The analysis focuses on the relative influence of RES-E
support on retail prices with respect to other components of those prices. Therefore, the literature reviewed
has focused on the impact of the costs of RES-E promotion, taxes, levies and network costs on retail
electricity prices. The review leads to the general conclusion that the comparative influence of the different
components of the retail price and, in particular, RES-E support, has received scant attention in the
literature. Some of the contributions are based on descriptive statistics (DECC 2013, IPART 2012, Morey
and Kirsch 2014, Flaberty et al 2014, Bloomenergy 2010, Cludius et al 2014). Others use electricity market
models (Simhauser and Nelson 2013, Deane 2014, Traber and Kemfert 2009) or a general model of energy
supply and demand (Fischer 2009). Very few use econometric models. Moreno et al (2012) develops
RES in the EU (1998-2009). The results suggest that retail electricity prices increase with the deployment
of RES (wind). London Economics (2012) assesses the trends and position of the UK electricity retail
market relative to comparable jurisdictions in terms of prices, competition and profitability in the period
1984-2010. The econometric analysis suggests that commodity input prices, fuel mix (electricity) and
wages explain a large amount of the variation in retail prices for both residential and industrial customers
across jurisdictions and over time. However, neither of these studies analyse the relative importance of
RES-E support with respect to other cost components of retail prices.
This paper contributes to the existing literature on several fronts. Our analysis considers several relevant
regulatory and non-regulatory drivers of retail electricity prices. The time and geographical coverage is
relatively wide (22 of the 28 EU Member States over the 2007-2013 period). The empirical application is
based on the estimation of an econometric model with panel data, in contrast to the descriptive approaches
and the approach based on electricity market models which have prevailed in the literature. Finally, the
impact of different types of RES-E support schemes on those prices is analysed.
The focus on RES-E support in the EU in this paper is justified given the relevance attached in policy and
academic circles to this component as a main driver of retail prices (see, e.g., CEER 2011, 2013, 2015,
European Commission 2013, 2014a, 2014b, 2015, Frondel et al 2010).
RES-E support has been provided with several primary instruments in the EU (see del Río and
Mir-Artigues 2014, Held et al 2014). They can be broadly classified into price-based and quantity-based
instruments. In price-based instruments, the government sets the support and RES-E generators and
investors responding accordingly and, thus, the capacity that will be installed is a priori uncertain. Under
quantity-based schemes, the government sets the quantity target and it is the “market” which sets the
Price-based support schemes:
• Feed-in tariffs (FITs) provide total preferential and guaranteed (fixed) payments per kWh of electricity of renewable origin, combined with a purchase obligation by the utilities.
• Feed-in premiums (FIPs) provide a guaranteed payment per kWh on top of the electricity wholesale-market price. This is also combined with a purchase obligation by the utilities.
Quantity-based support schemes:
• Quotas with tradable green certificates (TGCs). TGCs are certificates that can be sold in the market, allowing RES-E generators to obtain revenue. This is additional to the revenue
from their sales of electricity fed into the grid. The issuing (supply) of TGCs takes place
for every MWh of RES-E, while demand generally originates from an obligation (quota)
on electricity distributors. The TGC price covers the gap between the marginal cost of
renewable electricity generation at the quota level and the wholesale price of electricity.
• Auctions have recently received worldwide attention. According to IRENA (2017b), auctions are now implemented in 67 countries worldwide (up from 6 countries in 2005). In
procurement auctions, developers compete for supply contracts to build a predetermined
volume of RES-E capacity. The government invites RES-E generators to compete for either a certain
financial budget or a certain RES-E generation capacity. The cheapest bids per kWh are awarded contracts and receive the subsidy. Auctions are used to allocate financial support to different renewable energy
technologies and they have increasingly been used in the EU to set the remuneration level
Those primary instruments have been complemented with other “secondary instruments”, which include tax exemptions (TE), investment incentives (II), financial incentives (FI) and net metering (NM). They
are usually limited in scope and circumscribed to specific types of projects (e.g., small ones) and
technologies (e.g., solar PV).
Regarding the primary instruments, RES support in the EU has mostly been based on FITs (table 1). It
should be mentioned that those support schemes have experienced small changes in the first part of the
period (2007-2010), mostly related to adaptations in existing schemes, e.g., modifications of design
elements (see Held et al 2014). However, significant changes can be observed in more recent times (i.e.,
since 2011), mostly away from FITs and towards FIPs and auctioning schemes (AURES project 2016).
This is probably related to the concern of MS governments on the low “market compatibility” and the
relatively high total support costs of FITs and the fact that after the EU Commission Guidelines on Energy
and Environmental Protection Aid 2014-2020, as auctions for RES will be implemented in the EU from
2017 onwards.
Table 1
The effectiveness and efficiency of support schemes has been the focus of much research (see Mitchell et
al 2011, Held et al 2014 for reviews). Furthermore, their effects on the wholesale electricity price (the
so-called merit order effect) have extensively been analysed (see e.g. Sáenz de Miera et al 2008, Cludius et
al 2014). However, the impact of those schemes on the retail electricity prices has not received a
comparable attention.
3. Methodology
This section discusses the econometric method which is used to assess the impact of RES-E regulation on
affected by several regulations, not only by the expenditures on RES-E promotion (or renewable
promotion costs, RPCs), and by other factors. All these variables are included as control variables since
they are all expected to influence the evolution of retail prices.
Regarding the regulatory variables, network costs and taxes and levies are included in our model. Network
costs are defined as the ratio between the revenue related to transmission and distribution tariffs and the
corresponding volume per consumption band. If complementary services like transmission and
distribution losses, after-sale services, system service costs and meter rental are identified separately, then
they are allocated to the network costs as an aggregated measure1. Finally, taxes and levies are an
additional, well-known component of electricity retail prices. They include the value added tax, excise
taxes, nuclear decommissioning, support for vulnerable consumers, energy efficiency support, island
system compensation, tariff deficit annuities, stranded costs and compensation fees, research funding,
security of supply surcharges, concession fees, offshore grid connection surcharges, coal
decommissioning and pension funds, among others (Eurelectric 2014). These variables are expected to
positively affect retail prices.
In addition, the following non-regulatory variables are included in the specification and estimation of the
model:
- Energy-only costs. A main component of final electricity prices, in addition to regulated costs, is the cost
of electricity as such, i.e., the wholesale price of electricity in the intraday market plus adjustments. This
variable, as calculated by Eurostat, also includes the retail margin. We can expect that, the higher the
energy-only costs, the higher the retail prices of electricity will be.
- Electricity consumption. The evolution of wholesale and retail electricity prices depends on the
1 This allocation of complementary services is performed by Eurostat, which does not provide disaggregated data on those
interaction between supply and demand in each country. Given that, in the context of this research, the
quantity captures the size of the market, the sign of the estimated coefficient should be negative (scale
effect).
-Lagged electricity prices. This has been included as an additional variable in the model in order to capture
and control for the dynamic component of the behaviour of prices.
Equation 1 represents the reduced-form of the retail price econometric model, which will be estimated for
both household and industrial consumers:
𝑙𝑜𝑔𝑃𝐸𝑖𝑡 = 𝛼0 + 𝛼1𝑙𝑜𝑔𝑃𝐸𝑖𝑡−1+ 𝛼2𝑙𝑜𝑔𝑅𝑃𝐶𝑖𝑡+ 𝛼3𝑙𝑜𝑔𝑁𝐶𝑖𝑡+ 𝛼4𝑙𝑜𝑔𝐸𝐶𝑖𝑡 (2)
+𝛼5𝑙𝑜𝑔𝑇𝐿𝑖𝑡+ 𝛼6𝑙𝑜𝑔𝐸𝑐𝑜𝑛𝑠𝑖𝑡+ 𝛼7𝑇𝑡+ 𝜀1𝑖𝑡
Where the different variables refer to:
𝑃𝐸𝑖𝑡: Retail price of electricity (dependent variable) 𝑃𝐸𝑖𝑡−1: lagged dependent variable
𝑅𝑃𝐶𝑖𝑡: renewable energy promotion costs
𝑁𝐶𝑖𝑡: network costs 𝐸𝐶𝑖𝑡: energy-only costs, 𝑇𝐿𝑖𝑡: taxes and levies,
𝐸𝑐𝑜𝑛𝑠𝑖𝑡: electricity consumption
𝑇𝑡: linear trend
𝜀1𝑖𝑡: Random error
The sub-indices i and t refer to countries and years, respectively.
nature and power demand profile. Special attention is given to retail prices for households and industrial
electricity consumers (DC and IC bands according to Eurostat classification, respectively), which are the
most representative consumer bands.2 Thus, the above equation is estimated for household and industrial electricity consumers in order to grasp the possible differential relevance of the determinants on those two
types of consumers.
The methodological choice of this reduced-form approach is deemed suitable, given the nature of the study
and the availability of relevant data. The ideal empirical approach to the research question we are facing
would imply the definition of a pass-through function. This would be derived from the demand function,
which describes the optimal price for alternative (exogenous) levels of marginal costs. The pass-through
rate, i.e., the extent to which costs are passed to retail prices would then be the first derivative of the
pass-through function with respect to the relevant cost. Although the underling mechanism pass-through which the
RPCs impact the retail prices is the through, it would be extremely difficult to calculatethe
pass-through function for 22 different countries, as in our case (even without the strong data limitations faced
when analysing several countries). The reduced-form approach we use is an alternative option to overcome
such limitations, which implies however, that we are assuming linear demand and constant marginal costs,
i.e., the pass-through rate is a constant. This approach allows us to better understand how is the relative
impact of the different components of the retail electricity prices (whether regulatory or non-regulatory
ones) and, particularly, to identify the comparative effect of different types of RES-E support schemes
with respect to other components, with a relatively wide time and geographical coverage.
The estimation method has taken into account two features of our model and data: we have a dynamic
2 Consumption Band IC = medium size industrial consumers with annual consumption between 500 and 2000 MWh;
panel (22 countries over the period 2007-2013) with heteroskedasticity3. The Ordinary Least Square
(OLS) method would lead to biased coefficients due to the underlying endogeneity of the lagged
dependent variable. Instrumental variable (IV) methods are able to produce consistent estimators for
dynamic data models. These estimators are based on the idea that lagged (or lagged differences of)
regressors are correlated with the included regressor but are uncorrelated with the error terms. Thus, valid
instruments are available from inside the model and these can be used to estimate the parameters of interest
using instrumental variable methods. Based on the same principle of IV, the GMM Arellano-Bond method
for dynamic panel data it is able to generate consistent estimators. However, GMM estimators are more
efficient than IV estimators in the presence of heteroskedasticity (as in our model), and have superior
small-sample properties which are quite convenient in our case. Therefore, we have used the two-step
difference GMM method with robust errors, in which the instruments are the first differences of the
exogenous variables and the lags of the endogenous variable4. By using a two-step procedure, the estimates are consistent in the presence of any pattern of heteroskedasticity and serial correlation within
the panel, and the robust errors correct for the typical downward bias standard errors give rise to when
using the two-steps.
4. Data
The price data from Eurostat used in this work cover the years between 2007 and 2013, the first and the
last full years with complete retail price data for all Member States. The new Eurostat methodology
3 The nature of our sample (based on the observation of different countries) and the dynamics of prices ground concerns on
variance dispersion. The presence of heteroskedasticity was analyzed with the Breusch-Pagan/Cook-Weisberg test, from which the null hypothesis of homoscedastic disturbances was rejected. Given the approach followed, the residuals of the differenced equation would be serially correlated, Table 5 shows the AR test of serial correlation of the residuals.
4 Estimations were performed using all the dependent variable lags available in the sample (from 2 to 6) as instruments, leading
to similar results. This, along with the lower degrees of freedom in estimations with a higher number of lags, motivated the selection of two lags in our analysis.
provides comparable data for all EU States and is published every six months (on a yearly basis by
components). Separate component price data for energy, network and taxes are not available before 2007.
Although final price data are available since 1990, the main advantage of this new methodology is that
the real average prices that customers pay for their consumption are provided and a comparison of prices
at national level and across the price components can be undertaken. This is due to the fact that the new
methodology provides disaggregated data for the energy-only costs, network costs and taxes and levies.
Unlike the other variables used in this analysis, the information on RES-E support costs is not directly
available in a standardized public or private database. In order to overcome this data limitation, we have
built the Renewable Promotion Cost (RPC) variable based on the information provided by the Council of
European Energy Regulators (CEER 2011, 2013, 2015). First, the total expenditures on RES-E promotion
were calculated as the product of the RES-E weighted average support level by technology (from CEER
reports) multiplied by the overall RES-E production for that technology. Then, the promotion costs for all
the technologies were added and the RPC were calculated as the ratio between the total expenditure on
RES-E promotion and the total electricity consumption. Therefore, the resulting variable is measured in €/MWh5. This variable allows capturing the level of RPCs, taking into account the size of the electricity
system (in terms of MWh of electricity generation). This facilitates cross-country comparisons. The
renewable promotion costs observed in our sample range from 0.49 to 55.2 €/MWh, with an average of
14.35 €/MWh. Table 2 summarises the variables selected for this study, the data sources that have been used and the sign that can be expected for these variables in the econometric estimation.
Table 2
5 Although alternatives approaches could have been used to proxy the renewables support costs (e.g. with the total expenditure
on RES-E promotion), the indicator used in this empirical analysis is deemed superior because it captures not only the country’s efforts but also the burden of RES support across countries. The weights used consider differences among technologies, both regarding the amount of resources devoted as well as their degree of penetration. Alternative measures ignoring either one or both factors would lead to a variable with a limited potential to perform cross-country analyses.
The empirical analysis is performed with data for 22 countries, as data on RPCs are not available for six
EU countries (Bulgaria, Cyprus, Ireland, Latvia, Malta and Slovakia). Table 3 provides the summary of
the descriptive statistics for the variables used in this study.
Table 3
The evolution of the dependent variable (retail electricity prices) and the promotion costs (in €/MWh) are
shown in Figure 1. Retail electricity prices for households have been well above those for industry, and
diverged during the period. This figure helps us to understand the evolution of the dependent variable, which
is useful for econometric purposes. A lineal trend is identified for both the residential and industrial prices and,
thus, this trend is included in our model as an additional regressor (Tt) to capture this effect. Besides, the figure
shows that the retail prices are orders of magnitude higher the RPCs. The RPC variable shows a slightly
increasing trend in the period (with the sample average rising from 11.16 to 19.85 €/MWh between 2007 and
2013), which becomes more pronounced by the end of the period (i.e., since 2010). This is probably related to
the total increase in support costs in some countries (i.e., Germany and Italy). In addition to the average
increasing trend, the RPC variable also showsan increasing dispersion (with high standard deviation, which
increase from 8.6 to 13.7 in the sample period. The RPC variable is heterogeneous regarding both sample
dimensions (countries and years).
Figure 1
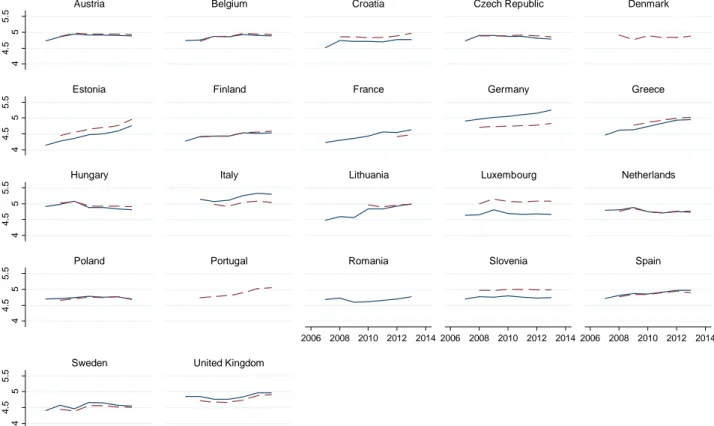
Figure 2 compares the level and the evolution of RPCs by country (€/MWh) over the sample period.
Concerning the level of those costs, some countries show high average RPCs in the whole period
(Austria, Croatia, Germany, Italy, Portugal, Slovenia and Spain). In contrast, these costs have been very
low in Estonia, Finland, Hungary Lithuania, Luxembourg, the Netherlands, Portugal and the U.K. The
rest of countries considered in this study are in the middle. Regarding the evolution of the RPCs, it can
(Czech Republic, Germany, Greece, Italy, Portugal and Spain). However, most countries show a slightly
increasing trend (Belgium, Croatia, Denmark, Finland, Lithuania, Luxembourg, the Netherlands, Poland,
Romania and U.K.). Others show similar RPCs at the beginning and end of the period, sometimes with
ups and downs in the middle (Austria, Estonia, France, Hungary, Sweden and Slovenia).
Figure 2
The correlation matrix (Table 4) suggests that there is not a high correlation between the explanatory variables.
The variance inflation factors in OLS (without fixed effects) have been calculated and the results confirm that
a problem of extreme correlation between the explanatory variables does not exist.
Table 4
Finally, in order to improve our knowledge on the dependent variable, we plotted both domestic and
industrial retail prices in a time-series graph for each of the countries (see Figures A1 and A2 in the
Appendix). A potential lineal trend on both prices can be identified for most countries. Therefore, a
lineal trend has been included in our model as an additional regressor (Tt) to capture this effect. In
addition, both figures show that the fitted values from the model reproduce quite well the real data, and
particularly the trends of retail prices over the period in the different countries.
5. Results and discussions.
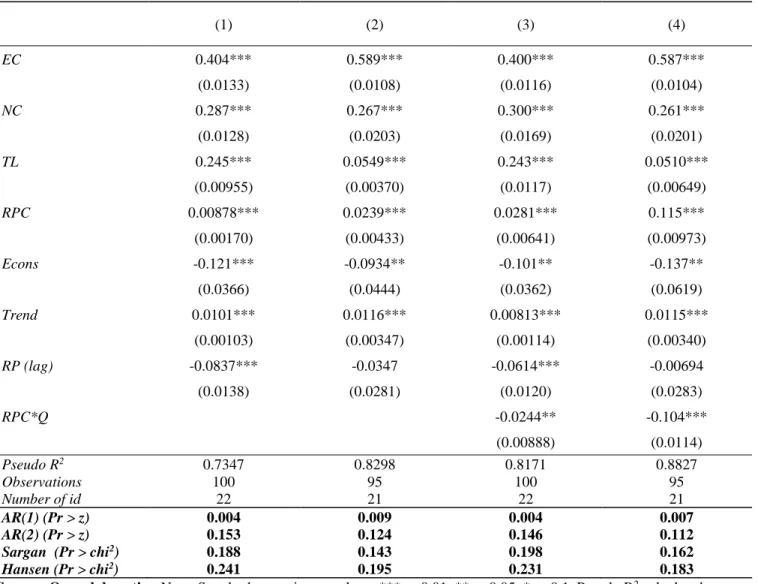
Table 5 provides the results of the panel GMM estimations for equation 1. The results for the average
effects of the regulatory and control variables for the household- column (1) - and industrial - column (2)
- retail prices are statistically significant and in line with expectations.
Our attention will be focused on the results of the influence of RPCs on the retail electricity prices. Since
panel data are used, there is causality going from RPCs and the rest of explanatory variables to retail
Table 5
First, on average, the influence of the RPCs on the retail electricity prices faced by both industrial and
residential consumers is positive and relatively small. The influence found is related to the increase in the
support costs over time. This is mostly related to the two most relevant technologies in this context (wind
on-shore and solar PV). An increase of 1% in RPCs induces an increase of 0.023% in the industrial retail
prices and of 0.008% in the residential retail prices. One possible explanation for this difference is that
retail electricity prices are significantly higher for households (161€/MWh on average) than for industry
(128€/MWh on average). Indeed, the weight of the RPCs in the retail electricity prices is lower for
households (9%) than for industry (11%). The influence of 1€/MWh of increase in RPCs would then be
lower in the case of households, i.e. a given increase in the RPCs would induce a lower (relative) increase
in retail prices for households compared to industrial consumers.
Regarding the absolute influence of RPCs on the retail prices, our results show that this is non-negligible,
although small compared to other regulations and energy-only costs (table 6)6. One €/MWh of increase in
promotion costs induces an increase of 0.213 €/MWh (short-term) in the retail price for industrial
consumers. This increase is much lower for household electricity prices (0.10€/MWh), which. is in line
with the statement above about the different weight of RPCs in the industrial and residential prices.
Table 6
The estimated coefficients for the control variables are statistically significant, have the expected sign,
and their magnitudes seem reasonable. Compared to RPCs, network costs have a greater relative impact
on retail prices, probably because network costs represent a much higher share of the electricity bill than
6 It is possible to compute the change of the retail price in terms of €/MWh from an increase of 1 €/MWh in the RPCs using
RPCs (on average, the weight of the network costs in the retail electricity prices is 27% and the weight of
the RPCs is 10%)7. However, in contrast to the case of the RPCs, the elasticities are higher for households (0.29%) than for industry (0.26%), which could be related to industries being charged less for those
network costs than households, as suggested by Grave et al (2015). Industrial consumers may face lower
network costs than residential consumers for several reasons. First, industrial sectors often use connections
with higher voltage (i.e., with lower charges). Second, the weight of those costs in the retail electricity
prices is higher for households (32%) than for industrial consumers (23%). Third, according to Ramsey's
principle of optimal taxation, the optimal tax rate on an activity should be inversely proportional to the
price-elasticity of that activity. In order to reduce the influence on the regulated revenues, energy suppliers
possibly charge relatively more network costs (NCs) to domestic than to industrial consumers, i.e. costs
are charged proportionally more to the more price-inelastic consumers. There might also be
country-specific reasons underlying this result. The influence of taxes and levies is also considerable (see table 5)
and larger than the RPCs.
Electricity consumption negatively affects prices. As mentioned in section 3, this variable captures the
size of the market and, thus, the negative sign suggest the existence of a scale effect, i.e., the greater the
amount being consumed in the economy, the lower the price. Finally, the influence of energy-only costs
on the retail prices is positive. Obviously, a higher price of fossil fuels or, in general, a higher price for
the technology which sets the price in the wholesale electricity market would lead to higher wholesale
prices and, thus, higher retail prices. However, this is partially offset by the so-called merit-order effect,
which is more relevant with high RES-E penetrations.
7 A priori, it could be expected that both components of the electricity bill were interrelated, since a greater RES penetration
would involve considerable grid reinforcements and extensions. However, the correlation between the variables capturing these components is very low.
An interesting result is that, if the magnitude of the respective elasticities is considered, the influence of
changes in energy-only costs clearly outweighs the impact of changes in taxes and electricity consumption.
This can be explained by the key role played by those energy-only costs in the retail prices, which is
related to their substantial share as a component of those prices. The elasticities for the energy-only costs
are higher for industrial consumers than for households, which could be related to the fact that such a
share is higher for the former consumers than for the later. In contrast, the influence of taxes is higher for
households than for industrial consumers, since households pay proportionally more taxes than industrial
consumers.
In this context, the impact of RPCs on electricity retail prices is likely to be mediated by the type of
instrument being implemented and, within the instruments, by the choice of design elements. Indeed, the
literature has consistently shown that the success of RES-E promotion critically depends on the choice of
instruments and design elements.
A particularly relevant distinction is between price-based (FITs and FIPs) and quantity-based support
instruments (quotas with TGC schemes and auctions). The latter have been applied in six EU countries
during the whole period considered in this article (Belgium, Italy, Sweden, Poland, Romania and the U.K.)
although, in two cases, combined with FITs in the last years of the period for some technologies8. In the other 16 countries, price-based support schemes have been applied, either in isolation or combined with
secondary instruments. This distinction is relevant in so far as both types of instruments seem to have had
quite a different impact on the effectiveness and efficiency of RES support schemes (Held et al 2014,
Ragwitz et al 2007, IEA 2011). The literature shows that, at least for wind on-shore and solar PV, FITs
have generally been more effective than quotas with TGCs9. The level of support being provided with
FITs has usually been closer to the generation costs of the respective technologies, whereas excessive
unitary remuneration (€/MWh) has often been the case under TGCs. However, the great solar PV
deployment under FITs has led to very large total support costs (unitary support times the amount of
RES-E being generated) in several countries (e.g., Spain and Germany). The lack of implementation of
cost-containment mechanisms under FITs (such as budget generation or capacity caps) in the past has
contributed to this result.
Therefore, in order to test the influence of support instruments on the relationship between support costs
and retail prices, another set of regressions on both industrial and household retail prices was performed
including, in addition, an interaction term (RPC*Q) between the RPC variable and a dummy variable (Q),
which takes the value 1 for those countries with a quantity-based scheme in the whole period being
considered (2007-2013) and 0 otherwise (i.e., the base level implicitly corresponds to countries with
price-based schemes)1011. The results in Table 5 –columns (3) and (4) for households and industrial consumers,
respectively- show that the impact on retail prices has been greater in countries with price-based schemes
than in countries with quantity-based schemes. The reason for this novel result is probably related to the
higher total (although not necessarily unitary) costs of RES-E promotion under FITs and other price-based
promotion mechanisms.
9 However, the evidence at the world level is not so conclusive. While Dong (2012) finds that FITs are more effective than
quotas, Carley et al (2016) find that the opposite is true. FITs are found to be an effective way to increase RES-E specifically for the case of the USA in Smith and Urpelainen (2014).
10 In order to identify the instruments implemented between 2007 and 2013 in the 22 Member States, we have used several
sources: CEER (2008, 2011, 2013, 2015), Held et al (2014), del Río and Mir-Artigues (2014) and Mir-Artigues and del Río (2016).
11 Q is a dummy variable which captures the effects form two different types of instruments characterizing the RPCs. This
dummy variable does not have a direct effect by itself. All the effect from different instruments are captured, first, by the sum of the RPC*Q interaction and the RPC when Q is 1, and second, by the RPC when Q is 0. Therefore, Q is not included in the estimations without the interaction (this would be necessary in the case the variable as a meaning on its own, capturing its direct effect when RPC is equal to 0).
To sum up, although RPCs have a non-negligible impact on retail prices, this impact is relatively small
when compared to other factors and is mediated by the type of instrument being chosen.
6. Conclusions and policy implications.
Final consumers’ prices have substantially increased in the EU. From 2007 to 2013, thy increased by 34% for domestic customers and by 29% for industrial customers. Despite efficiency gains and the progressive
opening of energy markets to competition, that have reduced wholesale electricity prices, retail prices
have increased, and the price increase during this period has been strongly influenced by the regulated
component. This has triggered the concern of policy-makers around Europe. RPCs have been singled out
as a main driver of such increase. This paper aims to analyse the impact of RPCs on the evolution of retail
prices in the EU.
Our results show that renewable energy promotion costs have a non-negligible, positive and statistically
significant impact on the retail prices faced by both industrial and residential consumers. However, such
impact is relatively small when compared to other variables. Differences between the two types of
consumers exist. An increase of 1% in RPCs induces an increase of 0.023% in the industrial retail prices
and of 0.008% in the residential retail price. Furthermore, differences between instruments exist, with
price-based RES support schemes having a greater impact on retail prices than quantity-based ones, which
is related to the absence of cost-containment mechanisms in the former (i.e., budget, generation or capacity
caps), despite the generally higher unitary support costs for quantity-based schemes.
These results have clear public policy implications. First, they suggest that the focus on RPCs as a main
should take into account those other drivers. The fact that the impact is small in the period considered in
this paper does not imply that the increase in RPCs and their impact on retail electricity prices should not
be a concern for policy-makers. In fact, although this impact has been small in the period considered, it is
likely to be much higher with growing RES shares. Measures should be adopted in order to limit the
increase in retail prices which negatively affects household consumers (aggravating the energy poverty
problem) and the competitiveness of industries.
Second, our results suggest that, if the aim is to contain the total support costs, quantity-based instruments
are preferable to price-based ones. However, an overwhelming majority of support schemes in the period
under analysis (2007-2013) have been price-based ones, as shown in Table 1. This was mostly in the form
of FITs, which guarantee a fixed price per kWh of electricity. FIPs, in which the RES-E support is paid
on top of the wholesale market price of electricity, have increasingly been applied in the period. This is
probably related to the higher degree of compatibility of FIPs with electricity markets (compared to FITs)
by promoting the active participation of renewable electricity generation in wholesale markets, providing
exposure for example to price signals. FIPs have also the potential to reward performance, as the income
of producers is linked to the wholesale market price. As a result, these market responsiveness measures
will in the medium term improve the market integration of RES-e producers (del Río et al 2017). However,
the higher risks for investors in FIPs compared to FITs (due to, both, higher revenue and balancing risk) would lead to higher costs of capital, which would result in higher generation costs Rathmann et al (2011). In contrast to price-based schemes,
TGC schemes and auctions had only been applied in a few countries. TGC schemes were implemented as
the main support instrument in Belgium, Italy, Sweden, U.K., Poland and Romania. Auctions have not
been used in any country in the period as the main RES-E instrument. They have only been used
occasionally in some years, in a few countries and for only a few technologies, including wind on-shore
also been used to promote the larger projects (Italy and Lithuania). However, as a result of the 2014 EU
State Aid Guidelines on Environmental Protection and Energy 2014-2020 requiring Member State to
auction the support provided to RES-E from 2017 onwards, there has been a convergence of support
schemes towards auctions in the last couple of years and, currently, this is the main instrument used in the
EU. The new trend to the implementation of auctions mitigates the concern on the need to contain
RES-E support costs, due to their in-built cost-containment feature. It remain to be seen, however, whether
quantity-based instruments can be as effective in triggering RES-E deployment as price-based ones have
been in the past. Although quantity-based support schemes have an in-built mechanism to contain those
costs, they may bring other problems. For example, quotas with TGCs have led to high remuneration
levels for the most mature technologies and best sites, relatively high revenue risks negatively affecting
capital costs and ineffectiveness in promoting still maturing technologies, see Mir-Artigues and del Río
2016, Noothout et al 2016). The effectiveness of auctions is still to be proven (del Río and Linares 2014,
Wigan et al 2016).
Third, our findings suggest that the choice of design elements and particularly cost-containment
instruments are a must in order to limit RPCs in price-based schemes. There are several alternatives to
limit the costs, including budget, generation or capacity caps, traditional degression and growth corridors.
These cost-containment measures have recently been adopted (del Río and Mir-Artigues 2014). Avoiding
the sky-rocketing of those costs is required for the social acceptability and, thus, political feasibility of
RES-E support schemes in the future.
Fourth, the fact that the burden falls to a greater extent on the industrial sectors suggests that limiting the
should not be passed completely to the retail electricity prices paid by industrial firms. However, this is a
difficult decision with negative implications for other actors12
Several limitations of the study suggest fruitful avenues for future research:
First, the temporal and geographical scope of the analysis could be widened to non-EU countries and a
more recent period. Broadening the period of the analysis could show whether the aforementioned
cost-containment measures, recently implemented EU-wide, have had a mitigating impact of RPCs on retail
electricity prices and the degree of such effects. Data are not yet available to perform such analysis,
however.
Second, the analysis in this paper has not distinguished between different types of technologies. The
impact of the deployment of different renewable energy technologies (solar PV, wind, biomass and hydro)
on the RPCs should be further analysed.
Third, the interrelation between RPCs and other drivers should also be considered. This paper has
implicitly assumed that they are separated from each other. Indeed, from the statistical point of view, at a
country aggregated level, the data do not reflect this interaction. However, they may increasingly be
related to a growing RES penetration. For example, RPCs and NCs may be increasingly interrelated with
a growing penetration of RES, since much higher RES deployment rates entail considerable grid
reinforcements and extensions13. Further research could be devoted to the analysis of these interrelationships.
12 Obviously, someone would have to pay for those added costs. Two alternatives exist in this regard: households or the public
budget. Adding this to the retail electricity price paid by households would be particularly detrimental for the most vulnerable consumers. Of course, the public deficit would be increased in the other option.
13Indeed, the market integration of an increasing amount of RES is becoming a growing source of concern for policy-makers,
Finally, this paper has analysed the aggregated influence of two broad categories of RES-E support
instruments (price-based vs. quantity-based) on the retail prices. Further research could be dedicated to
the analysis of the impact on retail electricity prices of a more disaggregated set of instruments as well as
different design elements for those instruments.
References
AURES project 2016. Instruments and lessons learned from around the world. http://auresproject.eu/
Bloomenergy 2010. Understanding California’s Electricity Prices.
Carley S., Baldwin, E., McLean, L., Brass, J. 2016. Global Expansion of Renewable Energy Generation.
An Analysis of Policy Instruments. Environmental and Resource Economics.
doi:10.1007/s10640-016-0025-3
CEER 2011. Report on Renewable Energy Support in Europe. Consejo Europeo de Reguladores
Energéticos. Ref: C10-SDE-19-04a. Brussels.
http://www.ceer.eu/portal/page/portal/EER_HOME/EER_PUBLICATIONS/CEER_PAPERS/Electricity
CEER 2013. Status Review of Renewable and Energy Efficiency Support Schemes in Europe. Ref:
C12-SDE-33-03. Brussels.
http://www.ceer.eu/portal/page/portal/EER_HOME/EER_PUBLICATIONS/CEER_PAPERS/Electricity
CEER 2015. Status Review of Renewable and Energy Efficiency Support Schemes in Europe in 2012
and 2013. Ref: C14-SDE-44-03. Brussels
http://www.ceer.eu/portal/page/portal/EER_HOME/EER_PUBLICATIONS/CEER_PAPERS/Electricity
Cludius, J., Forrest, S., MacGill, I. 2014 Distributional effects of the Australian Renewable Energy
Chisari, O., Estache, A., Romero, C. 1999. Winners and losers from the privatization and regulation of
utilities: Lessons from a general equilibrium model of Argentina. The World Bank Economic Review.
Cubbin, J., Stern, J. 2006. The Impact of Regulatory Governance and Privatization on Electricity
Industry Generation Capacity in Developing Economies. World Bank Economic Review 20(1), 115-141.
Costa-Campi, M.T., Trujillo-Baute, E. 2015. Retail Price Effects of Feed-in Tariff Regulation. Energy
Economics 51, 157-165
Deane, P., Fitzgerald, J., Malaguzzi, L., Tuohy, A., Walsh, D. 2014. Irish and British electricity prices:
what recent history implies for future prices. Economics of Energy & Environmental Policy 3(2),
122-133
DECC 2013. Estimated impacts of energy and climate change policies on energy prices and bills 2012.
Del Río, P., Linares, P. 2014. Back to the future? Rethinking auctions for renewable electricity support.
Renewable and Sustainable Energy Reviews 35, 42-56.
Del Río, P., Mir-Artigues, P. 2014. Combinations of support instruments for renewable electricity in
Europe: A review. Renewable and Sustainable Energy Reviews 40, 287-295.
Del Río, P., Fitch-Roy, O., Woodman, B. 2017. Identification of alternative options. Report 6.1 of the
EU-funded AURES project.http://www.auresproject.eu/
Dong, C. 2012. Feed-in tariff vs. renewable portfolio standard: an empirical test of their relative
effectiveness in promoting wind capacity development. Energy Policy 42, 476–485
EIA 2003. Analysis of a 10-Percent Renewable Portfolio Standard. SR/OIAF/2003-01. EIA.
Washington.
Eurelectric 2014. Analysis of European power price increase. Eurelectric studies.
EC 2010. Communication from the Commission to the European Parliament, the Council, the European
the Globalisation Era. Putting Competitiveness and Sustainability at Centre Stage (COM (2010) 614
final),
European Commission (EC) 2012. Communication from the Commission to the European Parliament,
the Council, the European Economic and Social Committee and the Committee of the regions. A
Stronger European Industry for Growth and Economic Recovery (COM (2012) 582 final),
EC 2013. Green Paper COM(2013) 169 final:
http://ec.europa.eu/energy/en/consultations/consultation-climate-and-energy-policies-until-2030
EC 2014a. Communication from the Commission to the European Parliament, the Council, the European
Economic and Social Committee and the Committee of the regions. A policy framework for climate and
energy in the period from 2020 to 2030. COM/2014/015 final.
EC 2014b. Guidelines on State aid for environmental protection and energy 2014-2020, COM (2014)
2322, 2014.
EC 2014c. Communication from the Commission to the European Parliament, the Council, the European
Economic and Social Committee and the Committee of the regions. For a European Industrial
Renaissance (COM (2014) 14 final)
EC 2015. Energy Union Package. A Framework Strategy for a Resilient Energy Union with a
Forward-Looking Climate Change Policy. Brussels, 25.2.2015 COM(2015) 80 final
European Council 2009. Council adopts climate-energy legislative package. Brussels, 6 April 2009
8434/09 (Presse 77).
European Council 2014. European Council (23 and 24 October 2014) Conclusions on 2030 Climate and
Energy Policy Framework. Brussels, 23 October 2014 (OR. en) SN 79/14. COM/2016/0860 final.
Eurostat 2015. Renewable energy statistics. 2015.
Flaherty, M., Riordan, N., O’Neilla, N., Aherna, C. 2014. A quantitative analysis of the impact of wind
energy penetration on electricity prices in Ireland. Energy Procedia 58, 103 – 110
Fischer, C. 2009. Renewable Portfolio Standards: When Do They Lower Energy Prices? The Energy
Journal 31(1), 81-99
Frondel, M., Ritter, N., Schmidt, C.M., Vance, C. 2010. Economic impacts from the promotion of
renewable energy technologies: The German experience. Energy Policy 38 (8), 4048-56.
Gelabert, L., Labandeira, X., Linares, P. 2011. An ex-post analysis of the effect or renewables and
cogeneration on Spanish electricity prices. Energy Economics 33, 559-565.
Graves, K., et al 2015. Electricity Costs of Energy Intensive Industries. An International Comparison.
Fraunhofer-ISI and Ecofys for the German Ministry of Economic Affairs and Energy.
Held, A., Ragwitz, M., Boie, I., Wigand, F., Janeiro, L., Klessmann, C., Nabe, C., Hussy, C., Neuhoff,
K., Grau, T., Schwenen, S. 2014. Assessing the performance of renewable energy support policies with
quantitative indicators – Update 2014. Final Report of the EU-funded DIA-CORE project.
http://diacore.eu/images/files2/MyFolder/D2.1_Assessing_the_performance_of_renewable_energy_supp
ort_policies_with_quantitative_indicators__Update_2014.pdf
International Energy Agency 2011. Deploying renewables. Paris.
IPART 2012. Independent Pricing and Regulatory Tribunal of New South Wales 2012. Changes in
regulated electricity retail prices from 1 July 2012.
IRENA 2017. Renewable capacity statistics 2017. Abu Dhabi
IRENA 2017b. Renewable energy auction. Analysing 2016. Abu Dhabi
London Economics 2012. Energy Retail Markets Comparability Study. Prepared for DECC.
Mir-Artigues, P., del Río, P. 2014. Combining tariffs, investment subsidies and soft loans in a renewable
Mir-Artigues, P., del Río, P. 2016. The Economics and Policy of solar PV generation. Springer.
Mitchell, C., Sawin, J.L., Pokharel, G.R., Kammen, D., Wang, Z., Fifita, S. et al (2011). Policy,
Financing and Implementation. IPCC Special Report on Renewable Energy Sources and Climate
Change Mitigation. In: Edenhofer O., Pichs-Madruga R., Sokona Y., Farahani E., Kadner S., Seyboth K.
et al. (eds.). Cambridge, Cambridge University Press.
Moreno, B., López, A., García-Alvarez, M.T. 2012. The electricity prices in the European Union. The
role of renewable energies and regulatory electric market reforms. Energy 48(1), 307-313.
Morey, M., Kirsch, L. 2014. Germany’s Renewable Energy Experiment: A Made-to-Order Catastrophe.
The Electricity Journal 27(5), 6-20.
Noothout, P., de Jager, D., Tesnière, L., van Rooijen, S., Karypidis, N., Brückmann, R., Jirouš, F.,
Breitschopf, B., Angelopoulos, D., Doukas, H., Konstantinavičiūtė, I., Resch, G. 2016. The impact of
risks in renewable energy investments and the role of smart policies. Final Report of the DIA-CORE.
Contract N°: IEE/12/833/SI2.645735.
Ortega, M., del Río, P. 2016. Benefits and costs of renewable electricity in Europe. Renewable and
Sustainable Energy Reviews 61, 372-383
Pollitt, M. 2009. Electricity liberalization in the European Union: A progress report, Cambridge working
papers in Economics 0953, Faculty of Economics, University of Cambridge.
Ragwitz, M., Held, A., Resch, G., Faber, T., Haas, R., Huber, C., Coenraads, R., Voogt, M., Reece, G.,
Morthorst, P.E., Jensen, S.G., Konstantinaviciute, I., Heyder, B. 2007. Assessment and optimisation of
renewable energy support schemes in the European electricity market. Final Report of the EU-funded
OPTRES project. Contrat Nº: EIE/04/073/S07.38567.
Rathmann, M. 2007. Do support systems for RES-E reduce EU-ETS-driven electricity prices? Energy
Policy 35, 342–349.
Rathmann, M. 2011. Towards triple-A policies: More renewable energy at lower cost. A report compiled
within the European research project RE-Shaping (work package 7) www.reshaping-res-policy.eu
Intelligent Energy - Europe, ALTENER Grant Agreement no. EIE/08/517/SI2.529243
REN21 2015. Global Status Report. Renewable Energy Policy Network for the 21st century.
Sáenz de Miera, G., del Río, P., Vizcaíno, I. 2008. Analysing the impact of renewable electricity support
schemes on power prices: The case of wind electricity in Spain. Energy Policy 36 (9), 3345-59.
Schmidt, I. 2016. Clean Energy for all Europeans. 15 December 2016
Sensfuß F, Ragwitz M, Genoese M (2008). The merit-order effect: A detailed analysis of the price effect
of renewable electricity generation on spot market prices in Germany. Energy Policy 36 (8): 3086-94.
Simhauser, P., Nelson, T. 2013. The Outlook for Residential Electricity Prices in Australia's National
Electricity Market in 2020. The Electricity Journal 26(4), 66-83.
Smith, M., Urpelainen, J. 2014. The Effect of Feed-in Tariffs on Renewable Electricity Generation: An
instrumental Variables Approach. Environ Resource Econ 57, 367-392.
Tellus Institute 2002. Modeling Analysis: Renewable Portfolio Standards for the Rhode Island GHG
Action Plan. Boston: Tellus Institute.
Traber, T., Kemfert, C. 2009. Impacts of the German Support for Renewable Energy on Electricity
Prices, Emissions, and Firms. The Energy Journal 30(3), 155-178
UCS 2004. Renewable Energy Can Help Ease the Natural Gas Crunch. Cambridge: UCS
Wigan, F., Förster, S., Amazo, A., Tiedemann, S. 2016. Auctions for renewable energy support: lessons
Würburg, K., Labandeira, X., Linares, P. 2013. Renewable generation and electricity prices: Taking
TABLES
Table 1. Instruments for RES-E deployment support in the EU (2013).
Primary instruments Secondary instruments
MS Hydro Wind Bio PV Geo Hydro Wind Bio PV Geo
AT FIT FIT FIT(1); II(2) FIT
BE QO QO QO QO QO TE; II(3) TE; II (3) TE; II(3) TE;II(4) TE
BG FIT FIT FIT FIT; TN(5) FIT FI(6) FI(6) FI(6) FI(6) FI(6)
CY FIT FIT FIT II II II
CZ FIT/FIP FIT/FIP(7) FIT/FIP FIT/FIP(8) II, FI
DE FIT/FIP FIT/FIP FIT/FIP FIT/FIP FIT/FIP FI FI FI FI FI
DK FIP FIP(9); TN(10) FIP FIP FIP II(11) II(11); FI II(11) II(11);
NM; TE II
(11)
EE FIP FIP FIP FIP FIP TE II; TE TE TE TE
EL FIT FIT FIT FIT FIT II; TE II; TE II; TE II; TE II; TE
ES FIT/FIP(12) FIT/FIP(12) FIT/FIP(12) FIT/FIP(12) FIT/FIP(12) TE TE TE TE TE
FI FIP FIP II II II II II FR FIT FIT (13); TN(14) FIT FIT(15); TN(16) FIT II II II II II HR
HU FIT FIT FIT FIT FIT II II II II II
IE FIT FIT FIT FIT FIT TE TE TE TE TE
IT FIT(17); FIP(18); QO; TN(20) FIT(17); FIP(18); QO; TN(20) FIT(17); FIP(18); QO; TN(20) FIT(17); NM(19); QO; TN(20) FIT(17); FIP(18); QO; TN(20) TE TE TE TE TE LT FIT (21); FIT/TN(22) FIT(21); FIT/TN(22) FIT(21); FIT/TN(22) FIT(21);
FIT/TN(22) II, FI II, FI II, FI II, FI II, FI
LU FIT FIT FIT FIT FIT II II II II II
LV FIT FIT FIT FIT FIT II; TE II; TE II; TE II; TE II; TE
MT FIT II(23); FI II(23);
FI; TE
NL FIP FIP FIP FIP
(24); NM(25) FIP FI FI(26) FI FI;II FI PL QO QO QO QO QO FI; II; TE FI; II; TE FI; II; TE FI; II; TE FI; II; TE
PT FIT; TN FIT; TN FIT; TN FIT; TN FIT; TN TE TE TE TE TE
RO QO QO QO QO QO II II II II II
SE QO QO QO QO QO TE;
II(27) TE II
SI FIT; FIP FIT; FIP FIT; FIP FIT; FIP FIT; FIP II; FI II; FI II; FI II; FI II; FI
SK FIP FIP FIP FIP FIP II, TE II, TE II, TE II, TE II, TE
UK QO; FIT(28) QO; FIT(28) QO; FIT(28) QO; FIT(28) QO; FIT(28) TE TE TE TE TE
(1): Solar PV >5kW; (2): Solar PV ≤5kW; (3): Only in Brussels; (4): Only in Flanders; (5): Solar PV>100kW; (6): Only small scale projects; (7): Wind >20MW excluded; (8): Solar PV >30kW; (9): Wind Onshore; (10): Wind Offshore; (11): Small scale installations; (12): Existing plants before January, 2012; (13): Wind Onshore; (14): Wind Offshore; (15): Solar PV <100kW; (16): Solar PV >100kW;(17): Existing plants <1MW; (18): Existing plants >1MW and <1MW which do not choose the FIT; (19): Solar PV <20kW. It is alternative to FIT; (20): New plants – large projects; (21): <10kW; (22): >10kW; (23): Small scale projects <3.7kW; (24): Solar PV >15kW; (25): Solar PV <15kW; (26): Wind Offshore excluded; (27): Wind Offshore; (28): <5MW.
FIT: Feed-in Tariff; FIP: Feed-in Premium; QO: Quota Obligations; TN: Tenders; II: Investment Incentive; FI: Financial Incentive; TE: Tax Exemption; NM: Net Metering. *Member States: AT: Austria, BE: Belgium, BG: Bulgaria, CY: Cyprus, CZ: Czech Republic, DE: Germany, DK: Denmark, EE: Estonia, EL: Greece, ES: Spain, FI: Finland, FR: France, HR: Hungary, IE: Ireland, IT: Italy, LT: Lithuania, LU: Luxembourg, LV: Latvia, MT: Malta, NL: The Netherlands, PL: Poland, PT: Portugal, RO: Romania, SE: Sweden, SL: Slovenia, SK: Slovakia, UK: United Kingdom.
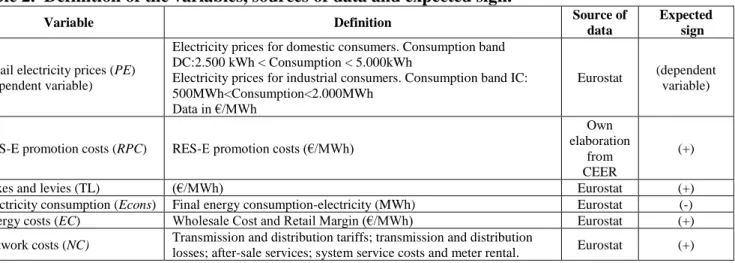
Table 2. Definition of the variables, sources of data and expected sign.
Variable Definition Source of
data
Expected sign
Retail electricity prices (PE) (dependent variable)
Electricity prices for domestic consumers. Consumption band DC:2.500 kWh < Consumption < 5.000kWh
Electricity prices for industrial consumers. Consumption band IC: 500MWh<Consumption<2.000MWh
Data in €/MWh
Eurostat (dependent variable)
RES-E promotion costs (RPC) RES-E promotion costs (€/MWh)
Own elaboration
from CEER
(+)
Taxes and levies (TL) (€/MWh) Eurostat (+)
Electricity consumption (Econs) Final energy consumption-electricity (MWh) Eurostat (-)
Energy costs (EC) Wholesale Cost and Retail Margin (€/MWh) Eurostat (+)
Network costs (NC) Transmission and distribution tariffs; transmission and distribution
losses; after-sale services; system service costs and meter rental. Eurostat (+) Source: Own elaboration
Table 3: Summary of descriptive statistics
Variable Observations Mean Standard Deviation Min Max
PEh 195 161.6179 48.7811 72.1 297.5 Pei 195 128.0292 38.5337 62.6 273.2 RPC 154 14.3552 10.6299 0.49 55.2 NCh 174 51.3189 15.7600 21.8 96.6 NCi 180 28.9511 10.8257 3.5 72.4 TLh 174 41.1925 32.8072 3.4 168.6 TLi 176 7.8340 10.1725 0 59.9 ECh 174 70.3523 29.6837 25.9 204 ECi 180 68.575 27.8792 26.9 201.2 Econs 196 100,200,081 134,925,959 1,608,000 532,424,000 Source: Own elaboration. See text for a definition of the variables.
Table 4: Correlation Matrix
Source: Own elaboration
PEh PEi ECh NCh TLh ECi NCi TLi Econs RPC
PEh 1.0000 PEi 0.7719 1.0000 ECh 0.5371 0.3869 1.0000 NCh 0.5371 0.2735 0.0341 1.0000 TLh 0.8544 0.7342 0.1169 0.3278 1.0000 ECi 0.3128 0.3745 0.7839 0.0562 -0.0741 1.0000 NCi -0.0792 0.2138 -0.3492 0.2518 0.0036 -0.3289 1.0000 TLi 0.5413 0.5348 0.4526 0.0082 0.4769 0.3606 -0.2632 1.0000 Econs 0.4317 0.2514 0.5349 0.0319 0.2605 0.3371 -0.2347 0.4938 1.0000 RPC 0.3098 0.2859 0.2356 0.1545 0.2275 0.3245 -0.0767 0.5263 0.2671 1.0000