Università Politecnica delle Marche
Scuola di Dottorato di Ricerca in Scienze dell’Ingegneria Corso di Dottorato in Ingegneria Industriale
---
The Ripple Effect within Supply Chain
Resilience: a sectoral and modular study
Ph.D. Dissertation of: Giulio Marcucci Supervisor:
Prof. Maurizio Bevilacqua Assistant Supervisor:
Prof. Filippo Emanuele Ciarapica Ph.D. Course coordinator:
Prof. F. Mandorli XVII edition - new series
Università Politecnica delle Marche
Scuola di Dottorato di Ricerca in Scienze dell’Ingegneria Corso di Dottorato in Ingegneria Industriale
---
The Ripple Effect within Supply Chain
Resilience: a sectoral and modular study
Ph.D. Dissertation of: Giulio Marcucci Supervisor:
Prof. Maurizio Bevilacqua Assistant Supervisor:
Prof. Filippo Emanuele Ciarapica Ph.D. Course coordinator:
Prof. F. Mandorli
Università Politecnica delle Marche
Dipartimento di Ingegneria Industriale e Scienze Matematiche Via Brecce Bianche — 60131 - Ancona, Italy
Acknowledgements
To Mom She asked me, "Son, when I grow old Will you buy me a house of gold? And when your father turns to stone Will you take care of me?"
To Dad There goes my hero Watch him as he goes There goes my hero He's ordinary
To Me And you may find yourself
Living in a shotgun shack And you may find yourself In another part of the world
And you may find yourself Behind the wheel of a large automobile And you may find yourself in a beautiful house With a beautiful wife And you may ask yourself, well How did I get here?
To Everyone Else Oh, if the trip and the plan come apart in your hand You can turn it on yourself, you ridiculous clown You forgot what you meant when you read what you said And you always knew you were tired, but then where are your friends tonight?
Abstract
This research work aims to contribute to the academic study of Supply Chain Resilience, through the study of the causal relationships between the various factors that influence the Resilience of a Supply Chain. These causal connections, in fact, can create a ripple effect: a disturbance, instead of remaining localized or contained in a single player of the Supply Chain, can propagate downstream or upstream, influencing the performance of the entire Supply Chain. Such an impact could include, for example, lower revenues, delays in deliveries, loss of market share and reputation.
The proposed study offers a modular approach: these connections are studied through the Fuzzy Cognitive Maps, and this methodology is applied to different case studies: first in the household appliances sector, and second in the fashion sector.
Finally, the Supply Chain Resilience Triangle is shown: a simple and intuitive tool to measure the performance of a Supply Chain during a disturbance, in each of its different phases.
Abstract
Questo lavoro di ricerca ha lo scopo di contribuire allo studio accademico della Supply Chain Resilience, attraverso lo studio delle relazioni causali che accorrono tra i vari fattori che influenzano la Resilienza di una data Supply Chain. Queste connessioni causali, infatti, possono creare un effetto domino: un disturbo, invece di rimanere localizzato in un singolo attore della Supply Chain, può propagarsi a valle o a monte, influenzando le prestazioni dell'intera Supply Chain. Tale impatto potrebbe includere, ad esempio, minori entrate, ritardi nelle consegne, perdita di quote di mercato e di reputazione.
Lo studio proposto offre un approccio modulare: attraverso le Fuzzy Cognitive Maps, verranno infatti studiate queste connessioni, e saranno applicate a casi studio differenti: uno riguardo il settore degli elettrodomestici, e uno nel settore della moda.
Infine, verrà illustrato il Supply Chain Resilience Triangle: uno strumento semplice e intuitivo per misurare le prestazioni di una Supply Chain durante una perturbazione, in ognuna delle sue diverse fasi.
Contents
Acknowledgements ... 7 Abstract ... 9 Abstract ... 11 List of Figures ... 17 List of Tables... 19 1 Introduction ... 211.1 From Risk Management to Resilience ... 24
1.2 Organizational or Supply Chain Resilience? ... 27
1.3 Research Question ... 29
2 From Resilience to Supply Chain Resilience: concept evolution ... 31
2.1 SCR Resilience definition literature review ... 34
3 Sector Analysis ... 39
3.1 Literature Review... 39
3.2 Materials and Methods ... 42
3.2.1 Fuzzy Cognitive Maps ... 42
3.3.1 First Phase: Development of a Cognitive Modelling Group 49
3.3.2 Second Phase: Development a Fuzzy Cognitive Map ... 49
3.3.2.1 IV step: Fuzzy Cognitive Map Design ... 50
3.3.2.2 V Step: Fuzzy Cognitive Map refinement ... 53
3.3.2.3 VI step: Hidden patterns identification ... 54
3.4 Home Appliance Case Study ... 54
3.4.1 I Step: Problem identification ... 55
3.4.2 II Step: Literature research, factors affecting SCR ... 56
3.4.3 III Step: Taxonomy ... 60
3.4.4 IV Step: FCM Design ... 65
3.4.5 V Step: Refinement Phase ... 66
3.4.6 VI Step: Hidden pattern recognition phase ... 66
3.5 Fashion Case Study ... 76
3.5.1 I Step: Problem identification ... 77
3.5.2 II Step: Literature research, factors affecting SCR ... 77
3.5.3 III Step: Taxonomy ... 83
3.5.4 IV Step: FCM Design ... 87
3.5.5 V Step: Refinement Phase ... 88
4 Supply Chain Resilience Triangle ... 96
4.1 Resilience Triangle within the SC performance profile ... 98
4.2 Resilience Triangle Taxonomy ... 102
4.3 Supply Chain Resilience Triangle Modular Analysis ... 106
4.3.1 Literature review: factor Research ... 107
4.4 Factor categorization ... 111
5 Conclusions and further research ... 117
6 Appendix A – Weighted Matrix, Home Appliance case study ... 120
7 Appendix B - Weighted Matrix, Fashion sector case study ... 121
8 Appendix C - SCR Definitions Taxonomy Results ... 122
List of Figures
Figure 1.1: Classic Risk Management Framework ... 25
Figure 1.2: Traditional Risk Assessment ... 26
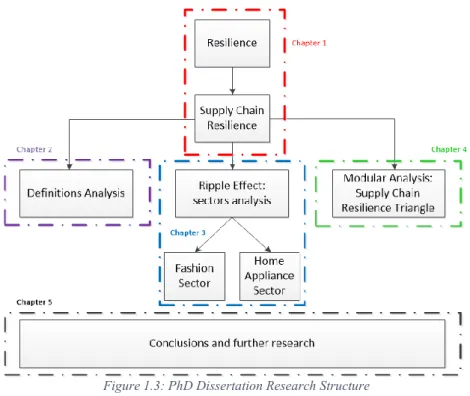
Figure 1.3: PhD Dissertation Research Structure ... 29
Figure 1.4: Events Chain...30
Figure 2.1: Maslow pyramid of needs ... 32
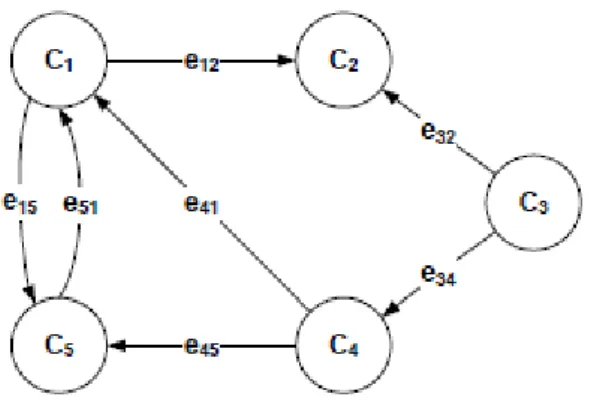
Figure 3.1: The structure of a FCM ... 43
Figure 3.2: Adjacency matrix ... 43
Figure 3.3: Research Approach ... 48
Figure 3.4: Membership function for the fuzzy weights ... 51
Figure 3.5: Example of Center of Gravity method application ... 53
Figure 3.6: Home Appliance Case Study Fuzzy Cognitive Map ... 65
Figure 3.7:Fashion case study FCM ... 87
Figure 4.1: The Resilience Triangle ... 96
Figure 4.2: Resilience Triangle according to Yu et al. (2014) analysis ... 98
Figure 4.3: Resilience Triangle with dampen time ... 98
Figure 4.4: The disruption profile plotted by Sheffi and Rice (2005) ... 99
Figure 4.5: The Resilience Triangle of a SC plotted according to Sheffi and Rice (2005) ... 101
Figure 4.7: Characteristics gathered in the 25 SCR definitions ... 104 Figure 4.8: Connections among the various sectors of the Supply Chain Resilience Triangle... 106
List of Tables
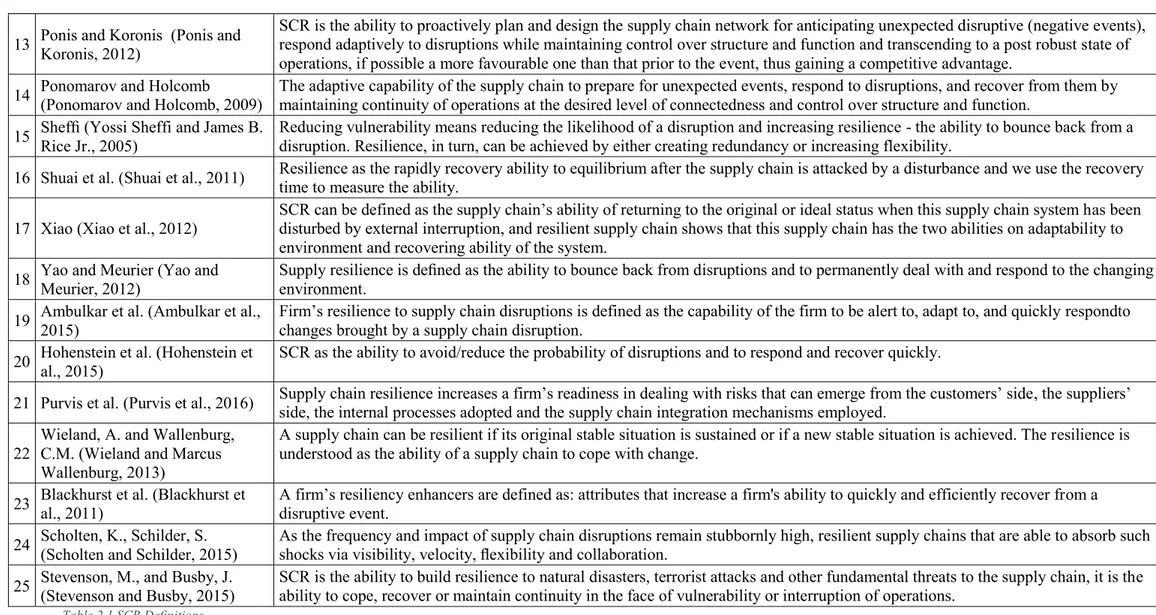
Table 2.1 SCR Definitions ... 38
Table 3.1: An example regarding the concept SC visibility ... 50
Table 3.2: Home Appliance SC Players ... 55
Table 3.3: Factors affecting SCR...58
Table 3.4: Taxonomy analysis: concepts definition...63
Table 3.5: Principal Paths of the whole SC... 67
Table 3.6: Tier Two Supplier - Principal Paths... 68
Table 3.7: Tier One Supplier - Principal Paths ... 68
Table 3.8: Manufacturer - Principal Paths ... 69
Table 3.9: Shipper - Principal Paths ... 70
Table 3.10: Distributor - Principal Paths ... 70
Table 3.11: Fashion Industry SC Players ... 76
Table 3.12: Factors affecting SCR...81
Table 3.13: Taxonomy analysis: concepts definition ... 865
Table 3.14: SC case study principal paths ... 898
Table 3.15: Tier-one supplier principal paths ... 90
Table 3.16: Manufacturer Principal Paths ... 90
Table 3.17: Shipper principal paths ... 91
Table 4.1: Disruption profile analysis ... 101
Table 4.2: Factor research result. C=Capability, V=Vulnerability ... 110
Table 4.3: Vulnerabilities analysis results ... 114
1 Introduction
This PhD dissertation aims to extend the current study on Supply Chain Resilience (SCR), a subject that has been studied in the scientific literature since the beginning of the new millennium. Some crucial episodes, both from an industrial and an economic point of view, have in fact guided the scientific community into the re-thinking of some doctrines.
One of these episodes has been the attack at the Twin Towers on 2011 September 11th, an event which caused a dramatic death toll of 2974 people,
and, in addition, triggered a series of events that caused short and medium-term influences in the economic, financial and industrial worlds, as confirmed by the report for the American congress written by Gail Makinen (2002).
Additionally, according to Ernst and Young estimates (2002), the attacks resulted in a $13 billion loss of destroyed private equity and government bonds, along with an estimated $35 to $50 billion loss of insured losses and extreme equity market volatility that wiped out $1.2 trillion of equities in the first week after trading resumed. These figures are just a few examples of the macroeconomic consequences that could be observed in the short term.
Some case studies also exemplify the consequences that this event has had at a widespread level. For example, due to the immediate closure by the
United States of its borders and all incoming and outgoing flights, there was an immediate impact on many Supply Chains (SCs). Ford Motor Co. had to run several assembly lines intermittently empty, as trucks loaded with components were delayed arriving from Canada and Mexico: Ford's fourth quarter 2001 production decreased by 13% compared to its production plan. Toyota suffered similar consequences too, since the production stopped at its Indiana plant, as it was waiting for steering sensors that usually came by air from Germany. (Yossi Sheffi and James B. Rice Jr., 2005).
Another emblematic episode happened right at the beginning of the new millennium has been the "fire that changed an industry" (Mukherjee, 2008): on March 17, 2000, a lightning bolt struck a semi-conductor manufacturing plant in New Mexico, U.S., owned by Philips. This plant was one of the primary suppliers of, simultaneously, Ericsson and Nokia. Both companies were informed of the plant's disruption and both were notified that production would resume regularly in a week.
The behaviour of both companies in the following days would irreparably affect their future.
The Nokia executives, in fact, immediately checked if the damage could be solved in a week: once they knew the opposite, that the damage would be solved in more than a month and that this would have delayed the production of millions of mobile phones, they implemented three key actions:
• A team of executives and engineers focused on Philips, looking in the development of alternative plans and putting pressure on Nokia's case with Philips executives. Philips responded by reorganizing its plans in their Eindhoven and Shanghai factories; • A second intercontinental team redesigned some chips so that they
could be produced in other Philips facilities and not Philips. Where appropriate, they consulted with Philips to assess the possible impact of their actions;
• A third group worked to find alternative manufacturers to reduce the pressure on Philips. Two current suppliers responded within five days.
On the other hand, Ericsson's executives began to take action more than a month after the incident, when the damage was now unrecoverable.
Then, on July 20, 2000, Ericsson reported that the fire and component shortages had caused a second-quarter operating loss of $200 million in its mobile phone division. As such, annual earnings would be lower by between $333 million and $445 million. While Nokia’s initial sensing of the problem and its rapid and effective response carried the day: in the third quarter of 2000, its profits rose 42% as it expanded its share of the global market to 30%. The face of the mobile phone industry had changed forever, all because of a fire that had been contained in ten minutes.
These events have guided the evolution of the study of risk, in parallel, under two aspects, which will be explained separately in the following paragraphs.
1.1 From Risk Management to Resilience
The first aspect is mainly concerned with the evolution of the concept of risk study itself. According to, in fact, the definitions reported by ISO 31000 (International Organization for Standardization, 2018, p. 31000), “Risk management” refers to “a coordinated set of activities and methods that is used to direct an organization and to control the many risks that can affect its ability to achieve objectives”. The term risk management also refers to the programme that is used to manage risk. This programme includes risk management principles, a risk management framework, and a risk management process.
In particular, according to ISO 31000, a risk management process systematically applies management policies, procedures, and practices to a set of activities intended to establish the context, communicate and consult with stakeholders, and identify, analyse, evaluate, treat, monitor, record, report, and review risk.
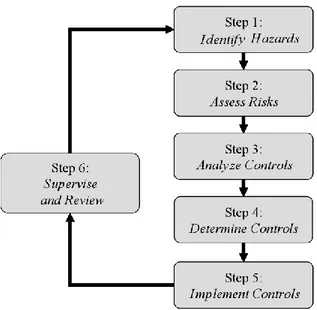
A typical view of the traditional risk management process is shown in Figure 1.1, depicting a continuous cycle of hazard identification, risk
assessment, control analysis, choice of controls, implementation of controls and review (Manuele, 2005; Pettit et al., 2010).
By focusing the analysis on step 2, it can be said that risk assessment is the formal process of calculating the risk of an event and making a decision on how to react to that risk. This risk assessment process is a useful technique to conduct a probabilistic risk assessment, which uses many techniques to identify and analyse risks to the system. These risks are quantified, and their consequences determined. Then the risk is assessed, and, on the basis of this information, the risk manager is able to decide whether it is justifiable to accept the risk.
The first step of the risk assessment methodology is to define the objectives of the assessment: in defining the assessment objectives, the objective, the scope, and the states of damage that are of interest should be clearly indicated.
In both research and industrial management environments, however, it has been realised that this classic risk management approach is often insufficient. The classic approach, in fact, sees risk assessment as a fundamental step: it is therefore flawed if, in some cases, the risk is not predictable and subsequently not assessable.
The greatest weakness of risk management is its inability to adequately characterize low-probability, high-consequence (LP/HC) events (see Figure 1.2).
Consequently, the concept of Resilience has made its way into the research and general approach to the issue, understood as a complementary and innovative step to the classic approach of risk management in order to
adapt the methodology to the needs of modern businesses. For companies, it is crucial to show flexibility and ability to react positively and proactively to the changes that the market imposes, such as the different needs of consumers, the intrinsic competitiveness of the market itself, and all the disruptions that can happen and change the normal performance of the company.
Through this resilient approach, it is possible to go beyond traditional risk management, by learning to overcome challenges and taking advantage of the opportunities with a strong-willed attitude, by reshaping the management standard and by taking care, in this perspective, of staff training in order to create a collaborative environment in respect of the efficiency and production vocation of the company.
1.2 Organizational or Supply Chain Resilience?
The second aspect to research, which emerged from the case studies that have taken place over the recent years, consists in the fact that studying organizational resilience, or resilience limited to a single actor in the SC, is often not enough. While business architecture in fact has changed, the business environment has also evolved, increasing the risk connected to SC disruptions, as many authors suggest (Urciuoli 2010; Pettit, Fiksel, and Croxton 2010).
In fact, the need to guarantee competitiveness in a global market has led many SCs to expand geographically and consequently SC structures have been facing an increased exposure to a larger set of uncertainties (Ribeiro and Barbosa-Póvoa 2018).
This is because, due to this evolution of the economic and industrial world, the degree and number of connections between operating companies automatically increases: this evolution causes then the intensification of some trends. For example, is safe to assume that a low level of connectivity within a system can only cause a gradual change in the network as a whole, rather than a sudden response to a small change. This is due to the fact that the actors of this system are relatively isolated. However, as conditions change, highly connected systems can reach a tipping point where a local disturbance can cause a ripple effect on the total, or on a part, of the system (Scheffer et al., 2012). This phenomenon has led the world of research to carry out a very significant number of studies on the disturbances and their repercussions on the performance of the whole SC, thus placing greater emphasis on the so-called ripple effect (Dolgui et al., 2018; Ivanov, 2018; Liberatore et al., 2012).
The ripple effect in fact occurs when a disturbance, instead of remaining localized or contained in a part by a single player of the SC, falls downstream and affects the performance of the entire SC.
1.3 Research Question
The purpose of the present dissertation is to further study how different factors influence SCR and how the same factors influence themselves: In order to do so, the thesis is organized as follows:
The first chapter introduces the concept of SCR. The second chapter examines in more detail the many facets of the concept, in order to lay out the basis of the overall study.
The third chapter exemplifies SCR sectoral study, in relation to the Ripple Effect, with the application of the FCM methodology, which is introduced in the same chapter. Subsequently, the occurrences of the different factors cited in the SCR literature are shown and FCM are used to show the
connections among these factors and SCR. This approach can unveil the connections among the various factors that influence SCR, and the factors themselves. The key added value offered by this approach is the analysis of the causal relationships through which decision makers can examine step by step the ripple effect that from a trigger event “A”, exogenous or endogenous to the SC, can consequentially bring an undesirable event “D”, through intermediate events (for instance “B” and “C” in figure 1.4). The knowing of this events chain can help make targeted measures in order to prevent the happening of the event “D”. Sometimes, in fact, if events “A”, “B” or “C” do not happen the final event “D” cannot begin at all, and therefore its negative consequences cannot take place.
The fourth chapter exemplifies the Supply Chain Resilience Triangle, a tool to quantify SCR in an intuitive and figurative way. This tool can support the research, by differentiating how one factor can influence SCR, e.g. is a factor influencing, positively or negatively, the recovery phase or the mitigation phase?
Finally, the last chapter shows the conclusions and possible further research.
2 From Resilience to Supply Chain
Resilience: concept evolution
The word “resilience” has its roots in the latin word “resiliens”, present participle of resilire "to rebound, recoil," from re- "back" (see re-) + salire "to jump, leap and nowadays, according to the “Oxford Advanced Learners Dictionary”, “resilience” is the ability of a substance to return to its original shape after it has been bent, stretched or pressed.
Many research fields borrowed then the term “resilience”, in fact this concept is multidimensional and multidisciplinary, since it has been the subject of scientific research for many years in disciplines e.g. psychology and ecosystems.
In ecology, Holling proposed systems to have two distinct properties: resilience and stability. He associated in fact “resilience” to the ability of systems to absorb changes, opposed to “stability” as the ability of the latter systems to return to a state of equilibrium after a temporary disorder (Holling, 1973).
From a social point of view, Timmerman (1981) was one of the first to define the resilience as “the measure of a system’s, or part of a system’s capacity to absorb and recover from the occurrence of a hazardous event”.
This definition has been then evolving: the United Nations Office for Disaster Risk Reduction, for example, provided a more complete definition i.e. “the capacity of a system, community or society potentially exposed to hazards to adapt, by resisting or changing in order to reach and maintain an acceptable level of functioning and structure” (Living with risk, 2004).
In order to exemplify the importance of resilience in modern society, a parallelism can be created, for example, between a company and a human being needs: the needs of an individual and the order of the priority with which they are met are listed in the "Maslow Pyramid", which is shown in Figure 2.1. As it can be seen, every individual first satisfies those who are his or her physiological needs, i.e. those necessary for its survival (such as breathing, eating, sleep), and only after having satisfied those, the same individual care to satisfy next level needs: those concerning its security, and progressively, those of membership, estimate and self-realization. Each level of the pyramid is taken into consideration and satisfied only when it is the one
that precedes it. This because needs do not have the same degree of importance. Some aspects, compared to others, have greater priority to be taken into account.
Even if a business company is a more complex system then a human being, since it consists of multiple processes and activities, the same dynamic characterizes it: processes and activities have not all the same priority. That’s why, as well as to a human being, a pyramid of needs can be applied to business: in this pyramid, resilience should occupy the level dedicated to safety. Therefore, it holds a position of some importance, and essential to the survival of a business, which justifies the attention that should be given to its study and its development.
During the last decades, the resilience concept was then adopted by SC specialists researcher in order to outline the new performance requirement of companies, as players of a SC. Given the evolution of modern business society in fact, the characteristic of resilience has become a very important competitive factor (Annarelli and Nonino, 2016; Ponomarov and Holcomb, 2009).
Tukamuhabwa et al. (2015), in their work, summarized the most important SCR definitions developed so far. Among these definitions, the most concise reads as follows: “The ability of a system to return to its original
state or move to a new, more desirable state after being disturbed” (Christopher and Peck, 2004).
2.1 SCR Resilience definition literature review
In order to best conduct this research, a literature review on the various SCR definition has been conducted. The concept of SCR has in fact emerged several times in literature.
A number of 25 definitions have been found (see Table 2.1), supporting the hypothesis that there is a lack of consensus among the scientific community regarding the definition of SCR (Spiegler et al., 2012; Mensah and Merkuryev, 2014).
Ponomarov and Holcomb (2009) define SCR as the SC adaptation capability to prepare for unexpected events, respond to interruptions, and recover from them to maintain continuity of operations at the desired level of connection and control over the structure and function. Ponomarov and Holcomb also state that SC managers strive to reach the fully integrated, efficient and effective SC ideals that can create and sustain a competitive edge. To this end, they must balance the downward pressure on costs and the need for efficiency, with effective means, all to handle market demands and the risks of bankruptcy in the SC.
According to Ponis and Koronis (Ponis and Koronis, 2012), SCR is the ability to plan and design the SC network in order to anticipate disruptive and unexpectedly negative events, proactively respond in an adaptive manner to interruptions, maintain control over structure and function and arrive at a robust final state of operation, if possible, more favorable than before interruption, thus gaining a competitive edge.
Arguably, the latter two definitions are the most complete: these two definitions incorporate in fact the most features, including adaptation, preparation, response, connection, and control capabilities, as well as timely recovery to return to the original state or, preferably, to a better state.
An additional point of view is offered by Wieland and Wallenburg (2013), which claim that a SC can be resilient if its conditions remain stable at the original state or if a new stable situation is obtained. Resilience is therefore understood as the ability of a SC to cope with change. In Wieland and Wallenburg's paper, compared to other authors, relationship skills are more thoroughly analyzed. If companies build collaborative relationships with other members of the SC, in order to gain a competitive advantage, these relationships can be exploited to improve SCR. Consequently, relational vision is applied, which results in three types of relational skills, namely communication, cooperation and integration that facilitate the resilience of a
SC. The two authors distinguish proactive and reactive strategies to achieve resilience, which can be referred to as robustness and agility, respectively.
Carvalho et al. (2011) in one of their works offer a study of SCR, defining it as the system’s ability to return to its original state or to a new more desirable one after experiencing a disturbance and avoiding occurrence of failure modes. The goal of SC resilience analysis and management is to prevent the shifting to undesirable states, i.e., the ones where failure modes could occur.
# Source Definitions
1 Carvalho et al. (Carvalho et al., 2012)
To survive, organizations and their supply chains must be resilient: they must develop the ability to react to an unforeseen disturbance and to return quickly to their original state or move to a new, more advantageous one after suffering the disturbance 2 Brandon-Jones et al. (Brandon-Jones et al., 2014) SCR is defined as the ability of a system to return to its original state, within an acceptable period of time, after being disturbed.
3 Carvalho et al. (Carvalho et al., 2011)
SCR is concerned with the system’s ability to return to its original state or to a new more desirable one after experiencing a
disturbance and avoiding occurrence of failure modes. The goal of supply chain resilience analysis and management is to prevent the shifting to undesirable states, i.e., the ones where failure modes could occur.
4
Christopher and Peck
(Christopher and Peck, Helen, 2004)
The ability of a system to return to its original state or move to a new, more desirable state after being disturbed.
5 Closs and McGarrell (Closs and McGarrell, 2004)
SCR refers to the supply chain’s ability to withstand and recover from an incident. A resilient supply chain is proactive –
anticipating and establishing planned steps to prevent and respond to incidents. Such supply chains quickly rebuild or re-establish alternative means of operations when the subject of an incident.
6 Datta (Datta, 2007) SCR is not only the ability to maintain control over performance variability in the face of disturbance but also a property of being adaptive and capable of sustained response to sudden and significant shifts in the environment in the form of uncertain demands. 7 Datta et al. (Datta et al., 2007) Resilience of the supply network is the ability of the production–distribution system to meet each customer demand for each product on time and to quantity. 8 Erol et al. (Erol et al., 2010) Resilience is a response to unexpected or unforeseen changes and disturbances, and an ability to adapt and respond to such changes. 9 Falasca et al. (Falasca et al., 2008) Resilience is defined as the ability of a supply chain to reduce the probabilities of a disruption, to reduce the consequences of those
disruptions when they occur and to reduce the time to recover normal performance. 10
Gaonkar and Viswanadham (Gaonkar and Viswanadham, 2007)
SCR is the supply chain with the ability to maintain, resume and restore operations after a disruption.
11 Guoping and Xinqiu (Guoping and Xinqiu, 2010)
SCR is the ability of the supply chain to return to its original or ideal status under emergency risk environment.
12 Longo and Oren (Longo, F. and T. Oren, 2008)
Resilience is a critical property that, in a context of supply chain change management, allows the supply chain to react to internal/external risks and vulnerabilities, quickly recovering an equilibrium state capable of guaranteeing high performance and efficiency levels.
13 Ponis and Koronis (Ponis and Koronis, 2012)
SCR is the ability to proactively plan and design the supply chain network for anticipating unexpected disruptive (negative events), respond adaptively to disruptions while maintaining control over structure and function and transcending to a post robust state of operations, if possible a more favourable one than that prior to the event, thus gaining a competitive advantage.
14 Ponomarov and Holcomb (Ponomarov and Holcomb, 2009) The adaptive capability of the supply chain to prepare for unexpected events, respond to disruptions, and recover from them by maintaining continuity of operations at the desired level of connectedness and control over structure and function. 15 Sheffi (Yossi Sheffi and James B.
Rice Jr., 2005)
Reducing vulnerability means reducing the likelihood of a disruption and increasing resilience - the ability to bounce back from a disruption. Resilience, in turn, can be achieved by either creating redundancy or increasing flexibility.
16 Shuai et al. (Shuai et al., 2011) Resilience as the rapidly recovery ability to equilibrium after the supply chain is attacked by a disturbance and we use the recovery time to measure the ability.
17 Xiao (Xiao et al., 2012)
SCR can be defined as the supply chain’s ability of returning to the original or ideal status when this supply chain system has been disturbed by external interruption, and resilient supply chain shows that this supply chain has the two abilities on adaptability to environment and recovering ability of the system.
18 Yao and Meurier (Yao and Meurier, 2012)
Supply resilience is defined as the ability to bounce back from disruptions and to permanently deal with and respond to the changing environment.
19 Ambulkar et al. (Ambulkar et al., 2015)
Firm’s resilience to supply chain disruptions is defined as the capability of the firm to be alert to, adapt to, and quickly respondto changes brought by a supply chain disruption.
20 Hohenstein et al. (Hohenstein et al., 2015) SCR as the ability to avoid/reduce the probability of disruptions and to respond and recover quickly.
21 Purvis et al. (Purvis et al., 2016) Supply chain resilience increases a firm’s readiness in dealing with risks that can emerge from the customers’ side, the suppliers’ side, the internal processes adopted and the supply chain integration mechanisms employed.
22
Wieland, A. and Wallenburg, C.M. (Wieland and Marcus Wallenburg, 2013)
A supply chain can be resilient if its original stable situation is sustained or if a new stable situation is achieved. The resilience is understood as the ability of a supply chain to cope with change.
23 Blackhurst et al. (Blackhurst et al., 2011) A firm’s resiliency enhancers are defined as: attributes that increase a firm's ability to quickly and efficiently recover from a disruptive event.
24 Scholten, K., Schilder, S. (Scholten and Schilder, 2015) As the frequency and impact of supply chain disruptions remain stubbornly high, resilient supply chains that are able to absorb such shocks via visibility, velocity, flexibility and collaboration. 25 Stevenson, M., and Busby, J.
(Stevenson and Busby, 2015)
SCR is the ability to build resilience to natural disasters, terrorist attacks and other fundamental threats to the supply chain, it is the ability to cope, recover or maintain continuity in the face of vulnerability or interruption of operations.
3 Sector Analysis
This chapter exemplify the two case studies addressed during this analysis, and the methodological approach this research is based upon.
3.1 Literature Review
Different empirical studies have been conducted to analyze the perspectives of SCR, along with SC Robustness and Business Continuity theories. Kim et al. (2015) summarized the most relevant research about Supply Network resilience and disruption, outlining existing definitions, measures and the subject level of analysis. Christopher and Peck (2004) offered a conceptual model to classify some sources of SC risks and suggest how to overcome those risks. Craighead et al. (2007) employed structured interviews and critical incident techniques to understand why disruption severity varies among SCs. Wu et al. (2007) utilized a modeling approach to understand the propagation of disruptions across SC systems.
Furthermore, many qualitative and quantitative studies were conducted to examine SCR and its characteristics. Carvalho et al. (2011), for example, conducted a study exploring the connections between four important factors with an important role in SC: lean, agile, resilient and green paradigms. Ponis and Koronis (2012), after contextualizing resilience within
the context of the SC, studied when SC capabilities could decrease the presence of interruptions and how these abilities affect SCR. Datta et al. (2007) developed an agent-based computational framework, in order to improve operational resilience into a worldwide SC, providing a case study example. Wieland and Marcus Wallenburg (2013), in their work, explored the SCR concept, analysing the connection between relational competencies and SCR and the effect of the latter to the SC final costumer. An interesting aspect of this research was the conceptual division between the proactive and reactive dimension of resilience.
This analysis of literature, as Rajesh and Ravi state (2015), reveals that most of the works in SC risk management and risk mitigation strategies are rather qualitative or empirical. Rajesh and Ravi (2015) tried to quantify the enablers for SC risk mitigation, in order to find the causal relationships among them. In their research, they have identified fifteen enablers of SC risk mitigation, and have then used the Grey–DEMATEL methodology to find the causal relationships among them. This framework did not provide a validation-second-step of the fifteen enablers: the research was conducted only by finding those enablers in various works.
Pettit, Fiksel, and Croxton (2010) presented a similar framework, but they used a two-step method to create resilience factor taxonomies, by
performing an extant literature analysis and then refining and validating such analysis through a panel of experts.
Many studies highlight factors that influence SCR by conducting interviews to panels of experts and/or operators of the SC itself (Bueno-Solano and Cedillo-Campos, 2014; Colicchia et al., 2010; Pettit et al., 2010). These authors connected SCR to capabilities and vulnerabilities highlighting that SCR is reached not only through the SC’s capabilities, but mainly by finding a balance between capabilities and vulnerabilities.
Literature is abundant in terms of connections between these factors and SCR. For example, Brusset and Teller (2017) tested a conceptual model that proposes a relationship between SC capabilities and resilience through variance-based structural equation modelling. Chowdhury and Quaddus (2016), after an extensive literature review, explore and validate the antecedents of SCR through quantitative and qualitative analysis.
What literature lacks are the links between those factors. For example, many researchers point out the connection between Just in Time (JIT) practices and SCR, and many others point out the unfortunate economic environment as an inhibitor of SCR; but does the economic environment influence the application of JIT practices and therefore SCR through these relationships? In this paper, we aim at filling the gap between those factors,
interleaving the causal relationship between them by developing a resilience analysis based on FCMs, which are shown in the next section.
3.2 Materials and Methods
3.2.1 Fuzzy Cognitive Maps
Medicine (Froelich et al. 2012), neurocomputing (Papageorgiou and Poczęta 2017), social economics (Roban and Secme, 2005), and agriculture (Papageorgiou et al. 2013) are only some of the fields of studies in which FCMs have been used as predictive instruments.
FCMs provide a graphical model of the behavior of a dynamic system through a graph representation. In the graph, concepts are represented as nodes and the associations between the concepts are represented as weighted edges. The nodes are connected by signed and weighted edges representing the causal relationships that exist among concepts. Concepts that represent the cause or the means to achieve a given goal are situated at the arrow’s tail and concepts that represent the effect or the end are situated at the arrow’s head. The structure of an FCM is shown in Figure 3.1: Ci is a concept with a
state value and the weight eij of an arrow indicates the influence degree from
the cause concept Ci to effect concept Cj; eij can assume a fuzzy value within
[−1, 1]. The FCM shown in Figure 3.1 can be also represented by the adjacency matrix reported in Figure 3.2.
The FCM construction, the identification of concepts and their influence degree, requires the input of human experience and knowledge on the system under analysis through semi-structured interviews (Eden 1988; Laukkanen 1998) or the input from documents and historical data (Azelrod, 1976).
The interconnections between concepts are defined according to expert opinion and they are evaluated through linguistic values. In this work, all the proposed linguistic values for the same interconnection, are aggregated
Figure 3.1: The structure of a FCM
using the SUM method (Fang, 2006) and an overall linguistic weight is produced. With the use of the defuzzification method of the centre of gravity - COG (Lin and Lee, 1996) the overall linguistic weight is transformed to a numerical weight. The negative, the null and the positive eij values represent
the three possible types of causal relationships between concepts;
• eij=0 indicates no causality relationship between concepts Ci and Cj;
• eij>0 indicates positive causality between concepts Ci and Cj: an
increase/decrease in the value of Ci leads to an increase/decrease in
the value of Cj;
• eij<0 indicates negative causality between concepts Ci and Cj: an
increase/decrease in the value of Ci leads to a decrease/increase in the
value of Cj.
In order to allow an in-depth analysis of the map, FCM provide the study of two indexes, such as the indirect effect and total effect.
The indirect effect is defined now by the operation: Ik(Ci, Cj) = min{e(Cp, Cp+1)} (3.1)
The symbol (Cp, Cp+1) indicates the path (or paths) between concepts
Cp and Cp+1. In fact, it is necessary to identify a concept concatenation as a
chain of concepts, where the weight e(Ci, Cj) represents the “strength” of each
The equation (3.1) can be explained with the metaphor “a chain is only as strong as its weakest link”. If in the chain a weak connection exists, it is not possible to consider the chain as a "resistant chain", but the total “strength” of the chain is quantified with the “strength” of the weak connection (Bevilacqua et al., 2012).
When there is more than a concatenation among the cause node and the effect node, it is useful to define the total effect TE(x,y). According to Axelrod (2015), causal variable Ci's total effect on effect variable Cj is the
aggregate sum of all the paths’ indirect effects from each causal variable associated with each effect variable, as shown in Equation (3.2).
TE(Ci, Cj) = max{Ik(Ci, Cj)} (3.2)
Ik(Ci, Cj) and TE(Ci, Cj) have to be interpreted according to the fuzzy mathematics and e(Cp, Cp+1) with the relationship weight expressed using
fuzzy values. Indeed, according to Kosko (1986), Ik(Ci, Cj) and TE(Ci, Cj)
can be identified with t-norm (triangular-norm) and t-conorm (triangular conorm). Alsina et al. (1983) introduced the t-norm and the t-conorm into fuzzy set theory and suggested that the t-norm and the t-conorm be used for the intersection and union of fuzzy sets. Consider for instance, the connections between concepts C1 and C5 as reported below:
𝐼2(𝐶1, 𝐶5) = 𝑠𝑜𝑚𝑒
𝐼3(𝐶1, 𝐶5) = 𝑠𝑜𝑚𝑒
The presence of three different paths connecting the same nodes (C1
and C5) implies that the concept C1 can affect in several ways the final node
(C5) with different effects. For this reason, with the TE calculus, it is possible
to identify the maximum effect of C1 on C5:
Finally, the concept C1 affects “much” the concept C5. At the same
time, if a more complex evaluation scale is considered, taking into account a symmetric scale with negative connections, i.e. ranging from Very Low to Very High (see Figure 3.4), it could be possible to identify situations in which some indirect effects manifest positive effects while others manifest negative effects: “an indeterminate effect”. If 𝐼1(𝐶1, 𝐶5) = 𝑉𝑒𝑟𝑦 𝐿𝑜𝑤 and 𝐼2(𝐶1, 𝐶5) =
𝑉𝑒𝑟𝑦 𝐻𝑖𝑔ℎ, in absolute terms, both the connections have a high impact on the concept C5 but, in reality, they show different behaviours on the final
concept: the first connection has a negative impact, and the second one is positive. In this case, it is not possible to consider just one of them but the analyser has to distinguish all the possible situations according to the point of view of the analysis.
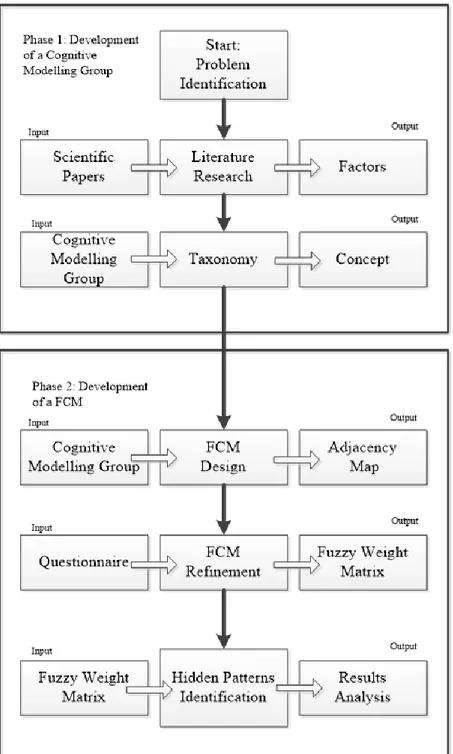
3.3 Research Approach
The structured research approach proposed in this work consists of 2 phases divided into steps as shown in Figure 3.3. The first phase, the “Development of a Cognitive Modelling Group”, aims at defining a general framework that can be applied to other SCs. This framework identifies the most important SC concepts and how these concepts affect each other and SCR. The second phase, “Development of an FCM”, is developed for analysing a specific SC and it allows SC managers to identify the most important disruptions and to define SC design strategies to increase the resilience of the specific SC.
It will be applied to each of the two case study subsequently shown in this chapter.
3.3.1 First Phase: Development of a Cognitive Modelling Group
The first phase consists of three steps:
I. The first step of the proposed method, i.e., the “Problem identification”, is necessary to define the scope and focus of analysis as well as to set all the relevant parameters of the model;
II. The second step, the “Literature Research”, is based on the research in extant literature and it aims at finding all factors that influence SCR and analysing how these factors impact on it;
III. The third step, “Taxonomy”, is necessary in order to group these factors, since many factors referred to similar topics and moreover to develop a shorter and more comprehensible questionnaire for experts not to affect the likelihood of obtaining an incomplete questionnaire from the experts.
3.3.2 Second Phase: Development a Fuzzy Cognitive Map
3.3.2.1 IV step: Fuzzy Cognitive Map Design
In the fourth step, called “FCM Design” (figure 3.3), the Cognitive Modelling Group found the links existing among the concepts outlined during the taxonomy step to build the Cognitive maps and the adjacency matrix.
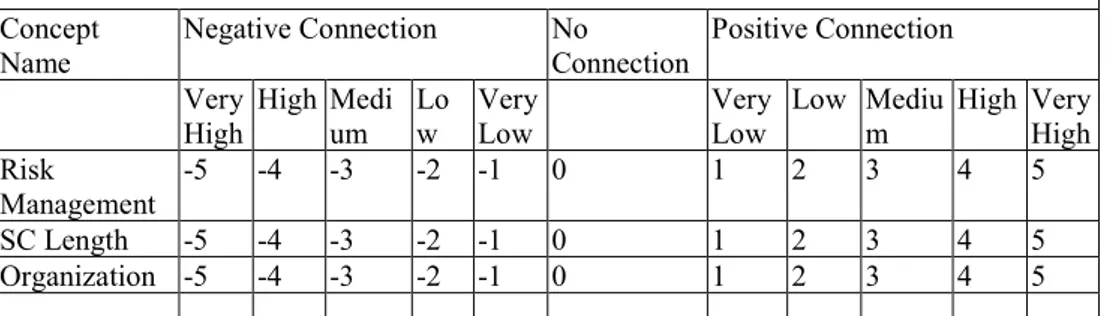
In the “FCM Design” step, each expert provides its personal cognitive map, in the form of a weighted matrix. Specifically, they have to rate the various relationships using fuzzy labels: very low, low, medium, high and very high. In order to facilitate the experts in the questionnaire filling out phase (concerning the possibility to express negative and positive connection between concepts), the Fuzzy Likert scale labels have been indicated with numbers ranging in [-5 5] (the label 0 means no correlation between concepts). Table 3.1 is an excerpt from the evaluation sheet provided for the interviewees.
SC Visibility is influenced by: Concept
Name Negative Connection No Connection Positive Connection Very
High High Medium Low Very Low Very Low Low Medium High Very High Risk Management -5 -4 -3 -2 -1 0 1 2 3 4 5 SC Length -5 -4 -3 -2 -1 0 1 2 3 4 5 Organization -5 -4 -3 -2 -1 0 1 2 3 4 5 ….
The weight sign allows researchers to define eij values. As suggested
by Bevilacqua et al. (2016), in order to obtain a unique assessment of the individual concepts, semantic values were attributed to the relationships between concepts.
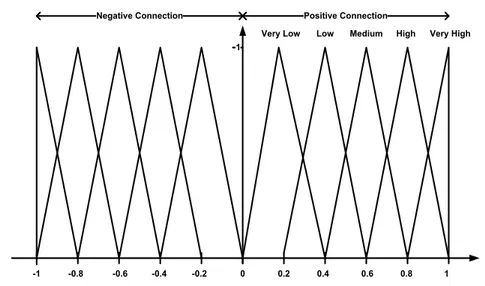
Subsequently, each assessment was converted into a numerical format using the appropriate triangular fuzzy functions (figure 3.4). The triangular fuzzy sets play a particular role since they appear as the natural fuzzy counterpart to uniform probability distributions on bounded intervals. In particular, as asserted by Pedrycz (1994) the cuts of triangular fuzzy sets contain the “confidence intervals” of a symmetric probability distribution with the same mode and support. For these reasons, triangular fuzzy sets are often used to quantify linguistic data. The use of triangular fitness functions is fairly common in literature (Chan and Wu, 2005; Karsak, 2004) as
1
-1 -0.8 -0.6 -0.4 -0.2 0 0.2 0.4 0.6 0.8 1 Very Low Low Medium High Very High
Positive Connection Negative Connection
triangular fuzzy sets are among the few fuzzy sets forms that are easy to manage from a computational point of view, yielding the optimal distribution-free confidence intervals for symmetric probability distributions with bounded support.
The final assessment was derived from values lb (lower bound), mb
(medium bound) and ub (upper bound) of the triangular functions shown in
Fig. 3.4. The evaluations of the interviewees have then been weighted as shown in eq. (3.3):
∑𝑛𝑖=1𝑥𝑖𝜇(𝑥𝑖)
∑𝑛 𝜇(𝑥𝑖)
𝑖=1
(3.3)
where n is the number of experts, 𝜇(𝑥𝑖) is the membership value for the i-th expert evaluation 𝑥𝑖.
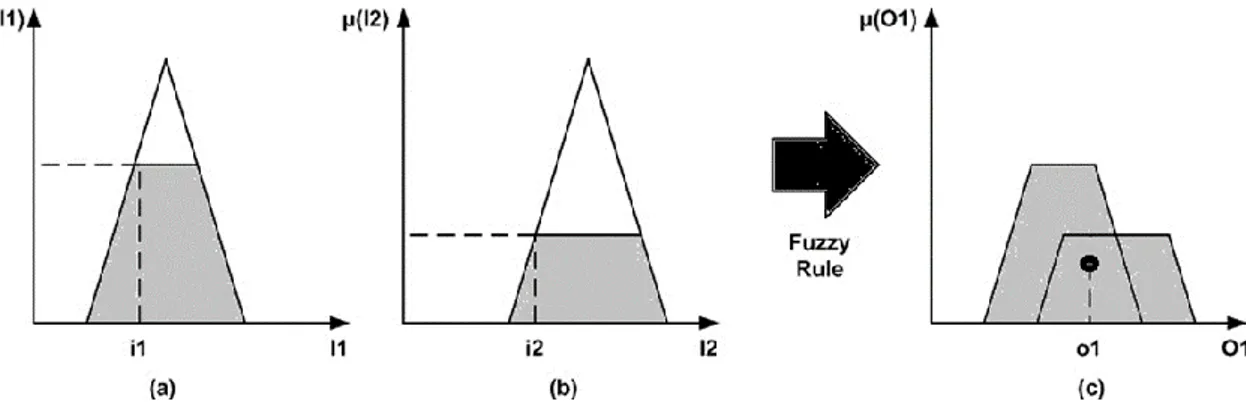
As an example, analysing Figure 3.5, it is possible to identify in (a) and (b) the fuzzified input 1 and 2 (i1 and i2). The result is the grey trapezoid
for each of them. The application of the specific fuzzy rule defines the output fuzzy set, represented in step (c), consisting in the union of the two fuzzified inputs (the grey composed shape). The black point represents the center of gravity for the designed shape and its abscissa value (o1) is the numerical
3.3.2.2 V Step: Fuzzy Cognitive Map refinement
In the following step, the “FCM refinement”, the Cognitive Modelling Group defined the relationship weight between every pair of linked concepts. The Cognitive Modelling Group was asked to explain in-depth the relationship meaning and weight between every pair of linked concepts.
This methodological approach consists in the analysis of potential conflicts between the various identified concepts and relationships by assessing the differences between the different mental models. To this end, it was intended to estimate the relative importance of semantic distance that the actors attributed to an unusual feature of the issue. The opinion expressed by the players about the significance of a specific concept is different; more likely is the emergence of conflicts concerning the information associated with that factor. The decision group has to consider the meaning and significance of each node carefully to determine any redundancy that was
presented by different experts viewing the problem domain with a different perspective and expressing the same concepts using different verbal expressions. The decision to refine the FCM, eliminating or grouping some concepts (Cole and Persichitte, 2000) should be carried out after considering each of them regarding the relevance of its removal on the map.
3.3.2.3 VI step: Hidden patterns identification
The sixth and last step, “Hidden patterns identification”, allows researchers to identify all hidden concepts concatenations inside the generated FCM. The term “hidden” is due to the involvement of different experts with different experiences to the problem in question (Kandasamy and Smarandache, 2003). Indeed, analysing the final FCM, experts have knowledge about the strength of all the considered concepts and of the domino effects among them. The Indirect and Total Effects quantify this strength.
3.4 Home Appliance Case Study
A case study for a home appliance SC has been used to illustrate the application of the proposed method in an operating context. A case study is the most appropriate tool to test the research approach object of this study since it focuses on a contemporary phenomenon within a real-life context, i.e. resilience of Supply Networks around the globe (Yin, 1981).
Table 3.2 provides a description of the SC players analyzed in this case study.
SC players Typology Location Description
Tier two supplier
Semi-finished electrical products supplier
Germany It supplies electromechanical components, which are essential for the embedded boards that the tier one suppliers #1 supplies to the manufacturer.
Tier one supplier
Finished electrical products supplier
Germany “Custom” industry electronics for home appliance, light and well-being Manufacturer Electrical appliance producer Italian company
Italian corporation that produces electrical appliance systems and related products.
Shipper Global
transportation and logistics company
Switzerland It provides sea freight and airfreight transport, contract logistics, and overland businesses with a focus on providing IT-based logistics solutions Distributor House furniture
company
Marche Region, Italy
There are kitchens and bathroom furniture among their product lines. In order to provide an “all-inclusive” product to their clients, they have to deal with upstream partners for a steady supply of household appliances.
Table 3.2: Home Appliance SC Players
3.4.1 I Step: Problem identification
As already stated earlier in this chapter, the aim of this research is to identify the connection between the various factor affecting SCR. This section will investigate a Home Appliance sector case study.
3.4.2 II Step: Literature research, factors affecting SCR
To identify the main factors affecting SCR, a literature review has been carried out. The literature search has been carried out in relevant literature databases including Emerald, Metapress, Science Direct, Scopus, and Web of Science, using these keywords: “Supply Chain”, “Resilience”, “Risk”, “Disruptions”, “Sustainable” and “Supply Uncertainties”. Subsequently, different filters helped to select relevant studies constituting the core set of articles for selecting the main concepts to include in FCMs. The filters were defined as follows:
• Ensure substantive relevance, defined as adequacy of the articles in addressing, and capturing the phenomenon under investigation, by requiring that they contain the keyword search in their title, abstract or keywords;
• Consider only English language articles;
• Remaining abstracts should be read for substantive relevance; • Remaining full articles should be read for substantive relevance;
No time limit or limit in publication type was adopted in these searches. In this study the meaning of “Factors” is general. We aim at analysing connections between different aspects. Therefore, we summarized as “Factors” sources of risk (e.g. terrorism, war), conceptualizations of SCR
(e.g. visibility, velocity,), SC practices (e.g. lean production, outsourcing) and other aspects (e.g. organizational relationships, sustainable development).
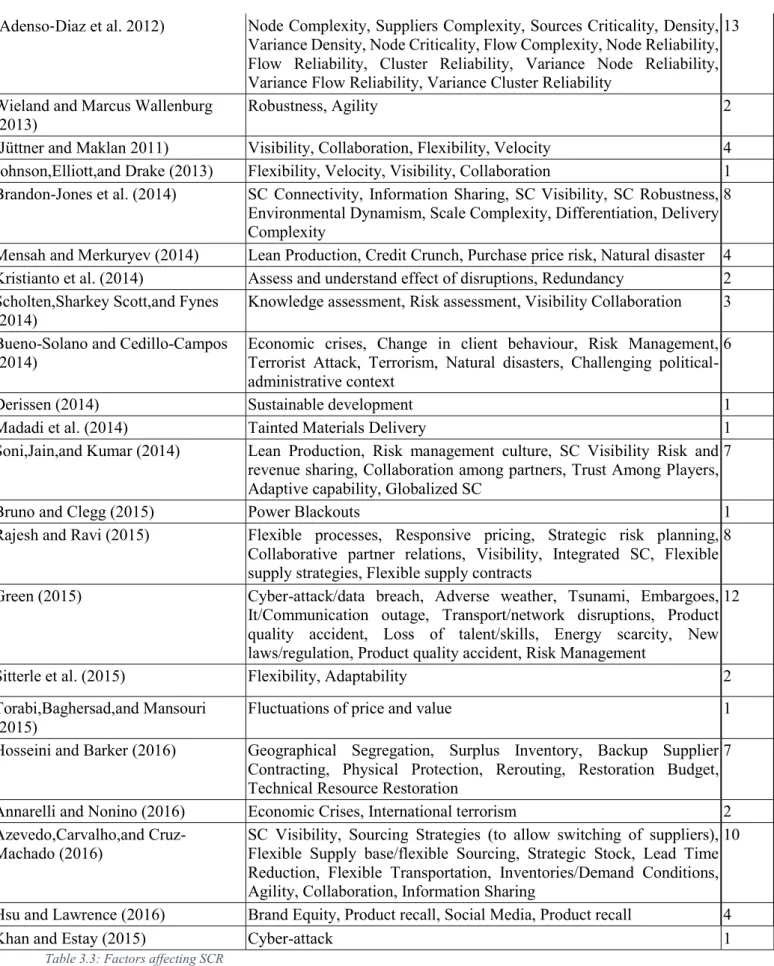
Through the application of the first two filters, 86 papers were identified, of which 39 were defined as relevant. Considering the 39 articles selected, we listed all the factors mentioned in them (see table 3.3).
Source Factors Factors
Suarez-Villa and Rama (1996) Outsourcing 1
Cooper,Lambert,and Pagh (1997) Planning and control, Information flow, Management methods, power and leadership culture
4
Suarez-Villa and Walrod (1997) Outsourcing 1
Boekholt,Patries,and Thuriaux (1999) State aid 1
Rice and Caniato (2003) Security people in leadership, BC planning, Intensive training/education, Sound strategy, Deeper relationship SC Collaboration, Organizational Capabilities, Flexibility, Redundancy
8
Bernauer and Caduff (2004) Product regulation 1
Christopher and Peck,Helen (2004) Awareness of actual/potential disturbances, SC Risk, SC risk assessment, Risk Awareness, Risk management culture, SC understanding, SC Intelligence, Information, Visibility, Collaboration, Organizational structure, Flexibility and adaptability, Redundancy
14
Perrings (2006) Sustainable development 1
Tang (2006) Economic Crises, Devaluation of currency, Marketing tactics, Risk Assessment Methods, Recovery Planning System, Terrorist Attack War, Measures applied after terrorist attack, Workforce availability constraint, Flexible Transportation Multimodal Transportation Multicarrier Transportation Multiple Routes, Global SC
10
Craighead et al. (2007) Warning capability, SC complexity 2
(Pettit et al., 2013) JIT, Insurance, Portfolio diversification, Financial reserves and liquidity, Price margin, Product differentiation, Customer loyalty/retention, Market share, Brand equity, Customer Relationships, Customer communications, Risk Management, Visibility, Collaboration, Increasing outsourcing, Theft, Terrorism/sabotage, Labour disputes, Espionage, Political Change, Regulatory Change, Accountability, Creative problem solving, Cross-training, Substitute leadership/empowerment, Learning/benchmarking, Culture of caring, Technological innovation, Part commonality, Modular product design, Multiple uses, Supplier contract flexibility, Multiple source Alternate distribution channels, Risk pooling/sharing, Multi-sourcing, Delayed commitment/Production postponement, Inventory management, Globalized SC, Centralized Distribution, Centralized Production, Specialized Factories
44
Stolker,Karydas,and Rouvroje (2008) Quick response 1
Blos et al. (2009) Debt, Theft, Property damage, Union regulation 4
Boin,Kelle,and Clay Whybark (2010) Financial Meltdown, Disaster Management, Research Planning, Terrorist Attack, Natural disaster, Infrastructural Dramas, Exploding Factories, Hostage Takings, Media, Many Actors
10
Hall,Beck,and Lengnick-Hall (2011)
Flexibility, Agility, Adaptability 3
Zhao et al. (2011) Availability, Connectivity, Accessibility 3
Scheffer et al. (2012) Domino effect 1
(Adenso‐Diaz et al. 2012) Node Complexity, Suppliers Complexity, Sources Criticality, Density, Variance Density, Node Criticality, Flow Complexity, Node Reliability, Flow Reliability, Cluster Reliability, Variance Node Reliability, Variance Flow Reliability, Variance Cluster Reliability
13
Wieland and Marcus Wallenburg (2013)
Robustness, Agility 2
(Jüttner and Maklan 2011) Visibility, Collaboration, Flexibility, Velocity 4 Johnson,Elliott,and Drake (2013) Flexibility, Velocity, Visibility, Collaboration 1 Brandon-Jones et al. (2014) SC Connectivity, Information Sharing, SC Visibility, SC Robustness,
Environmental Dynamism, Scale Complexity, Differentiation, Delivery Complexity
8
Mensah and Merkuryev (2014) Lean Production, Credit Crunch, Purchase price risk, Natural disaster 4 Kristianto et al. (2014) Assess and understand effect of disruptions, Redundancy 2 Scholten,Sharkey Scott,and Fynes
(2014)
Knowledge assessment, Risk assessment, Visibility Collaboration 3
Bueno-Solano and Cedillo-Campos
(2014) Economic crises, Change in client behaviour, Risk Management, Terrorist Attack, Terrorism, Natural disasters, Challenging political-administrative context
6
Derissen (2014) Sustainable development 1
Madadi et al. (2014) Tainted Materials Delivery 1
Soni,Jain,and Kumar (2014) Lean Production, Risk management culture, SC Visibility Risk and revenue sharing, Collaboration among partners, Trust Among Players, Adaptive capability, Globalized SC
7
Bruno and Clegg (2015) Power Blackouts 1
Rajesh and Ravi (2015) Flexible processes, Responsive pricing, Strategic risk planning, Collaborative partner relations, Visibility, Integrated SC, Flexible supply strategies, Flexible supply contracts
8
Green (2015) Cyber-attack/data breach, Adverse weather, Tsunami, Embargoes, It/Communication outage, Transport/network disruptions, Product quality accident, Loss of talent/skills, Energy scarcity, New laws/regulation, Product quality accident, Risk Management
12
Sitterle et al. (2015) Flexibility, Adaptability 2
Torabi,Baghersad,and Mansouri (2015)
Fluctuations of price and value 1
Hosseini and Barker (2016) Geographical Segregation, Surplus Inventory, Backup Supplier Contracting, Physical Protection, Rerouting, Restoration Budget, Technical Resource Restoration
7
Annarelli and Nonino (2016) Economic Crises, International terrorism 2
Azevedo,Carvalho,and Cruz-Machado (2016)
SC Visibility, Sourcing Strategies (to allow switching of suppliers), Flexible Supply base/flexible Sourcing, Strategic Stock, Lead Time Reduction, Flexible Transportation, Inventories/Demand Conditions, Agility, Collaboration, Information Sharing
10
Hsu and Lawrence (2016) Brand Equity, Product recall, Social Media, Product recall 4
Khan and Estay (2015) Cyber-attack 1
The literature review on factors affecting SCR allowed us to highlight some aspects: some factors were cited many times more than others. Risk management, for example, has been cited 9 times throughout all the papers: in fact, risk management is seen as a key factor both to prevent and mitigate SC disruptions.
Among the sources of risk, “Terrorism” is the most recurrent: this threat has been mentioned more than 10 times throughout all of the sources. Solano and Cedillo-Campos (2014) aimed, for example, to understand how disruptions produced by terrorist acts on the performance of global SC. Also, Boin et al. (2010) outlined the extreme circumstances that terrorist attacks create.
Moreover, economic crises were cited many times. This aspect, like terrorism, is a common denominator in all recent researches, due to the recent financial events that have struck the entire globe. This factor has been cited along with its direct consequences like the devaluation of currency (24 times) and fluctuations of price and value (12 times).
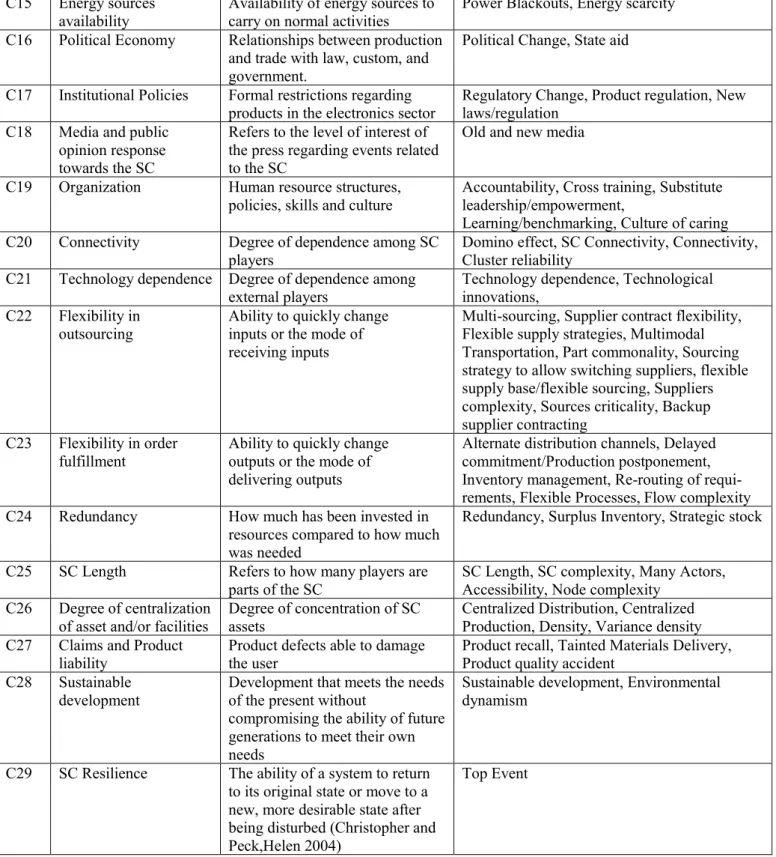
3.4.3 III Step: Taxonomy
The literature review, as highlighted in section 2, generated a massive amount of data and more than 180 factors (table 3.3) have been identified. In the “Taxonomy” step all these factors have been clustered into few concepts. In this research, the taxonomy of factors that affect SCR has been built on
extant literature (Pettit et al., 2010), then refined and validated by a Cognitive Modelling Group following the Delphi method criteria.
In this work, the group included two academics, whose research studies mainly focus on SC Management and three managers for every player of the SC (17 people for the SC analyzed in this paper). Taking into consideration the multidisciplinary competencies required for company managers to develop a cognitive map, the three managers have been selected from different company functions: SC managers, marketing managers and administrative function managers. This ad hoc panel was created to encourage communication and meetings, during which the members could contribute their knowledge and information about the processes.
The first activity of this group is to identify concepts to be included in the cognitive map. The factors list (table 3.3) has been given to the Cognitive Modelling Group. The instructions were to regroup the factors into few concepts in an efficient way. The optimal breakdown point should have been a number big enough to maintain the detail level, but small enough to make the analysis simple. The procedure was designed as a group communication process which aims to achieve a convergence of opinion on a specific issue using a series of questionnaires delivered using multiple iterations. More specifically, the feedback process allows and encourages the experts to reassess their initial judgments about the information provided in previous
iterations. Sometimes the experts changed their statements assessing the comments and feedback provided by the other Delphi panelists. Consensus has been reached after three iterations of Delphi analysis with the identification of 29 concepts (table 3.4).A “top event” is described as a single event that is influenced by all other events. In this case, the top event is the concept “SC Resilience” (C29).
C1 Operation Management
strategies All practices connected to Lean Production and Agility JIT, Lean Production, Agility, Lead Time Reduction C2 External Financial Risk Risks linked to the financial
sector in which the SC operates Credit Crunch, Purchase price risk, Devaluation of currency, Economic Crises, Financial Meltdown, Risk pooling/sharing
C3 Internal Financial Risk Risks linked to the financial
situation of the enterprises. Debt and lack of Insurance, Portfolio diversification, Financial reserves and liquidity, Price margin
C4 Market Volatility Uncertainties linked to market
developments Fluctuations of price and value, change in client behaviour C5 Market Position Place that the brand occupies in
the mind of the customer and how it is distinguished from
competitors’ products
Product differentiation, Differentiation, Customer loyalty/retention, Market share, Brand equity, Customer relationships,
Customer communications, Responsive pricing C6 Risk Management
culture All of the risk management branches developed by the company: prevention techniques, risk evaluation, reduction of action plans to face sudden disturbances
Risk management culture, Strategic risk planning, Risk Assessment Methods, Recovery Planning System, Disaster Management, Research Planning, Security people in leadership, BC planning, Intensive
training/education, Knowledge assessment, Risk assessment
C7 SC Visibility The ability of parts, components or products in transit to be tracked from the manufacturer to their destination
SC Visibility, Collaboration among partners, Trust Among Players Collaborative partner relations, Visibility SC, Communication, Cooperation, Relationship with suppliers, SC understanding, SC Intelligence, Information, Visibility, Collaboration, Warning capability, Deeper relationship, Information flow, Geographical Segregation, Creating total SC visibility, Developing visibility to clear view of own stream inventory and demand conditions C8 SC Vertical Integration
Degree A SC is vertically integrated when all activities from the raw material to the finished products are carried out by the same company.
Integrated SCs, Integration
C9 Deliberate threats Intentional attacks aimed at disrupting operations or causing human or financial harm
Theft, Terrorism/sabotage, Espionage, Cyber-attack/data breach
C10 Natural phenomena An environmental danger to which risk of damage to people or things is associated
Natural disasters: earthquakes, flooding, tsunami, adverse weather
C11 Government restrictions National policies that apply to all
sectors of free trade Regulatory state, Embargoes, Environmental law C12 Loss of infrastructure
and/or connection Physical loss of infrastructures: productive plants, physical connections (roads),
telecommunications
Property damage, Infrastructural Dramas, It/Communication outage, Transport/network disruptions, Physical protection
C13 Materials flow
interruption Interruption of the normal flux of materials or final products Interruption of raw materials and products delivery, Product recall, Tainted Materials Delivery, Product quality accident
C14 Manpower availability Availability of human resources to carry on normal activities inside the SC
Manpower availability, Labour Disputes, Union regulation, Workforce availability constraint, Hostage Takings, Strikes, Loss of talent/skills, Technical resource restoration