Connectivity Induced by Brain Stimulation in
Non-Demented Elders
Cleofe´ Pen˜a-Gomez1, Cristina Sole´-Padulle´s2, Imma C. Clemente1,3, Carme Junque´1,4, Nu´ria Bargallo´4,5, Beatriz Bosch2,4, Jose´ Luis Molinuevo2,4, Josep Valls-Sole´6, Alvaro Pascual-Leone7, David Bartre´s-Faz1,3*
1 Department de Psiquiatria i Psicobiologia Clinica, Universitat de Barcelona, Barcelona, Catalonia, Spain, 2 Unitat d’Alzheimer i altres trastorns cognitius, Servei de Neurologia, Hospital Clinic de Barcelona, Barcelona, Catalonia, Spain,3 Institut de Recerca en Cervell, Cognicio´ i Conducta, Barcelona, Catalonia, Spain, 4 Institut d’Investigacions Biome`diques August Pi i Sunyer, Barcelona, Catalonia, Spain,5 Seccio´ de Neuroradiologia, Servei de Radiologia, Centre de Diagno`stic per la Imatge, Barcelona, Catalonia, Spain,6 Laboratori d’Exploracions Neurofuncionals, Servei de Neurologia, Hospital Clı´nic de Barcelona, Barcelona, Catalonia, Spain, 7 Berenson-Allen Center for Noninvasive Brain Stimulation, Beth Israel Deaconess Medical Center and Harvard Medical School, Boston, Massachusetts, United States of America
Abstract
Behavioral consequences of a brain insult represent an interaction between the injury and the capacity of the rest of the brain to adapt to it. We provide experimental support for the notion that genetic factors play a critical role in such adaptation. We induced a controlled brain disruption using repetitive transcranial magnetic stimulation (rTMS) and show that APOE status determines its impact on distributed brain networks as assessed by functional MRI (fMRI).Twenty non-demented elders exhibiting mild memory dysfunction underwent two fMRI studies during face-name encoding tasks (before and after rTMS). Baseline task performance was associated with activation of a network of brain regions in prefrontal, parietal, medial temporal and visual associative areas. APOE e4 bearers exhibited this pattern in two separate independent components, whereas e4-non carriers presented a single partially overlapping network. Following rTMS all subjects showed slight ameliorations in memory performance, regardless of APOE status. However, after rTMS APOE e4-carriers showed significant changes in brain network activation, expressing strikingly similar spatial configuration as the one observed in the non-carrier group prior to stimulation. Similarly, activity in areas of the default-mode network (DMN) was found in a single component among the e4-non bearers, whereas among carriers it appeared disaggregated in three distinct spatiotemporal components that changed to an integrated single component after rTMS. Our findings demonstrate that genetic background play a fundamental role in the brain responses to focal insults, conditioning expression of distinct brain networks to sustain similar cognitive performance.
Citation: Pen˜a-Gomez C, Sole´-Padulle´s C, Clemente IC, Junque´ C, Bargallo´ N, et al. (2012) APOE Status Modulates the Changes in Network Connectivity Induced by Brain Stimulation in Non-Demented Elders. PLoS ONE 7(12): e51833. doi:10.1371/journal.pone.0051833
Editor: Hugo Theoret, University of Montreal, Canada
Received August 2, 2012; Accepted November 13, 2012; Published December 19, 2012
Copyright: ß 2012 Pen˜a-Gomez et al. This is an open-access article distributed under the terms of the Creative Commons Attribution License, which permits unrestricted use, distribution, and reproduction in any medium, provided the original author and source are credited.
Funding: Partially funded by a Spanish Ministerio de Educacio´n y Ciencia research project award (SAF2007-66270) and the Spanish Ministerio de Ciencia e Innovacio´n (SAF2009-07489) to DB-F and fundings from the Generalitat de Catalunya to the Neuropsychology Research Group (2009SGR941). CP-G was funded by a Ajuts al Personal Investigador en Formacio´ APIF-UB grant from the University of Barcelona. JLM was funded through a CONSOLIDER-Ingenio program 2010: CSD2010-00045). APL was supported in part by grants from the National Institutes of Health (K24 RR018875, RO1-NS 20068, R01-EB 005047), and Grant Number UL1 RR025758- Harvard Clinical and Translational Science Center, from the National Center for Research Resources. The funders had no role in study design, data colllection and analysis, decision to publish, or preparation of the manuscript.
Competing Interests: The authors have declared that no competing interests exist. * E-mail: [email protected]
Introduction
A growing body of evidence from neuropsychological, neuro-physiological, and neuroimaging studies in animals and humans suggests that interactions between brain regions engaged in functional networks underlie cognitive processing and determine behavior [1,2]. Every cognitive function and goal-directed behavior may be best identified with a certain pattern of activation of specific, spatially-distributed, but interconnected, neuronal assemblies in a particular time window and temporal order [3]. Defining network interactions is critical to understanding normal cognition and the pathophysiology of its decline [4–6].
Following a focal brain insult (e.g. following a stroke), or as a consequence of the alteration of function in a specific brain region (for example due to a sustained change in afferent input or efferent
demand), the affected neural network adapts fluidly. This dynamic, neural plasticity can confer no perceptible change in the behavioral output of the brain, lead to changes demonstrated only under special testing conditions, or cause behavioral changes that may constitute symptoms of disease or represent paradoxical functional facilitations [7,8].
Transcranial magnetic stimulation (TMS) provides a non-invasive technique to transiently disrupt the function of a given cortical target thus creating a temporary, ‘‘virtual brain lesion’’ [9,10]. In combination with functional neuroimaging techniques, TMS provides an opportunity to study the mechanisms of dynamic network plasticity [7,11]. TMS can be applied in trains of variable frequency and intensity to modulate the activity of a given cortical area, increase or decrease it transiently, while the subject performs a given behavior, and the brain activity
associated with such behavioral activation can be measured using techniques such as functional magnetic resonance imaging (fMRI; [12]).
Genetic factors appear to critically influence network interac-tions and thus are likely critical contributors to the dynamic neural plasticity that allows the brain to adapt to focal disruptions [11]. While a myriad of behavioral tests may report a single, final measurement summarizing the complex interactive processes between cognition and genes, neuroimaging techniques (PET, MR, MRS, fMRI) allow us to examine more closely and immediately the biologic effects of genetic alterations [13]. Meyer-Lindenberg [14] and Rasseti & Weinberger [15] have pointed out that measures derived from brain images, in principle are closer to the underlying biology of gene action, offering an alternative target for genetic searches, by serving as intermediate phenotypes or endophenotypes. In this case, neuroimaging studies can evaluate the functional adaptation of brain activity to the controlled modulation of activity in an element of a neural network.
The apolipoprotein E (APOE) e4 allele is the major genetic risk factor for Alzheimer’s disease [16], but mounting evidence indicates that it also conditions cognitive function and brain integrity in humans across the lifespan (reviewed in [17]). Functional neuroimaging studies during cognitive tasks have revealed particular patterns of cortical activity, either in the form of decreases, increases or combination of both, among non-demented elders carrying this allele as compared with those without it [18]. These differential activation patterns have sometimes been interpreted as compensatory, particularly when similar cognitive performances can be observed among genetic subgroups, though sometimes they appear related to suboptimal cognitive function in e4 carriers [19–24]. Importantly, APOE status has recently been shown to modulate large-scale networks as identified by the analysis of low-frequency fMRI-BOLD fluctua-tions. Particularly, the activity of the so called default mode network (DMN), often affected in clinical and preclinical AD [25,26], appears already compromised in non-demented elders carrying this allele during memory encoding tasks by virtue of failures to deactivate posteromedial regions [27–29].
The aim of the present study was to investigate whether the genetic background for APOE status differentially modulates the brain response to the induced effects of rTMS on functional large-scale networks, and to determine the relation to behavioral changes and underlying gray matter integrity. To our knowledge this is the first study combining rTMS and fMRI to demonstrate that individual differences in a relevant human genetic variant among the elder determine brain response to focal brain disruption.
Methods Subjects
Twenty subjects older than 50 years (mean age: 66.95, SD: 9.42; female: 15: see below table 1) were recruited from a primary health center (CAP Castellar del Valle`s) and the Alzheimer’s Disease and Related Disorders Unit at the Hospital Clinic de Barcelona. Despite the fact that all subjects complained of memory problems, they all were free of dementia and depression according to clinical and neuropsychological assessments. Dementia was ruled out using a clinical and neuropsychological examination including measures of global cognitive function (MMSE $24), language (Token test), praxis (imitation and performance to command), gnosis (Poppel-reuter’s embedded figures and Luria’s watches) and abstract reasoning (WAIS III Similarities subtest). Depression was ruled out
through a Hamilton Depression Scale cut-off score of 15. Included cases were restricted to those exhibiting impairments in memory domain since all of them scored 21 SD below standardized age-matched norms in at least one of the following memory tests: Rey Auditory Verbal Learning Test (RAVLT) and Visual Reproduc-tion of the Wechsler Memory Scale Revised (WMS-R). The Ethics Comitee of the Hospital Clinic de Barcelona, Spain, approved this study and all subjects gave their written informed consent to participate.
Apolipoprotein E
Genomic DNA was isolated from peripheral blood leukocytes. At the APOE locus, the polymorphism of the three common genetic variants, e2, e3 and e4, due to Cys-Arg substitutions at amino acid positions 112 and 158 was analyzed. The polymerase chain reaction was used to amplify the alleles of the APOE gene as described elsewhere [30]. In our twenty subjects, 9 were carriers of the e4 variant (6 e3/e4, 2 e2/e4 and 1 e4/e4) and 11 were noncarriers (10 e3/e3 and 1 e2/e3).
MRI acquisition, baseline fMRI session and memory encoding assessment
All scans were obtained on a GE Signa 1.5T (General Electric, Milwaukee, WI). High-resolution T1-weighted images were acquired for anatomical identification with a FSPGR three-dimensional sequence (DICOM format, TR/TE = 12/5.2; TI 300 1 nex; FOV = 24624 cm; 2566256 matrix). Whole-brain volumes were acquired in an axial plane yielding contiguous slices with slice thickness of 1 mm. Functional images were acquired using a T2* weighted gradient-echo planar imaging (TR = 2000 ms; TE = 40 ms; FOV = 24624 cm; flip angle of 90u). Twenty axial slices were obtained for each brain volume with a slice thickness of 5 mm and a gap of 1.5 mm.
For fMRI, we used a block design with alternating rest and experimental conditions (five blocks each). The task required encoding and learning of visually-presented face-name pairs. Before the fMRI session, subjects learned 2 face-name pairs, which were used later as control stimuli (control condition). During the experimental condition subjects were presented 10 new face-name pairs to be learnt during the scanning. The duration of each stimulus (face-name pair) was 2 s and the inter-stimuli period was 1 s. The whole experiment lasted approximately 300 s (30 s per block, 150 s for each condition). Following the fMRI session participants were assessed for recognition memory of the 10 face-name pairs learnt. For this purpose, individuals were shown 10 printed photographs as well as 10 written names and were instructed to pair each name with the corresponding face as they remembered from the fMRI session. Only the stimuli used in the experimental blocks were presented during the associative memory task, and thus, only correct/incorrect face–name matches were recorded as responses. The maximum score for this task was 10 (all names correctly matched with the corresponding face).
rTMS
rTMS was applied between a first and second fMRI examina-tion. A MAGSTIM SUPERH stimulator and a double-cone coil were used. The intensity of TMS pulses was set at 80% of the individual’s motor threshold with the intersection of the double-cone coil positioned over the left primary motor cortex. For prefrontal cortex stimulation, the TMS coil was moved anteriorly approximately 5 cm and centered in the vertex (interhemispheric fissure) to affect prefrontal cortex bilaterally. Ten rTMS trains lasting 10 s each were delivered during a 5-minute period using a
frequency of 5 Hz (total number of pulses 5000). Specifically, every 30 s, subjects were given 10 s of rTMS followed by a 20 s rest period. Previously we showed that in this form, active rTMS exerts significant effects both at the cognitive and brain activity levels, whereas sham rTMS does not result in any observable effects [31]. Therefore, in the present study all 20 individuals received active rTMS and group comparisons were based on the analysis of brain networks expression on the basis of the APOE status.
Second fMRI session and memory assessment
Immediately after the rTMS, subjects underwent a second fMRI examination. The average time elapsed between the end of the first and the beginning of the second fMRI was 9.99 min61.99 (SD). We used an equivalent 10 face-name pairs learning task that was counter-balanced with the one administered during the first fMRI session. Once the scanning procedure was finished, participants were tested for memory recognition as in the baseline fMRI session.
Statistical analyses of non-imaging data
Demographic and cognitive data analysis was implemented in SPSS v.14. Chi-squared test was used to compare gender distribution between groups (APOE e4 carriers versus noncar-riers). For continuous variables, assumptions for normality and homocedasticity were tested for all cognitive and demographic variables. Considering these observations, all comparisons were performed using parametric tests (Student’s t test and ANOVA) except those concerning the years of education variable for comparing both genetic subgroups that were achieved using the U Mann-Whitney test. All tests were two-tailed and statistical significance was set at p,0.05. A two-way ANOVA was undertaken to examine whether rTMS exerted a distinct effect between genetic subgroups across the two memory examinations using genetic subgroup as the between-subject factor and moment of the memory evaluation (first or second fMRI) as within-subject factor.
fMRI-ICA analysis-strength of activity and network correlation analyses
In order to investigate the differences within and between groups in the strength of activation corresponding to the encoding phase in the fMRI-task we performed a group tensor-ICA (T-ICA) merging all the sessions (pre and after rTMS) and groups (e4-carriers and non(e4-carriers). The group T-ICA allows the determi-nation of the brain areas (networks) common to all subjects for
later group comparison. Image preprocessing and T-ICA analyses were performed using MELODIC [32] version 3.10, implemented in FSL software (http://www.fmrib.ox.ac.uk/fsl/). The prepro-cessing steps included motion correction, skull stripping, spatial normalization to the Montreal Neurological Institute (MNI) template (resampling voxel size = 3 mm63 mm63 mm), spatial smoothing (FWHM = 6 mm), and grand-mean scaling. Functional data was temporally band-pass filtered using a high pass filter of 60 s to reduce the possible physiologic noise. Moreover, the possible nuisance on the data induced by movements inside the scanner was regressed out. Finally, a tensor-ICA decomposition of the preprocessed images was performed.
The brain maps (networks) corresponding to the activation-encoding period and deactivation-rest period were used for network correlation analysis and cortical thickness analysis (explained in detail below). Concerning the network correlation analyses, the mean BOLD-time series corresponding with the brain areas activated during the encoding phase as well as those activated during the rest phase were extracted and correlated for each subject. This procedure resulted in r-Pearson values between the time course of activation and deactivation periods examined across sessions (pre/post rTMS) and groups (APOE e allele carriers/noncarriers). The Pearson correlation values were trans-formed to z-scores (using Fisher z-transform) and then averaged over all subjects for later statistical group comparison. Concretely, a paired t test was performed for each group to test the possible correlation changes occurred after administering rTMS.
fMRI-ICA analysis-Spatial pattern correlation analyses
We investigated quantitatively and qualitatively the changes in the spatial patterns of the networks after stimulation. Regarding the quantitative analyses the comparisons amongst these networks were done using ICA and the spatial pattern correlations implemented both in the GIFT software ([33]; http://icatb. sourceforge.net/). After image preprocessing steps were complet-ed, we performed the group spatial ICA.
First, we performed one group spatial ICA for each fMRI session (pre/post TMS) and group (e4 carrriers/noncarriers), resulting in 4 independent group spatial ICA comparisons. Specifically, after subject-wise data concatenations, ICA was performed in three stages: i) using a principal component analysis (PCA) we performed a data reduction (2 steps) of each subject’s fMRI data to the number of components previously estimated by the minimum description length (MDL) criterion [34]; ii) application of ICA algorithm (infomax); and iii) back reconstruc-tion for each individual subject’s data generating time courses and spatial maps [33]. The degree of correlation of a given voxel’s Table 1. Demographic and global cognitive characteristics of the participants.
e4 carriers e4 noncarriers Statistical values P values
Age 66.77 (9.67) 67.09 (9.68) t = 0.07 0.93
Years of formal education 6.11 (3.48) 7.45 (2.80) U = 38.5 0.41
MMSE 26.33 (2.34) 26.63 (1.91) t = 0.31 0.75
Gender (M/W) (6/3) (9/2) x2
= 0.61 0.15
Inferred IQ (Vocabulary WAIS-III) 50.89 (8.95) 51 (10.89) t = 0.02 0.98
Verbal Memory (RALVT) 7.73 (2.28) 6.25 (3.89) t = 1.04 0.31
Visual Memory (VR-WMS-R) 10.88 (5.51) 10.33 (7.23) t = 0.16 0.88
Note: Values are given in mean (SD). MMSEa, mini-mental state examination. (M/W) M, male; W, women. WAIS: Wechsler Adult Intelligence Scale. RAVLT: Rey-Auditory Verbal Learning test (delayed recall). VR-WMS-R: Visual Reproduction, Wechsler Memory Scale Revised (delayed recall). t = Student’s test. U = U-Mann Whitney test. doi:10.1371/journal.pone.0051833.t001
fMRI signal with the time course of the component was represented by the Z score within the spatial map [35].
Second, we performed a temporal correlation analysis (TCA) between those networks that had a significant correlation with the encoding and rest conditions, respectively. Moreover, in the former condition we only considered those networks that exhibited a significant positive correlation between the performance and the beta weights of each subject extracted from the networks synchronized with encoding phase (given by TCA). Beta weight accounts for the particular contribution of each subject (weight) in the group correlation value obtained by TCA. This procedure was done in order to assure that the networks taken into consideration were informative and significant for the encoding phase as well as for performance. Finally, we were able to perform spatial pattern correlations amongst the selected networks.
MRI analysis of cortical thickness and volumetric segmentation procedures
To investigate whether putative distinct functional brain responses to rTMS observed between APOE groups were related to underlying gray mater atrophy we used the IC (thresholded at z = 2.3) corresponding to active areas when subjects were encoding new faces to create a binary mask for subsequent cortical thickness analysis. This binary mask was mapped for each of the subjects in order to extract the cortical thickness and grey matter volume of each hemisphere. With this procedure we assured that the areas of comparison related with the activity were the same for all the subjects. These values were used for further comparison between groups. Additionally, we also performed a whole brain analysis of the entire cortical mantle, in order to evaluate possible effects of cortical atrophy on cortical networks.
To carry out cortical thickness analysis we used Freesurfer version 5.0 software (http://surfer.nmr.mgh.harvard.edu/). Tech-nical details of the procedures to obtain the CTh maps for posterior analysis have been previously and fully described elsewhere [36]. The procedures for the measurement of CTh have been validated against histological analyses [37] and manual measurements [38]. Freesurfer morphometric procedures show good test-retest reliability across scanner manufacturers and field strengths [39].
We smoothed the reconstructed and registered individual CTh maps of complete cortical models with a surface-based Gaussian kernel of 10 mm full width at half maximum (FWHM). Comparison analyses between e4 carriers and noncarrier groups were based on vertex-by-vertex general linear modeling (GLM) of the CTh, with gender and age introduced as nuisance factors. We used Monte Carlo simulation (10.000 repetitions) to calculate cluster-wise statistical significances corrected for multiple compar-isons.
Additionally, we performed ANCOVA on hippocampus volume measurements extracted from Freesurfer comparing e4 carriers and noncarriers, with covariates of gender and age as possible confounding factors. We corrected the hippocampus volume using a previously validated estimate of the total intracranial volume (eTIV) [40].
Results
Group comparisons and behavioral effects of rTMS
APOE e4-carriers and noncarrier groups were comparable in terms of age, gender distribution, years of formal education and cognitive status, including verbal and visual memory assessments (see table 1). Consistent with our previous report [31], we observed an improvement of recognition memory scores during the second
fMRI, following rTMS for the whole sample. Specifically, when we tested for the interaction of group (APOE status) x time of evaluation of memory performance (pre or after rTMS), it was not significant, suggesting similar memory changes across genetic subgroups (table 2).
Common fMRI networks across sessions and groups
The T-ICA analysis identified a network that was significantly (p,0.01) related to the encoding of new faces across sessions (pre/ post rTMS) and groups (e4 carriers/non-carriers). In figure 1, the areas belonging to this network, and active during the encoding period, are depicted in red, while the areas active in the repeated faces blocks (control condition) are shown in blue. The main regions active during encoding in both groups comprise primary visual and associative regions, temporoparietal areas including the fusiform gyrus, the parahippocampus and the hippocampus, as well as motor, premotor and prefrontal areas. On the other hand the areas showing greater activity during repeated stimuli (i.e. or deactivated during encoding of novel information) align with the anatomical descriptions of the DMN, mainly including anterior and posterior midline structures as well as the inferior parietal cortex.
APOE had a small effect on overall activity level. The analysis revealed only a significant differential activity (p,0.05) between sessions (pre-post) in the e4 noncarriers group, where higher activity was observed in the second fMRI examination, after TMS administration.
The e4-noncarrier group exhibited a more pronounced pattern of anticorrelation between the time series of activation and deactivation areas at baseline (zPRE-RTMS= 0.09 vs z PRE-RTMS= 20.05, for e4 carriers and noncarriers, respectively).
However, this difference did not reach statistical significance (p = 0.57). Similarly, paired t-test analysis for each group did not revealed any significant change, though both groups showed increased anticorrelation after rTMS (zPOST-RTMS= 20.02, for
e4-carriers; zPOST-RTMS= 20.11, for noncarriers). Group x session activation of performance-related patterns differences
Figure 2 and table 3 depict different sets of independent components that were significantly correlated with the blocks of encoding of new face-name pairs, as well as with subsequent memory performance in each genetic subgroup.
Regarding the pre-TMS condition, e4 bearers exhibited two components, which encompassed mainly the fusiform gyrus and visual areas 2 in table 3) as well as bilateral frontal areas (IC-10). In contrast, e4-non carriers only presented one single component (IC-10) which mainly included frontoparietal and fusiform areas.
Following rTMS among e4-carriers a new frontoparietal component emerged (IC-16), whereas the fusiform gyrus compo-nent (IC-7) was still observed after stimulation, albeit more active than at baseline (IC-2). Therefore, among e4 carriers the brain network IC-16 exhibited a significant correlation with task performance after brain stimulation showing strikingly similar spatial configuration as the one observed in the non-carrier group prior to stimulation (see figure 2 and table 3).
On the other hand, in the e4-non carrier group, after TMS a similar topographical and unique component as before stimulation could be identified (IC-12) albeit in this case it showed a decrease of brain activity in the DLPFC and an increase in visual associative regions such as the fusiform gyrus, lingual gyrus, and visual areas was significantly associated with task time course and performance (see figure 2 and table 3).
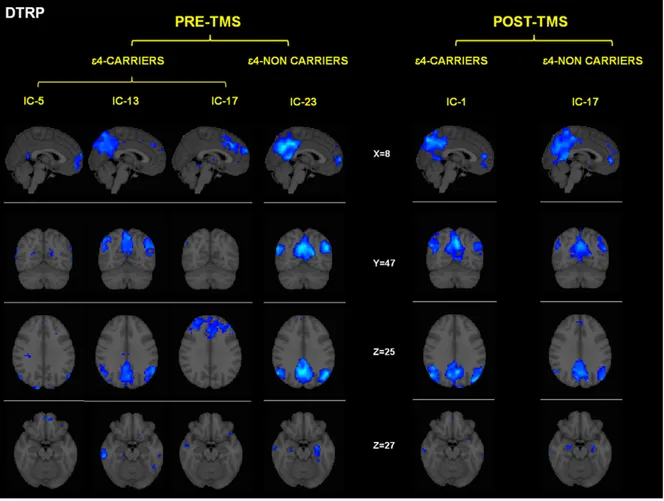
Group x session differences in deactivation task-related patterns
The functional networks that showed a significant correlation between their temporal fluctuation and the condition where no learning occurred (i.e. ‘control condition’) are depicted in figure 3. It is important to note here, that all these areas showed decreased activity during the encoding phase and consequently might be interpreted as patterns of deactivation. In both genetic groups the common spatial pattern is similar, encompassing midline frontal, precuneus and lateral inferior parietal (see table 4). These brain regions have close anatomical correspondence with the well-characterized default-mode network (DMN) [41,42].
Despite similar topographic patterns, there were however relevant differences between the genetic groups in the deactivation patterns, as APOE e4-carriers exhibited three separate indepen-dent components (IC-5, IC-13, IC-17 in table 4), while among noncarriers a single component was present (IC-23, see figure 3 and table 4).
The administration of rTMS had no observable effect on the number and general characteristics of the deactivation compo-nents among the e4-noncarrier group, whereas in the e4-carriers the numbers of components were reduced and integrated into a single component 17) after stimulation. This component (IC-17) was highly similar (spatial correlation = 0.5) to the component observed before and after rTMS among e4-noncarriers. Despite both groups showed deactivations within areas of the
parahippo-campal formation, deactivation of the proper hippocampus within the e4-noncarrier group was observed both pre and post rTMS, whereas it was not present among the e4-carriers at any of the timepoints.
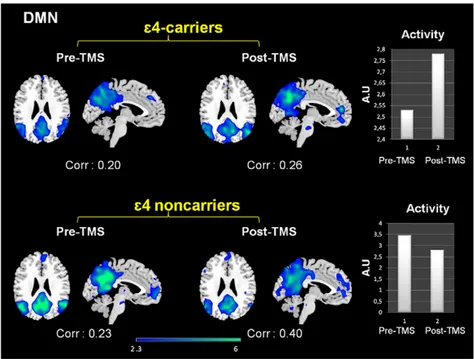
When looking at the intensity of deactivation by performing cross correlations between each network and a template of DMN (provided within the GIFT software), it was evident that among e4-noncarriers the intensity of expression of the DMN was decreased subsequently to brain stimulation, whereas it was increased for APOE e4 carriers. These results reflect enhanced connectivity between the components of the DMN areas after TMS in this group (see figure 4).
Cortical thickness and morphology analysis
APOE e4-carriers exhibited reduced CTh in different areas of the right hemisphere (see table S1). However, the cortical thickness comparison of the ROIs corresponding to the functional activation of left and right hemispheres (figure S1) revealed no differences between genetic groups. When comparing differences in hemi-spheric gray and white matter volumes as well as the hippocam-pus, e4-carriers showed reduced volumes and increased CSF spaces, but differences did not reach statistical significance (tables S2 and S3). Altogether these observations suggest that differences in cortical or subcortical anatomy cannot account for the particular functional activity and connectivity differences observed in the present study between genetic subgroups.
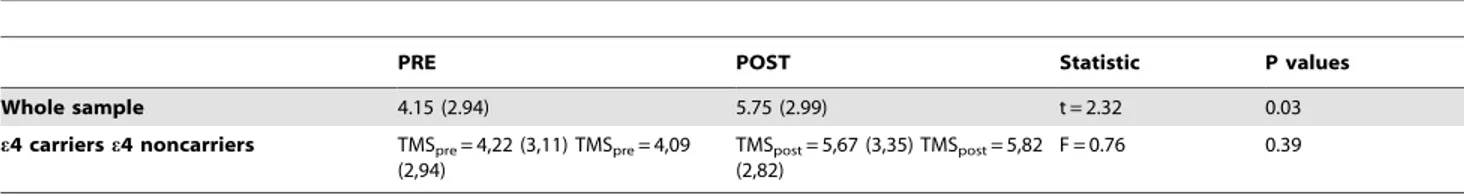
Table 2. Measures of recognition memory before (pre) and after (post) rTMS.
PRE POST Statistic P values
Whole sample 4.15 (2.94) 5.75 (2.99) t = 2.32 0.03
e4 carriers e4 noncarriers TMSpre= 4,22 (3,11) TMSpre= 4,09 (2,94)
TMSpost= 5,67 (3,35) TMSpost= 5,82 (2,82)
F = 0.76 0.39
Values are given in mean (ranges). t = repeated measures t test comparing pre vs post rTMS in the whole sample. F = results of the interaction value of the two-factor ANOVA using genetic subgroup as the between subject factor and moment of the evaluation (PRE vs POST) as within subject factor.
doi:10.1371/journal.pone.0051833.t002
Figure 1. Independent components (IC, networks) that were highly correlated with the encoding period and performance (ATBRP = activation-task brain related pattern). Networks are separated for each condition (pre-post TMS) and group (e4 carriers-noncarriers). Coordinates are given in MNI space. Intensity values are thresholded at z = 2.3. Brain areas of each network are fully described in table 3. doi:10.1371/journal.pone.0051833.g001
Figure 2. Independent components (networks) that were significantly correlated with the deactivation period (DTBRP = deactiva-tion-task brain related pattern). Networks are separated for each condition (pre-post TMS) and group (e4 carriers-noncarriers). DTRP = Dectivation Task Related Patterns. Coordinates are given in MNI space. Intensity values are thresholded at z = 2.3. Brain areas of each network are fully described in table 4.
doi:10.1371/journal.pone.0051833.g002
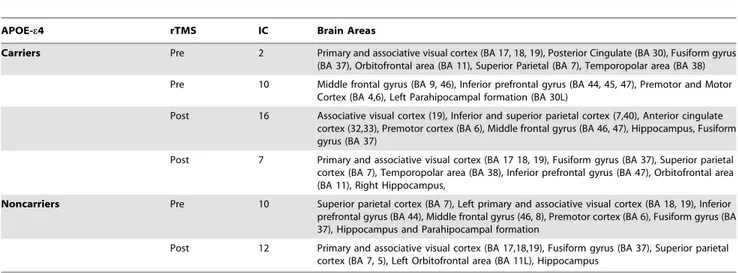
Table 3. Brain Networks related with encoding and subsequent memory performance.
APOE-e4 rTMS IC Brain Areas
Carriers Pre 2 Primary and associative visual cortex (BA 17, 18, 19), Posterior Cingulate (BA 30), Fusiform gyrus (BA 37), Orbitofrontal area (BA 11), Superior Parietal (BA 7), Temporopolar area (BA 38) Pre 10 Middle frontal gyrus (BA 9, 46), Inferior prefrontal gyrus (BA 44, 45, 47), Premotor and Motor
Cortex (BA 4,6), Left Parahipocampal formation (BA 30L)
Post 16 Associative visual cortex (19), Inferior and superior parietal cortex (7,40), Anterior cingulate cortex (32,33), Premotor cortex (BA 6), Middle frontal gyrus (BA 46, 47), Hippocampus, Fusiform gyrus (BA 37)
Post 7 Primary and associative visual cortex (BA 17 18, 19), Fusiform gyrus (BA 37), Superior parietal cortex (BA 7), Temporopolar area (BA 38), Inferior prefrontal gyrus (BA 47), Orbitofrontal area (BA 11), Right Hippocampus,
Noncarriers Pre 10 Superior parietal cortex (BA 7), Left primary and associative visual cortex (BA 18, 19), Inferior prefrontal gyrus (BA 44), Middle frontal gyrus (46, 8), Premotor cortex (BA 6), Fusiform gyrus (BA 37), Hippocampus and Parahipocampal formation
Post 12 Primary and associative visual cortex (BA 17,18,19), Fusiform gyrus (BA 37), Superior parietal cortex (BA 7, 5), Left Orbitofrontal area (BA 11L), Hippocampus
Figure 3. Effects of rTMS in the DMN present in deactivation task-related networks. While both groups exhibited increased temporal correlations between the timecourse of this network and rest condition after rTMS, its activity (intensity of the expression) clearly diverged. In the bar graphs it is shown that DMN activity decreased for e4 non-carriers whereas increased for the e4-carriers. Corr: Correlation values (r-Pearson) between the timecourse of each network and the ‘resting condition’. Intensity values are thresholded at z = 2.3. Coordinates are given in MNI (x = 24, z = 26). A.U = arbitrary units.
doi:10.1371/journal.pone.0051833.g003
Table 4. Brain Networks related with deactivation.
APO-e4 rTMS IC Brain Areas
Carriers Pre 5 Anterior prefrontal cortex (BA 10), Orbitofrontal cortex (BA 11), Inferior prefrontal gyrus (BA 47), Retrosplenial cingulate cortex (BA 26, 29), dorsal anterior cingulated cortex (BA 32), Primary and secondary visual cortex (BA 17 18), Angular gyrus (BA 39).
Pre 13 Inferior and superior parietal cortex (BA 39, 40, 5, 7), Secondary visual areas (BA 18), Posterior and anterior cingulate cortex (BA 30, 23, 32), Middle temporal gyrus (BA 21), Anterior prefrontal cortex (BA 10), Precuneus, Left Parahippocampal
Pre 17 Anterior prefrontal cortex (BA 10), Dorsal anterior cingulate (BA 32), Middle prefrontal cortex (BA 9, 46), Angular gyrus (BA 39)
Post 1 Inferior and superior parietal cortex (BA 39,40,5,7), Primary and secondary visual cortex (BA 17,18), Posterior and anterior cingulate cortex (BA 23, 30, 32), Retroesplenial cortex (BA 29), Fusiform gyrus (BA 37), Middle and inferior temporal gyrus (BA 20, 21), Anterior prefrontal cortex (BA 10), Parahippocampal Formation, Precuneus,
Noncarriers Pre 23 Inferior and superior parietal cortex (BA 39,40,7,5), Primary and secondary visual cortex (BA 17,18), Posterior and anterior cingulate cortex (BA 23,30,32), Retroesplenial cortex (BA 29), Precuneus, Fusiform gyrus (BA 37), Middle temporal gyrus (BA 21), Anterior prefrontal cortex (BA 10), Hippocampus, Parahippocampal formation,
Post 17 Inferior and superior parietal cortex (BA 39,40,7,5), Primary and secondary visual cortex (BA 18), Posterior and anterior cingulate cortex (23,30,32), Retroesplenial cortex (BA 29), Precuneus, Fusiform gyrus (BA 37), Middle temporal gyrus (BA 21), Anterior prefrontal cortex (BA 10), Hippocampus, Parahipocampal formation,
Discussion
The main finding of the present study is that APOE status, the most relevant genetic factor associated with Alzheimer’s disease and age-related cognitive decline, differentially modulates the cerebral responses to brain stimulation during a memory encoding task, even if no differences could be observed at a cognitive level at any stage between genetic subgroups. To our knowledge present results offer first evidence demonstrating the influence of genetic factors onto the brain adaptive mechanisms to focal brain disruption as measured by functional neuroimaging.
Previous reports have been published demonstrating that the effects of rTMS can be affected by phenotypic differences associated with genetic variations causative of several neurological conditions such as cerebellar ataxia-I (spinocerebellar ataxia) [43,44] or hereditary spastic paraplegia (HSP) [45]. Greater improvements following rTMS administration in depressive patients [46] have been reported depending on the genetic background of the serotonin transporter (5-HTTLPR) and receptor (5-HT1A) genes. Also, homozygous subjects for the Val allele (but not Val/Met and Met/Met genotypes) of the val66met brain-derived neurotrophic factor gene (BDNF) showed a signif-icant increase in mean first dorsal interosseous map area, MEP amplitude and map volume after the performance of 30 min fine-motor exercises [47]. Similarly, Met allele carriers of the BNDF have been more recently shown to exhibit reduced response to theta-burst stimulation (TBS) by TMS [48], therefore revealing the effect of genetic variations associated with modification of use-dependent plasticity in the motor cortex.
In the present study we combined rTMS with behavioral, genetic and functional imaging data. The most striking result is that APOE e4 carriers showed a different pattern of brain activation and deactivation during the encoding task than noncarriers. However, after rTMS these patterns became much
more similar, due to a preferential impact of rTMS on patterns of brain activity in APOE e4 carriers, since brain activity in noncarriers was little modified.
At baseline, before rTMS, both groups show enhanced activity in brain networks involving frontal, associative visual (i.e. fusiform) MTL regions (hippocampus, parahippocampus) as well as the cerebellum. All these regions have been previously related to visual memory encoding in seminal studies employing face-name associative memory tasks [49,50]. Despite there were no significant differences in this global component (all subjects all sessions) across groups, in the e4-noncarrier group the frontal component involved also the superior parietal lobe in a patterns that topographically resembled the ‘frontoparietal’ network generally related to attentional and working memory processes [35], whereas individ-uals bearing the e4 allele recruited more inferior frontal lobe areas, the orbitofrontal cortex and the anterior cingulate region.
We then analyzed the pattern of brain activity separately for each genetic group and restricted to the areas that covaried with performance. Here, previous to the administration of rTMS, the e4-carriers group exhibited two networks, which were present in the encoding, whereas the e4-noncarriers exhibited activity integrated into one single network. Following rTMS, in the e4-noncarrier group a pattern of activity restricted to the fusiform gyri and visual areas was evident, gathered into one single network. On the other hand, after rTMS, two networks increased its expression in the e4-carrier group: The first one mainly included the fusiform gyri and the second a component that was not observable in the pre-rTMS condition within this group but which had a higher resemblance with the network present before rTMS in the e4-noncarriers (the fronto-parietal network).
Altogether, present findings show that rTMS may have caused a redistribution of neural network dynamics, enhancing activity in areas that are commonly related with the encoding task but also
Figure 4. Effects of rTMS in the DMN present in deactivation task-related networks. While both groups exhibited increased temporal correlations between the timecourse of this network and rest condition after rTMS, its activity (intensity of the expression) clearly diverged. In the bar graphs it is shown that DMN activity decreased for e4 non-carriers whereas increased for the e4-carriers. Corr: Correlation values (r-Pearson) between the timecourse of each network and the ‘resting condition’. Intensity values are thresholded at z = 2.3. Coordinates are given in MNI (x = 24, z = 26). A.U = arbitrary units.
favoring cortical activation in regions prone to modulate their activity during memory encoding depending on the individual genetic characteristics of subjects. Increased activity in cortical frontal and posterior regions has been repeatedly reported in the literature during distinct types of memory tasks among APOE-e4 carriers and related to executive-mediated compensatory brain mechanisms in the face of cognitive challenges [19,20,22,51–53]. Increased pattern of brain activity within the fusiform has also been observed in young samples during memory encoding demands [54]. Therefore, it appears that rTMS brought out patterns of activity previously reported, possible revealing estab-lished compensatory brain activity strategies.
Main effects were expected in the prefrontal region (since it was the site of stimulation), but we had no specific anatomical predictions for other areas, given that APOE influence on associative areas of all cerebral lobes has been reported (e.g. [19,20,22,55]. Since the effects of rTMS captured by fMRI are not restricted to the local area where it is applied [11,12] we also investigated the possible rTMS effects on network dynamics when subjects viewed passively and repeatedly an already known pair face-name (i.e. the ‘deactivation network’). Shulman et al. [41] showed that in these conditions, rest phases of an ongoing task, a set of areas are typically active regardless of the nature of the task, the so-called DMN. Interestingly, Alzheimer disease patients, but also pre-symptomatic individuals, show less robust deactivation of core areas of the DMN during memory encoding tasks [27,29,56]. Besides the fact that metabolic dysfunctions, amyloid deposition or atrophy [8] may directly impact the posterior DMN, the alteration of this network may be accounted for by disruptions in the functional connectivity between anterior and posterior core regions [57].
Previous studies in elders, have demonstrated that during cognitive processing lesser deactivations are found with decreasing task demands particularly in the posterior node of the DMN, and that these functional changes correlate with task performance [58– 60]. These findings therefore suggest that for a given level of task difficulty individuals who are cognitively more efficient will require reduced posteromedial deactivations. In our study, among the non-carrier group and following rTMS there was little change in terms of the topography of the deactivation pattern, but there was a relative reduction of the connectivity of these posteromedial regions after stimulation. As these changes emerged within the context of a cognitive amelioration, present observations reinforce the idea that these subjects when faced the second time with an equivalent task could employ more efficient brain resources.
In contrast to non-carriers, the pattern of connectivity of the DMN changed dramatically in e4-bearers after TMS. DMN alterations among APOE e4-bearers have been reported previ-ously, both in resting-state and as attenuated deactivation areas [18,28,54,58,61,62]. After rTMS DMN activity changed from three separate networks to a more robustly connected single one, resembling the one observed among non-carriers. Still, a lack of connectivity between the DMN and the hippocampus among e4-bears was observed both before and after rTMS. Previous reports are consistent in observing abnormal activity of this region among e4-bears during visual encoding tasks [52,62] including deviant patterns of connectivity [18,23]. Hence it is conceivably that the activity of this region was relatively permeable to rTMS effects in these individuals.
The functional changes observed in e4-carriers after rTMS may be related to a genetic modulation of APOE on brain plasticity mechanisms. The effects of non-invasive brain stimulation techniques, including rTMS and transcranial direct current stimulation have been reported to modulate synaptic and plastic
brain mechanisms that can be captured by imaging techniques (i.e. [63,64]). Plasticity is an intrinsic capacity of the human brain [7], which changes across lifespan depending on individual character-istics such as lifetime exposure to particular environments and the genetic background [11]. APOE is involved in neural development and repair functions [65,66] and APOE-e4 selectively impairs synaptic plasticity and NMDA receptor phosphorylation by Reelin, a regulator of brain development and modulator of synaptic strength [67]. Furthermore, APOE e4 is related to higher fibrillar b-amyloid deposition according to PiB findings [68] as well as to lower (i.e. more pathological) Ab1-42 CSF concentra-tions [69] in non-demented individuals. In turn, distinct Ab species, particularly soluble oligomers, are known to compromise synaptic plasticity, inducing long term potentiation (LTP) deficits and compromising cognitive functions (reviewed in [70]). Finally, increased Ab deposition both in soluble and fibrillar forms can be observed in response to increasing neural activity, even in young animals [71]. An increase in aerobic glycolysis related to elevated synaptic activity occurs in DMN areas [72] and high-sustained neural activity in this network may be a characteristic of APOE e4-carrier subjects from their young adulthood [54]. Therefore, it is possible that a more compromised fundamental plastic brain mechanisms among APOE e4-carriers may represent an under-lying mechanism leading to a distinct expression of brain networks as well as to a differential response of these to brain stimulation.
Complimentarily, the differential patterns of activation observed among our APOE e4-carriers may reflect a non-optimal use of cortical networks compatible with the concept of dedifferentiation (i.e. loss of highly specialized neural systems during specific tasks; [18,73]). Dedifferentiation occurs with advancing age, and age is a relevant modulating factor for functional brain responses in regions such as the hippocampus [54,61,74] among e4-carriers. Dedifferentiation has been reported to occur in the fusiform area during face perception [75], a critical region activated in our face-name task with different patterns in response to rTMS in both groups).
An obvious limitation of the present study is that we did not include equivalent genetic subgroups receiving sham stimulation. Despite further studies with larger samples may be need to address a possible differential genetic response to placebo stimulation, it seems unlikely that sham rTMS would exert differential effects in subjects depending on the APOE status or that practice effects on memory encoding rather than as a consequence of rTMS explain our findings. This is supported by an exploratory analysis performed in a group of 4 ApoE e4 carriers and 15 non-carriers receiving sham stimulation reflecting no changes both at the behavioral level or in the expression of networks when comparing the data before and after placebo stimulation (data not shown). The fact that we did not use a neuronavigation system to deliver rTMS prevented us from establishing more concrete anatomical hypotheses. Further studies with larger samples and more refined MRI-based TMS coil positioning procedures should overcome these limitations.
In summary, we demonstrate that genetic factors determine the pattern of compensatory plastic changes following a focal brain disruption (in this case induced by rTMS) and thus ultimately influence its behavioral consequences. The present findings may have profound implications for clinical neurology as they suggest that genetic factors play a crucial role in the inter-individual differences in recovery and the risk of development of disability following a focal brain insult. Although the exact neurophysiologic mechanisms that regulate the connectivity amongst the functional networks and particularly the DMN are very difficult to disentangle, the number of studies showing that genetic factors
play an important role in different neurological and psychiatric diseases is increasing [76]. Brain imaging measures used in genetic studies should ideally be highly heritable and be genetically related to a biological process affected by genetic variants, such as a disease process [14,76–78]. A greater understanding of such genetic factors might lead to the development of more effective, individually tailored rehabilitation strategies that considers differ-ences in patterns of compensatory plasticity.
Supporting Information
Figure S1 A) Non-thresholded contrast between encoding new
faces vs. viewing a repeated face. Regions that were active in the encoding phase depicted in yellow whereas areas deactivated during the encoding phase are shown in blue. B) Brain areas representing the contrast between encoding new faces in front of viewing a repeated face (thresholded at z = 2.3). The maps
depicted in red were the ones used for cortical thickness analysis. rh = right hemisphere; lh = left hemisphere.
(TIF)
Table S1 e4 carriers and noncarriers comparison
(whole brain analysis). (DOCX)
Table S2 ROI of functional activation.
(DOCX)
Table S3 Brain volumetric measurements.
(DOCX)
Author Contributions
Conceived and designed the experiments: CP-G DB-F AP-L JV-S CJ. Performed the experiments: CS-P DB-F JV-S JL-M BB NB. Analyzed the data: CP-G CS-P. Wrote the paper: CP-G DB-F AP-L ICC CS-P. References
1. He BJ, Shulman GL, Snyder AZ, Corbetta M (2007) The role of impaired neuronal communication in neurological disorders. Curr Opin Neurol 20, 655– 660.
2. Van den Heuvel MP, Mandl RC, Kahn RS, Hulshoff Pol HE (2009) Functionally linked resting-state networks reflect the underlying structural connectivity architecture of the human brain. Hum Brain Mapp 30(10):3127–41 3. Sporns O, Tononi G, Ko¨tter R (2005) The human connectome: A structural
description of the human brain. PLoS Comput Biol; 1(4):e42. Review. 4. Seeley WW, Crawford RK, Zhou J, Miller BL, Greicius MD (2009)
Neurodegenerative diseases target large-scale human brain networks. Neu-ron;62(1):42–52.
5. Shirer WR, Ryali S, Rykhlevskaia E, Menon V, Greicius MD (2012) Decoding subject-driven cognitive states with whole-brain connectivity patterns. Cereb Cortex 22(1):158–65. Epub 2011 May 26.
6. Zhou J, Gennatas ED, Kramer JH, Miller BL, Seeley WW (2012) Predicting regional neurodegeneration from the healthy brain functional connectome. Neuron73(6):1216–27.
7. Pascual-Leone A, Amedi A, Fregni F, Merabet LB (2005) The plastic human brain cortex. Annu Rev Neurosci 28, 377–401.
8. Buckner RL, Snyder AZ, Shannon BJ, LaRossa G, Sachs R, et al. (2005) Molecular, structural, and functional characterization of Alzheimer’s disease: evidence for a relationship between default activity, amyloid, and memory. J Neurosci 25:7709–17.
9. Pascual-Leone A., Bartre´s-Faz D, Keenan JP (1999) Transcranial magnetic stimulation: studying the brain-behaviour relationship by induction of virtual lesions. Phil Trans R Soc Lond B 354, 1229–1238.
10. Walsh V, Pascual-Leone A (2003) TMS in Cognitive Science: Neurochrono-metrics of Mind. Cambridge, MA (USA): MIT Press.
11. Pascual-Leone A, Freitas C, Oberman L, Horvath JC, et al. (2011) Characterizing brain cortical plasticity and network dynamics across the age-span in health and disease with TMS-EEG and TMS-fMRI. Brain Topogr;24(3–4):302–15.
12. Fox MD, Halko MA, Eldaief MC, Pascual-Leone A (2012) Measuring and manipulating brain connectivity with resting state functional connectivity magnetic resonance imaging (fcMRI) and transcranial magnetic stimulation (TMS). Neuroimage. [Epub ahead of print]
13. Petrella JR, Mattay VS, Doraiswamy PM (2008) Imaging genetics of brain longevity and mental wellness: the next frontier? Radiology 246(1):20–32. 14. Meyer-Lindenberg A (2009) Neural connectivity as an intermediate phenotype:
brain networks under genetic control. Hum Brain Mapp 30(7):1938–46. 15. Rasetti R, Weinberger DR (2011) Intermediate phenotypes in psychiatric
disorders. Curr Opin Genet Dev;21(3):340–8.
16. Saunders AM, Strittmatter WJ, Schmechel D, George-Hyslop PH, Pericak-Vance MA, et al. (1993) Association of apolipoprotein E allele epsilon 4 with late-onset familial and sporadic Alzheimer’s disease. Neurology 43, 1467–72. 17. Sterna¨ng O, Wahlin A (2011) What is the role of apolipoprotein E for cognitive
functioning across the lifespan? Biol Psychiatry;70(2):109–10.
18. Trachtenberg AJ, Filippini N, Mackay CE (2012) The effects of APOE-e4 on the BOLD response. Neurobiol Aging;33(2):323–34.
19. Bookheimer SY, Strojwas MH, Cohen MS, Saunders AM, Pericak-Vance MA, et al. (2000) Patterns of brain activation in people at risk for Alzheimer’s disease. N Engl J Med 343, 450–6.
20. Bondi MW, Houston WS, Eyler LT, Brown GG (2005) fMRI evidence of compensatory mechanisms in older adults at genetic risk for Alzheimer disease. Neurology 64, 501–8.
21. Lind J, Persson J, Ingvar M, Larsson A, Cruts M, et al. (2006) Reduced functional brain activity response in cognitively intact apolipoprotein E e4 carriers. Brain 129, 1240–8.
22. Han SD, Houston WS, Jak AJ, Eyler LT, Nagel BJ, et al. (2007) Verbal paired-associate learning by APOE genotype in non-demented older adults: fMRI evidence of a right hemispheric compensatory response. Neurobiol Aging 28, 238–247.
23. Bartre´s-Faz D, Serra-Grabulosa JM, Sun FT, Sole´-Padulle´s C, Rami L, et al. (2008) Functional connectivity of the hippocampus in elderly with mild memory dysfunction carrying the APOE e4 allele. Neurobiol Aging Nov;29(11):1644–53. 24. Wierenga CE, Stricker NH, McCauley A, Simmons A, Jak AJ, et al. (2010) Increased functional brain response during word retrieval in cognitively intact older adults at genetic risk for Alzheimer’s disease. Neuroimage 51(3):1222–33. Epub 2010 Mar 16.
25. Greicius MD, Srivastava G, Reiss AL, Menon V (2004) Default-mode network activity distinguishes Alzheimer’s disease from healthy aging: Evidence from functional MRI.Proc Natl Acad Sci USA 101:4637–4642.
26. Sorg C, Riedl V, Mu¨hlau M, Calhoun VD, Eichele T, et al. (2007) Selective changes of resting-state networks in individuals at risk for Alzheimer’s disease. Proc Natl Acad Sci U S A 104(47):18760–5.
27. Sperling RA, Laviolette PS, O’Keefe K, O’Brien J, Rentz DM, et al. (2009) Amyloid deposition is associated with impaired default network function in older persons without dementia. Neuron 63(2):178–88.
28. Pihlajama¨ki M, O’ Keefe K, Bertram L, Tanzi RE, et al. (2010) Evidence of altered posteromedial cortical FMRI activity in subjects at risk for Alzheimer disease. Alzheimer Dis Assoc Disord 24(1):28–36.
29. Sheline YI, Raichle ME, Snyder AZ, Morris JC, Head D, et al. (2010) Amyloid plaques disrupt resting state default mode network connectivity in cognitively normal elderly. Biol Psychiatry 67(6):584–7.
30. Wenham PR, Price WH, Blandell G (1991) Apolipoprotein E genotyping by one-stage PCR. Lancet 337, 1158–9.
31. Sole´-Padulle´s C, Bartre´s-Faz D, Junque´ C, Clemente IC, Molinuevo JL, et al. (2006) Repetitive transcranial magnetic stimulation effects on brain function and cognition among elders with memory dysfunction. A randomized sham-controlled study. Cereb Cortex 16, 1487–1493.
32. Beckmann CF, Smith SM (2004) Probabilistic independent component analysis for functional magnetic resonance imaging. IEEE Trans Med Imaging 23(2):137–52.
33. Calhoun VD, Adali T, Pearlson G, Pekar J (2001) A method for making group inferences from fMRI data using independent component analysis. Hum Brain Mapp 14:140–151.
34. Rissanen JA (1983) universal prior for integers and estimation by minimum description length. Ann Stat 11:416–431.
35. Beckmann CF, DeLuca M, Devlin JT, Smith M (2005) Investigations into resting-state connectivity using independent component analysis. Phil Trans R Soc B 360:1001–1013.
36. Fischl B, Dale AM (2000) Measuring the thickness of the human cerebral cortex from magnetic resonance images. Proc Natl Acad Sci U S A 97, 11050–11055. 37. Rosas HD, Liu AK, Hersch S, Glessner M, Ferrante RJ, et al. (2002) Regional and progressive thinning of the cortical ribbon in Huntington’s disease. Neurology 58, 695–701.
38. Salat DH, Buckner RL, Snyder AZ, Greve DN, Desikan RS, et al. (2004) Thinning of the cerebral cortex in aging. Cereb Cortex 14, 721–730. 39. Han X, Jovicich J, Salat D, van der Kouwe A, Quinn B, et al. (2006) Reliability
of MRI-derived measurements of human cerebral cortical thickness: the effects of field strength, scanner upgrade and manufacturer. Neuroimage;32(1):180–94. 40. Buckner RL, Head D, Parker J, Fotenos AF, Marcus D, et al. (2004) A unified approach for morphometric and functional data analysis in young, old, and demented adults using automated atlas-based head size normalization: reliability and validation against manual measurement of total intracranial volume. Neuroimage 23(2):724–38.
41. Shulman GL, Fiez JA, Corbetta M, et al. (1997) Common blood flow changes across visual tasks: II, decreases in cerebral cortex. J Cogn Neurosci 9:648–663. 42. Raichle ME, MacLeod AM, Snyder AZ, Powers WJ, Gusnard DA, et al. (2001)
A default mode of brain function. Proc Natl Acad Sci U S A 98:676–682. 43. Abele M, Bu¨rk K, Andres F, Topka H, Laccone F, et al. (1997) Autosomal
dominant cerebellar ataxia type I nerve conduction and evoked potential studies in families with SCA1, SCA2 and SCA3. Brain 120, 2141–2148.
44. Schwenkreis P, Tegenthoff M, Witscher K, Bo¨rnke C, Przuntek H, et al. (2002) Motor cortex activation by transcranial magnetic stimulation in ataxia patients depends on the genetic defect. Brain 125, 301–309.
45. Winner B, Uyanik G, Gross C, Lange M, Schulte-Mattler W, et al. (2004) Clinical progression and genetic analyisis in hereditary spastic paraplegia with thin corpus callosum spastic gait gene 11 (SPG11). Archives of Neurology 61, 117–121.
46. Zanardi R, Magri L, Rossini D, Malaguti A, Giordani S. et al. (2007) Role of serotonergic gene polymorphisms on response to transcranial magnetic stimulation in depression. Eur Neuropsychopharmacol 17, 651–7
47. Kleim JA, Chan S, Pringle E, Schallert K, Procaccio V, et al. (2006) BNDF val66met polymorphism is associated with modified experience-dependent plasticity in human motor cortex. Nat Neurosci 9, 735–737.
48. Cheeran B, Talelli P, Mori F, Koch G, Suppa A, et al. (2008) A common polymorphism in the brain-derived neurotrophic factor gene (BDNF) modulates human cortical plasticity and the response to rTMS. J Physiol Dec 1;586(Pt 23):5717–25.
49. Sperling RA, Bates JF, Cocchiarella AJ, Schacter DL, Rosen BR, et al. (2001) Encoding novel face-name associations: a functional MRI study. Hum Brain Mapp Nov;14(3):129–39.
50. Sperling RA, Bates JF, Chua EF, Cocchiarella AJ, Rentz DM, et al. (2003) fMRI studies of associative encoding in young and elderly controls and mild Alzheimer’s disease. J Neurol Neurosurg Psychiatry 74, 44–50.
51. Fleisher AS, Houston WS, Eyler LT, Frye S, Jenkins C, et al. (2005) Identification of Alzheimer disease risk by functional magnetic resonance imaging. Arch Neurol. Dec;62(12):1881–8.
52. Han SD, Bondi MW (2008) Revision of the apolipoprotein E compensatory mechanism recruitment hypothesis. Alzheimers Dement Jul;4(4):251–4. 53. Wierenga CE, Stricker NH, McCauley A, Simmons A, Jak AJ, et al. (2010)
Increased functional brain response during word retrieval in cognitively intact older adults at genetic risk for Alzheimer’s disease. Neuroimage Jul 1;51(3):1222–33.
54. Filippini N, MacIntosh BJ, Hough MG, Goodwin GM, Frisoni GB, et al. (2009) Distinct patterns of brain activity in young carriers of the APOE-epsilon4 allele. Proc Natl Acad Sci U S A 106(17):7209–14.
55. Smith CD, Andersen AH, Kryscio RJ, Schmitt FA, Kindy MS, et al. (2002) Women at risk for AD show increased parietal activation during a fluency task. Neurology Apr 23;58(8):1197–202.
56. Rami L, Sala-Llonch R, Sole´-Padulle´s C, Fortea J, Olives J, et al. (2012) Distinct Functional Activity of the Precuneus and Posterior Cingulate Cortex During Encoding in the Preclinical Stage of Alzheimer’s Disease. J Alzheimers Dis May 16.
57. Jones DT, Machulda MM, Vemuri P, McDade EM, Zeng G, et al. (2011) Age-related changes in the default mode network are more advanced in Alzheimer disease. Neurology 77(16):1524–31.
58. Persson J, Lind J, Larsson A, Ingvar M, Sleegers K, et al. (2008) Altered deactivation in individuals with genetic risk for Alzheimer’s disease. Neuropsy-chologia 46(6):1679–87.
59. Sala-Llonch R, Arenaza-Urquijo EM, Valls-Pedret C, Vidal-Pin˜eiro D, Bargallo´ N, et al. (2012) Dynamic functional reorganizations and relationship with working memory performance in healthy aging. Front Hum Neurosci 6:152. 60. Prakash RS, Heo S, Voss MW, Patterson B, Kramer AF (2012) Age-related
differences in cortical recruitment and suppression: implications for cognitive performance. Behav Brain Res Apr 21;230(1):192–200.
61. Filippini N, Ebmeier KP, MacIntosh BJ, Trachtenberg AJ, Frisoni GB, et al. (2011) Differential effects of the APOE genotype on brain function across the lifespan. Neuroimage 54(1):602–10.
62. Adamson MM, Hutchinson JB, Shelton AL, Wagner AD, Taylor JL (2011) Reduced hippocampal activity during encoding in cognitively normal adults carrying the APOE e4 allele. Neuropsychologia Jul;49(9):2448–55.
63. Stagg CJ, O’Shea J, Johansen-Berg H (2010) Imaging the effects of rTMS-induced cortical plasticity. Restor Neurol Neurosci 28(4):425–36.
64. Stagg CJ, Nitsche MA (2011) Physiological basis of transcranial direct current stimulation. Neuroscientist Feb;17(1):37–53.
65. Mahley RW (1988) Apolipoprotein E: cholesterol transport protein with expanding role in cell biology. Science Apr 29;240(4852):622–30.
66. Mahley RW, Rall SC (2000) Apolipoprotein E: far more than a lipid transport protein. Annu Rev Genomics Hum Genet 1:507–37.
67. Chen Y, Durakoglugil MS, Xian X, Herz J (2010) ApoE4 reduces glutamate receptor function and synaptic plasticity by selectively impairing ApoE receptor recycling. Proc Natl Acad Sci USA 107 (26):12011–6.
68. Morris JC, Roe CM, Xiong C, Fagan AM, Goate AM, et al. (2010) APOE predicts amyloid-beta but not tau Alzheimer pathology in cognitively normal aging. Ann Neurol Jan;67(1):122–31.
69. Popp J, Lewczuk P, Frommann I, Ko¨lsch H, Kornhuber J, et al. (2010) Cerebrospinal fluid markers for Alzheimer’s disease over the lifespan: effects of age and the APOEe4 genotype. J Alzheimers Dis 2010;22(2):459–68. 70. Palop JJ, Mucke L (2010) Synaptic depression and aberrant excitatory network
activity in Alzheimer’s disease: two faces of the same coin? Neuromolecular Med Mar;12(1):48–55.
71. Bero AW, Yan P, Roh JH, Cirrito JR, Stewart FR, et al. (2011) Neuronal activity regulates the regional vulnerability to amyloid-b deposition. Nat Neurosci Jun;14(6):750–6.
72. Vaishnavi SN, Vlassenko AG, Rundle MM, Snyder AZ, Mintun MA, et al. (2010) Regional aerobic glycolysis in the human brain. Proc Natl Acad Sci U S A Oct 12;107(41):17757–62.
73. Park DC, Polk TA, Park R, Minear M, Savage A, et al. (2004) Aging reduces neural specialization in ventral visual cortex. Proc Natl Acad Sci U S A Aug 31;101(35):13091–5.
74. Dennis NA, Browndyke JN, Stokes J, Need A, Burke JR, et al. (2010) Welsh-Bohmer KA, Cabeza R. Temporal lobe functional activity and connectivity in young adult APOE varepsilon4 carriers. Alzheimers Dement Jul;6(4):303–11. 75. Park J, Carp J, Kennedy KM, Rodrigue KM, Bischof GN, et al. (2012) Neural
broadening or neural attenuation? Investigating age-related dedifferentiation in the face network in a large lifespan sample. J Neurosci Feb 8;32(6):2154–8. 76. Glahn DC, Winkler AM, Kochunov P, Almasy L, Duggirala R, et al. (2010)
Genetic control over the resting brain. Proc Natl Acad Sci U S A 107(3):1223–8. 77. Gottesman II, Gould TD (2003) The endophenotype concept in psychiatry:
etymology and strategic intentions. Am J Psychiatry 160(4):636–45. Review. 78. Winkler AM, Kochunov P, Blangero J, Almasy L, Zilles K, et al. (2010) Cortical
thickness or grey matter volume? The importance of selecting the phenotype for imaging genetics studies. Neuroimage 53(3):1135–46.