Copyright © 2016 Vilnius Gediminas Technical University (VGTU) Press http://www.tandfonline.com/TTED
2018 Volume 24(1): 141–163 doi:10.3846/20294913.2015.1124151
Corresponding author Massimiliano Mazzanti E-mail: [email protected]
BACKING ENVIRONMENTAL INNOVATIONS THROUGH
INFORMATION TECHNOLOGY ADOPTION. EMPIRICAL ANALYSES
OF INNOVATION-RELATED COMPLEMENTARITY IN FIRMS
Davide ANTONIOLI, Marianna GILLI,Massimiliano MAZZANTI, Francesco NICOLLI
Department of Economics and Management, University of Ferrara, Via Voltapaletto 11, Ferrara, Italy Received 01 July 2013; accepted 31 May 2015
Abstract. The paper tests empirically whether various types of Information and Communication Technologies (ICT) adoption and other innovation practices (techno-organisational change and training courses) are complementary inputs with respect to the adoption of specific environmental innovations (EI). The analysis is based on original survey data for a large industrial Italian region (Emilia-Romagna), which offer various views on ICT and EI relationships. This survey contains information on the adoption of environmental innovations and some detailed information on ICT issues and other technological-organisational processes. Our main findings suggest that, overall, complementarity does not seem to characterize the relationship between ICT and other innova-tion processes as a force behind environmental innovainnova-tion, but some important excepinnova-tions emerge. Complementarities exists, for instance, between technological innovation and both adoption of ICT management systems and ICT for cooperation with clients. Interestingly, restricting the analysis to a sub-sample of more polluting firm, both complementarity and substitutability emerge more evidently.
Keywords: ICT, environmental innovations, complementarity, organisational change, innovation adoption, firm based data.
JEL Classification: O33, Q55, D22.
Introduction: ICT, eco innovations and complementarity
The advancement to a greener and more competitive economy is possible only if all com-ponents of social welfare are taken into account by firms, stakeholders and policy makers. Environmental or eco innovations (EI) are a key factor, as it is well known that sustainable economic growth depends upon a constant investment in technological, organisational and labour related new ways of managing production. The EI potential must be enriched and
embedded within a very broad set of related factors. One of the most recent definitions of eco-innovation defines it as the production, application or use of a product, service, pro-duction process or management system new to the firm adopting or developing it, which implies a reduction in environmental impact and resource use (including energy) through-out its life-cycle (Kemp 2010). This definition includes innovations whose environmental effects are not intentional. A relevant distinction can be made between end-of-pipe tech-nologies and clean techtech-nologies integrated in the production process (Del Rio 2009). The analysis of the determinants of eco innovation (EI) has largely developed over the recent years along various streams of research, that have enlarged the vector of eventual correlated factors (De Marchi 2012; Horbach, Rennings 2012; Cainelli et al. 2012; Veugelers 2012) and included the role of complementarity between factors behind EI (Antonioli et al. 2013).
How to spur the adoption of new or significantly improved products or processes, or-ganisational or marketing methods that create environmental benefits by firms and which have to be considered valid determinants of the adoption of such environmental innova-tions, are central and widely debated topics. On the one side specific firm characteristics such as sector1, region, age and size are found to be significant EI drivers (Rehfeld et al. 2007; Ziegler, Rennings 2004). The so called “market pull variables” play a role, such as turnover expectations and economic performance of the past (Horbach 2008; Mazzanti, Zoboli 2009; Rehfeld et al. 2007). On the other side also “technology push variables”, i.e. those related to improvements in the technological capabilities of firms matter, in par-ticular R&D and/or the presence of knowledge capital and of organisational innovations and management schemes, (mainly ISO 14001:2015 and EMAS (2009)) have come to be relevant (Ziegler, Rennings 2004). Regulation and environmental policies have also found to significantly affect the adoption of environmental innovations (Jaffe, Palmer 1997; Cleff, Rennings 1999; Brunnermeier, Cohen 2003; Costantini, Mazzanti 2012; Frondel et al. 2004; Horbach, Rennings 2012; Rennings et al. 2006; Jaffe et al. 2002; Johnstone et al. 2012; Ren-nings, Rexhauser 2010), although with some mixed results when referred to the European Trading Scheme effects in Italy (Borghesi et al. 2012).
In this growing and fertile body of literature, one often overlooked but relevant aspect relates, we believe, to the role played by the diffusion of information and communication technologies (ICTs) and their effect on EI2. ICTs diffusion had its momentum in recent decades and caused substantial changes in production processes, behaviors and lifestyles. Berkhout and Hertin (2004), for example, distinguish three environmental effects of (green) ICT: direct (pollutant) effects, driven by the larger scale of production and use of activities that ICT allows for; indirect effects, due to the dematerialization of introducing ICT in pro-1 Sectors represent a crucial and idiosyncratic “place” where innovation is developed and diffused: “Industry
char-acteristics matter and cannot be ignored […] to design policy programs and tailor them more effectively to the needs of targeted firms” (Peneder 2010). Malerba (2004) and Malerba and Orsenigo (1997) promote a sectoral system view of innovation as a complement to national systems of innovation. Sectors differ greatly with respect to their knowledge basis, technologies, production processes, policy and institutional environments, complemen-tarity between innovations and market demand. A “one size fits all” approach may be not effective in supporting innovation diffusion and consequently economic and environmental performances (Peneder 2010).
2 More in general, innovation in ICT has been claimed to stimulate “green” economic growth and spur a recovery
from the current global crisis (OECD 2009). Also, the synergies between ICT and other technologies (e.g., nano-technologies or bionano-technologies) are expected to drive further innovation (EEA 2015).
duction processes (on the actual extent of these effects, see Montresor and Vittucci Marzetti (2011)), and the increasing efficiency of production process due to ICTs adoption; structur-al change effects, linked to behaviourstructur-al comprehensive effects, and vstructur-alue based changes for firms and households. From an EI perspective the second (indirect) effect is of particular interest for the present analysis, as part of this increased efficiency can have environmental consequences and be an innovation-enhancing factor. ICTs adoption, for instances “enable the simulation of complex production systems to test and review costs, material use, and environmental emissions of design options” (Berkhout, Hertin 2004) and more generally increase the supply chain efficiency, which are fundamental factors to environmental effi-ciency. The role of ICT adoption as a component of the greening of firm’s production has been object of previous research (Cecere et al. 2012), although applied research has been constrained by paucity of data. Among others, Cainelli et al. (2012) find a positive and very high correlation between EI and ICT adoption (namely intensity in the adoption of ICT innovations). In a more recent contribution, Diaz-Chao et al. (2015), analyses the role of ICT as a source of labour productivity; results highlights that ICT together with other innovation sources, has and indirect role in spurring firm’s labour productivity.
More interestingly, being ICTs general purpose technologies (GPT), they are charac-terised by having a potential for a pervasive use in a wide array of sectors and activity and, more relevant, by having an intrinsic potential for technical improvements and innovation complementarities (Bresnahan, Trajtenberg 1995)3. We believe in particular that this last characteristic is extremely relevant when it comes to EI. One of the main consequences of the diffusion GPT, in fact, according to Bresnahan and Trajtenberg (1995) is their capacity to generate innovation complementarities4. In the field of EI it means that the diffusion of ICTs can increase the return of other factors which are influencing the adoption of eco-innovation. We then pose EI as a relatively newer adoption strategy, largely influenced by recent climate change policies (e.g. EU ETS), whose adoption grounds on the more consolidated diffusion of ICT and other techno organisational practices. Within an evolu-tionary accumulation of technologies and competences within firms, eco innovations thus derive from the stock of other techno- organisational innovations, and the eventual links amongst them.
Complementarities between ICTs and other factors may manifest in several instances. ICTs diffusion can facilitate the adoption of environmental management systems (EMS), which influence positively the probability of adopting technological eco-innovation (Wag-ner 2008). Similarly, ICTs diffusion, influencing positively the capacity of firms (especially SMEs) to communicate with other firms or institutions, can increase the collaboration with research institutes, agencies and universities, which often facilitate the adoption of EI (Triguero et al. 2013; Frey et al. 2011). In a similar way, the gain in efficiency due to computer-controlled supply chain management systems can be complementary with other organisation innovation. For instance organisational innovation like just-in-time and qual-3 See Antonioli et al. (2010) for empirical evidence on the potential synergies among ICT and other innovation
activities on the labour productivity.
4 In their seminal contribution, for instance, they found that the productivity of R&D in downstream sectors
ity management can be introduced more efficiently and less costly in firms with developed ICT systems like supply chain management and electronic data interchange system, which allowing a better control of information flows inside the firms can have a complementary effect with organisational innovation. Finally, also skills complementarity may play a rel-evant role. The adoption of ICTs can spur demand for different and more educated skill profiles and these new highly qualified employees can, in turn, push for the adoption of new innovations, such as EI, which might be skill biased due to their novelty, complexity and relative radicalness5. As an example, to improve energy efficiency in a steel production line, we do need new technological equipment, but also new team working practices and human resource management skills. Then ICT complement and give fuel to the implemen-tation of the web of innovations to support enhanced energy efficiency.
To the best of our knowledge, these complementarities have been overlooked by most empirical and theoretical analysis so far. This paper is a first attempt to fill this gap, pre-senting a novel empirical analysis in this direction. A profound theoretical framework of the interplay among these factors is, however, beyond the scope of this work, and repre-sents a possible future extension. When data availability permits it, the research hypothesis to target would be whether the more diffuse and intense – not just present – is the ICT adoption in a firm, the more likely is that EI and ICT will be correlated and integrated in the firm’s innovative strategy.
Building upon this framework, this paper investigates empirically whether various types of ICT adoption and other potential factors influencing eco-innovation are complementary inputs in the diffusion of EI. For what concern the other factors, we refer here to organs-isational innovations, technological innovations and training courses6, which we expect to exert a stronger effect in firms that have also adopted ICTs. Following the traditional definition, complementarity exists between two activities if “doing more” of “one of them” increases the attractiveness of “doing more” on the part of the other, or in other term when the whole is bigger than the sum of the part (Roberts 2006: 37). The existence of comple-mentarity in this context has relevant consequences for both firms strategies and policy makers, and suggest that investment in general purpose technologies like ICTs increases the return of other innovation practices when it comes to incentivizing the adoption of eco-innovation. Since the first contributions on complementarity in innovation policies (for instance Mohnen and Roller (2005)), several papers has revolved around empirical analysis in order to test complementarities in firms’ innovation practices. Miravete and Pernìas (2006) studies the presence of complementarity between process and product innovations in the Spanish ceramic tile industry, while Antonioli et al. (2013), in a paper closely related to ours, study the complementarity between organisational innovation and training and their joint effect on EI. Finally, Gilli et al. (2014), exploiting cross-country data, studies the complementarity between different type of innovation practices with respect to the reduction of CO2.
5 This skill bias can be seen as the result of an strategic attempt to exploit the increasing supply of highly educated
workforce (Antonelli, Quatraro 2010).
Summarising, our three novel research hypotheses can read as follow:
H1: ICTs adoption and organisational innovation practices are complementary inputs with respect to EI.
H2: ICTs adoption and training programs are complementary inputs with respect to EI. H3: ICTs adoption and technological innovation are complementary inputs with
re-spect to EI.
We use original data from a regional survey from the Emilia-Romagna region in the North east of Italy. This investigation delivers new evidence on the rather overlooked rerlationships between EI and ICT. We focus here on the side of innovation cofactors, leav -ing to future research the assessment of Innovation effects on economic performances (Costantini, Mazzanti 2012).
1. Data and methodology 1.1. Data
We exploit data from an original survey on a Northern Italian region, Emilia-Romagna. The survey was carried out in 2009 to cover the same basic questions on EI presented by the CIS (see Antonioli et al. 2013). The survey covers 555 manufacturing firms for which information on EI (Tables 1 and 2; Appendix B) and techno-organisational innovations are available. The ICT section is very detailed (Tables 1 and 2; Appendix B) and provide many information that can be usefully correlated to EI information, that somewhat mirror the CIS taxonomy (carbon abatement, emission abatement, EMS, environmental R&D, etc.). More information on the survey are available in two recent published papers (Antonioli et al. 2013; Cainelli et al. 2012) that deal with EI and complementarity issues on such data source. The set of the four EI binary variables and their construction is clearly reported in Appendix B, questions Q1 and Q2.
The information on ICT adoption are more extended and detailed compared to the EU CIS and offer room for assessing the complementarity between ICT and other techno organisational innovations that may lie behind the adoption of EI. Hall et al. (2013) recently focus on the complementarity between R&D and ICT as a factor associated to innovation adoption. They do not find significant complementarity, though they find complementarity between R&D and worker skill in innovation. Complementarity is a crucial determinant of innovation that may be very relevant to fully integrate EI in production processes while increasing the value of adoption through the integrated inclusion of more innovations.
The ICT variables used come from the questions Q3 and Q4 reported in Appendix B. At first we focused on the adoption of all the six management systems and networking integration practices constructing an index (ICTSYSINTRO) as the number of practices introduced divided by the total number of practices listed in the question (see Appendix B question Q3). Then we concentrated on two specific systems: Material Requirements Planning (MRP) and Enterprise Resource Planning (ERP), which we expect to be more related to EI than other types of ICT management systems, because of their intrinsic nature to plan the use of materials and resources. In addition, we focused our attention on two
activities carried out with the use of ICT: product and process supporting activities (ICT_ PROD); cooperation activities (ICT_COOP).
Interacted with the ICT variables we have other relevant innovation practices: one from the organisational sphere, which capture the diffusion of organisational changes adopted by the firm in the period 2006–2008 (OrgIndex) and its dichotomised version (ORG_D); one from the training sphere that provide information on the diffusion of training programmes (TrainCov) and its dichotomised version (TRAIN_D); two from the technological sphere, the first one capturing the adoption of product and process innovations (TECH_D) and the other the cooperation activity implemented by the firm to develop technological innovations (CoopUniOrg_D).
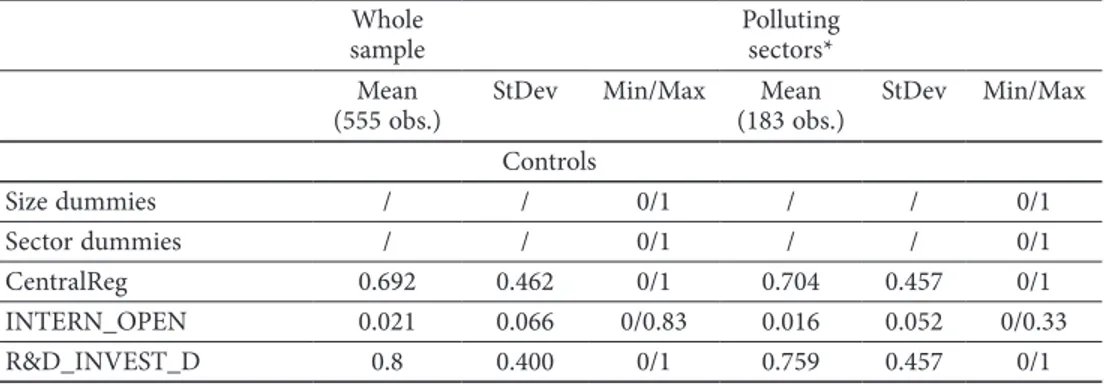
The main descriptive statistics and the variables constructions are reported in Tables 1 and 2.
Table 1. Descriptive statistics
Whole
sample Polluting sectors*
Mean
(555 obs.) StDev Min/Max (183 obs.)Mean StDev Min/Max Dependent variables
Energy/Material reduction per unit of product (ENERGY)
0.147 0.355 0/1 0.224 0.418 0/1
CO2 reduction (CO2) 0.115 0.319 0/1 0.163 0.371 0/1
Emissions reduction for soil, water and air (EMISSIONS)
0.140 0.347 0/1 0.191 0.394 0/1
Adoption of procedures like EMAS and ISO14001 (EMASISO) 0.144 0.351 0/1 0.180 0.385 0/1 ICT ICTSYSINTRO 0.289 0.284 0/1 0.220 0.260 0/1 ICTSYSINTRO_D 0.441 0.497 0/1 0.300 0.459 0/1 MRP_D 0.356 0.479 0/1 0.224 0.418 0/1 ERP_D 0.475 0.499 0/1 0.371 0.484 0/1 ICT_PROD_D 0.659 0.474 0/1 0.628 0.484 0/1 ICT_COOP_D 0.636 0.481 0/1 0.595 0.492 0/1 INNOVATIONS OrgIndex^ 0.642 0.408 0/2.38 0.606 0.379 0/2.05 ORG_D 0.422 0.494 0/1 0.409 0.493 0/1 TrainCov 37.80 36.91 0/100 43.29 38.05 0/100 TRAIN_D 0.377 0.485 0/1 0.448 0.498 0/1 CoopUniOrg_D 0.472 0.499 0/1 0.371 0.484 0/1 TECH_D 0.705 0.457 0/1 0.688 0.464 0/1
Whole
sample Polluting sectors*
Mean
(555 obs.) StDev Min/Max (183 obs.)Mean StDev Min/Max Controls Size dummies / / 0/1 / / 0/1 Sector dummies / / 0/1 / / 0/1 CentralReg 0.692 0.462 0/1 0.704 0.457 0/1 INTERN_OPEN 0.021 0.066 0/0.83 0.016 0.052 0/0.33 R&D_INVEST_D 0.8 0.400 0/1 0.759 0.457 0/1
Note: _D means dummy variable *We define as the most polluting sectors the following ones: DE – Manufacturing of pulp, paper and paper products, publishing and printing; DF – Manufacturing of coke, refined petroleum products and nuclear fuel; DG – Manufacturing of chemicals, chemical prod-ucts and man-made fibres; DI – Manufacture of other non-metallic mineral prodprod-ucts; DJ – Manufac-turing of basic metals and fabricated metal products. The two digit classification is in accordance with NACE Rev.1; ^Because of its construction (see Table 2) the index maximum may exceed 1, but rescaling it in the interval 0/1 do not change the results.
Table 2. Construction of the variables used in the analysis Dependent variables Energy/Material
reduction per unit of product (ENERGY)
Dummy variable: 1 if innovations addressed to reduce use of materials and/or energy by output unit (included recycling) have been adopted; 0 otherwise
CO2 reduction (CO2) Dummy variable: 1 if innovations addressed to reduce CO2 emissions have been adopted; 0 otherwise
Emissions reduction for soil, water and air (EMISSIONS)
Dummy variable: 1 if innovations addressed to reduce emissions for soil, water and air have been adopted; 0 otherwise
Adoption of procedures like EMAS and ISO14001 (EMASISO)
Dummy variable: 1 if procedures that structurally identify environmental performance have been adopted; 0 otherwise
ICT^
ICTSYSINTRO Number of ICT management systems introduced divided by the total number of potential ICT systems listed in the questionnaire (6) ICTSYSINTRO_D Dummy variable: 1 if the number of ICT management systems
implemented is above the sample average; 0 otherwise
MRP_D Dummy variable: 1 if the ICT management system Material Requirements Planning (MRP) has been introduced; 0 otherwise
ERP_D Dummy variable: 1 if the ICT management system Enterprise Resource Planning (ERP) has been introduced; 0 otherwise
ICT_PROD_D Dummy variable: 1 if the ICT systems implemented are addressed to manage the production process; 0 otherwise
ICT_COOP_D Dummy variable: 1 if the ICT systems implemented are addressed to manage cooperation with clients and suppliers (e.g. post selling services); 0 otherwise
INNOVATIONS^
OrgIndex Number of new organisational practices introduced by the firm for individuals (value assigned 1), teams (value assigned 2) and both (value assigned 3) divided by the total number of potential practices listed in the questionnaire (18)
ORG_D Dummy variable: 1 if the number of new organisational practices introduced is above the sample average; 0 otherwise.
(18 potential practice: e.g. team working, quality circles, widening of employees autonomy; job rotation, widening of employees competences, wage premia, performance evaluation of employees)
TrainCov Percentage of permanent workers participating to training programmes TRAIN_D Dummy variable: 1 if the percentage of permanent workers participating
to training programmes is above the sample average; 0 otherwise CoopUniOrg_D Dummy variable: 1 if the firm cooperates with universities or research
organisations to develop technological innovation; 0 otherwise
TECH_D Dummy variable: 1 if the firm introduced a product or process innovation new to the firm itself; 0 otherwise
Controls
Size dummies 4 size dummies according to the number of employees: 20–49 employees; 50–99 emp.; 100–249 emp.; more than 249 emp.)
Sector dummies* 9 sector dummies according to a RAMEA (Regional Accounting Matrix including Environmental Accounts) sector** classification, based on NACE-Rev.1: DA-Food; DB-DC Textile; DD-DH-DN-Wood, RubberPlastic and Other industries; DE-Paper; DF-DG-Coke and Chemicals; DI-NonMetallicMineralProducts; DJ-Metallurgy; DK-DL-DM-Machinery CentralReg Dummy variable: 1 if the firm belongs to one of the provinces constituting
the backbone of the Emilia-Romagna industrial system (Bologna, Parma, Modena, Reggio-Emilia); 0 otherwise
INTERN_OPEN Index capturing if the firm is an associated of a foreign one (values on the interval (0,1)): acquisition, joint venture, new firm from a foreign company, majority share in equity capital; minority share in equity capital
R&D_INVEST_D 1 if the firm invested in R&D; 0 otherwise
Notes: *Sectoral issues have gained considerable consideration since the Pavitt (1984) taxonomy was in-troduced into the economics of innovation. It has become standard to control for sector specific effects in the innovation production framework (Roper et al. 2008), one issue being that high technology firms may have higher propensity (Hall et al. 2009). Robust sector/geographical controls are thus necessary. Though interesting, more specific analyses on sectors (Cainelli, Mazzanti 2013; Borghesi et al. 2015) are here constrained by sample size: we focus given our research interests and data availability on the divide between ETS and non ETS manufacturing firms. More refined analyses will be scope for further research; **Consoli and Rentocchini (2014) extends the Pavitt categorization by suggesting a dynamic and skill based taxonomy of sectors that takes into account the evolutionary and transformative nature of economic systems. The hint is that industries are collection of activities where skills and knowledge adapt, leading to a transformative process that affects sectors as well. Skills evolution and adaptation, and increasing integration between sectors are main reasons behind an evolutionary view on sectors taxonomy. Again, accounting for such new categories and issues in the realm of eco innovation is scope for further research.
1.2. Methodology
To address the research hypothesis H1 we estimate a consolidated innovation function à la Griliches through the following probit model (Horbach 2008; Cainelli et al. 2012; Veugelers 2012):
(
)
( )
Pr Yi =1/X = Φ X,β ,
where F is the cumulative distribution function of the standard normal distribution and Yi is a dummy variable that takes the value 1 if a firm i introduces an EI and 0 otherwise. X is a set of covariates that is described in Table 1. However, a usual specification is not enough to test for complementarity, although it may give some insights on the linkages among the dependent variables and the main covariates.
In fact, in order to test for complementarities we need to set up a different specification, which stems from the theories and properties of supermodular functions. This technical approach has the benefit to focus on the pure economic analysis, without the need to dwell on more mathematical issues, such as particular functional forms that ensure the existence of interior optima. For example, no divisibility or concavity assumptions are needed, so that increasing returns are easily encompassed. Following Milgrom and Roberts (1995) we state that two variables x¢ and x² in a lattice X are complements if a real-valued function F(x¢, x²) on the lattice X is supermodular in its arguments. That is, if and only if:
F x x( ′∨ ′′)+F x x( ′∧ ′′)≥F x( )′ +F x( )′′ ∀x x′ ′′, ∈X. (1)
Or, written in a different way:
F x x( ′∨ ′′)−F x( )′ ≥F x( )′′ −F x x( ′∧ ′′) ∀x x′ ′′, ∈X, (2) that is, the change in F from x¢ (or x²) to the maximum (x¢ Ú x²) is greater than the change in F from the minimum x¢ Ù x² to x² (or x¢): raising one of the variables raises the value of increases in the second variable as well. Supermodularity gives an analytical structure to the idea that “increasing the value of some variables never prevents one from increas-ing the others as well” (Milgrom, Roberts 1995: 182). In our specific case we consider the “Environmental Innovation function” of firm j (EIj) as the firm’s objective function (see Antonioli et al. 2013; Mancinelli, Mazzanti 2009; Mazzanti, Zoboli 2008 for more meth-odological details). In our case the function F is the innovation function EI for each firm j with main arguments other techno-organisational innovations, training activities and ICT: EIj=F Controls ICT Techno Org Train
(
j, j, j, j, j)
. (3) In order to make the complementarities tests simple and manageable the main covariates are dichotomised, when necessary, in order to create couples of innovation variables whose interactions provide four states of the world for each couple. The firm may decide to adopt both innovations {1,1}, one but not the other {1,0} or {0,1} and neither one nor the other {0,0}. The set of the four states of the world represent a lattice H={
{ } { } { } { }
00 , 01 , 10 , 11}
and the EI function is supermodular in the innovation couples, that is innovations are complements, if the following inequality is satisfied:
(11, )− (00, )≥ (10, )− (00, )+
j j j j j j j j
EI Controls EI Controls EI Controls EI Controls
EIj(01,Controlsj)−EIj(00,Controlsj). (4) This inequality tells us that changes in the firm’s environmental innovation performance when the innovations are increased together are higher than the changes resulting from the sum of the separate increases of the two innovations. Increases in EI due to an increase of both innovations from {00} to {11} are greater (or at least equal) than the sum of increases in EI due to separate increases of the innovations from {00} to {10} ({01}).
The operationalization of the procedure to test for the complementarities among in-novations passes through a two steps procedure. The first step of the investigation is then given by a set of probit regressions in which all the four state of the world for each couple of innovations are included, in order to get the coefficients associated to each state of the world7: b1 for {1,1}; b2 for {1,0}; b3 for {0,1} and b4 for {0,0}.
Once we fitted the probit models, the second step of the analysis was to test hypotheses implementing a set of Wald tests. The latter allows us to test the following linear restric-tion, under the null hypothesis, on the state-of-the-world-dummies coefficients: b1 + b4 = b2 + b3. The test is distributed as a χ2 with one degree of freedom, since we are testing a single linear restriction at a time. Given that the Wald test has one degree of freedom it does support the appropriate procedure for the p-value adjustment in testing inequalities8. Indeed, we are interested in the following inequalities, namely the sign of the scalar linear combination of our parameters of interest: b1 + b4 – b2 – b3 ≥ 0; b1 + b4 – b2 – b3 ≤ 0. If we join the information provided by the standard Wald test, that is given by the p-value adjustment for inequality tests and the one on the sign of the linear combination of the coefficients, we are able to test for complementarity (b1 + b4 – b2 – b3 ≥ 0) or substituta-bility (b1 + b4 – b2 – b3 ≤ 0) between each couple of innovations.
We apply the above procedure for both the whole sample of interviewed firms and for the subsample of most polluting ones: those subject to the Emission Trading Scheme (ETS). 2. ICT, EI and complementarity in the Emilia-Romagna manufacturing sector We here focus on the results, stemming from our econometric procedure, provided by the survey data on the Emilia-Romagna region in the North of Italy (Fig. A1 in Appendix A) in order to provide evidence on the ICT role in relation to the adoption of EI. We in fact exploit the highly detailed information that this specific survey on 555 manufacturing firms delivers. We use this original source of information to infer new insights on the hypothesis that some sort of complementarity – between ICT and other techno- organisational fac-tors – lies behind the adoption of EI, namely that EI is more present in firms that strate-gically and synerstrate-gically match various innovations. We match various ICTs features with 7 We run both simple probit and multivariate probit in order to account for simultaneity in the adoption of EI
in-novations. Because the results are largely unchanged, with respect to the probit, and because the convergence is not always assured by the maximization procedure underlying the multivariate probit approach we report in the next section the results for the probit models. Results are available upon request.
three key firm strategies (organisational innovations, training, technological innovation). Table 2 above fully explains the set of variables we exploit in the econometric analysis. Figure A2 (Appendix A) shows up the Region map and the “innovation diamond” of a firm that relates to the data we gathered from the survey. Table A1 presents all “states of the world” defined by the presence or absence of a defined element (with two elements we witness 4 states).
The first set of econometric results here reported is given by probit specifications in which the innovation variables are included as usual covariates in order to show the robust-ness of the models and the expected signs of the controls9 (Table 3). As we can see, the adoption of EIs seems to be highly related to the pervasive diffusion of training courses10. The higher the percentage of permanent workers involved in training programs, the higher is the probability to introduce some kind of EI. The second interesting evidence is given by the ICT_PROD variable. Although quite feeble the positive and significant relations seems to tell that when ICT are introduced in order to manage the process and product of the firms then it is more likely to introduce EIs. Interestingly this effect is larger for ENERGY and EMASISO implying that the integration between EI and ICT, despite necessary, is not yet a central part of firms strategy to de-carbonization of the economy. In line with previous work (Cainelli et al. 2012), the role of “general” R&D for EI is almost irrelevant, with the important exception of ENERGY reduction eco-innovations11. Finally, while the cooperation activities with universities and other research organisational does not seem to be related with EI introduced to reduce CO2 emission12, it does seem to have some rela-tions with both the adoption of EIs addressed to save energy, reduce emissions, other than CO2, polluting soil, air and water and the adoption of green certificates.
In order to test for complementarities we run several probit regressions similar to those in Table 3, but substituting the innovation covariates with the states of the world for each couple of ICT and other innovation types, after having dichotomized the variables when necessary, as explained in Table 1 above. As an example, the first probit specification we run for each EI dependent variable has all the controls, training and technological innovation variables, while the organisational innovation index has been replaced by its binary varia-ables and the index of ICT management system adoption has been replaced by its binary variable as well13. The two binary variables were interacted in order to find out when both have 1, when one or the other has 1 and no one of the two variable has a 1 for each firm. 9 As we can see from the correlation tables (Appendix, Tables A2, A3), one for the binary covariates and one for
the non-binary, there are no large correlations among the covariates. Although the technological variables seem to be correlated in the bivariate setting, it turns out that multicollinearity, measured by the variance inflation factor, is not an issue in the probit reported in Table 3, so that our results are robust to the multicollinearity issue.
10 Given the cross-sectional nature of our dataset, it has to be noted that our results have to be interpreted as robust
correlations rather than true causal effects.
11 A different result has been found, for example, by Horbach (2008), who shows that the increase in technological
capabilities by R&D triggers EI.
12 Also in this case other works show different links. De Marchi (2012), for instance, found a positive relationship
between R&D cooperation strategy and EI.
13 We also decided to leave outside the specification the other ICT variables in order to focus on each type of ICT
at a time, without controlling for the remaining ICT, which can also be correlated to the state of the world con-structed and increasing the collinearity in the specification.
Each firm is in a single state of the world, it never happens that the firm j is jointly in one and in another state of the world14. Tables 4 and 5 show that as often found, complementar-ity is not a low hanging fruit (Hall et al. 2013). Complementarcomplementar-ity arises in few cases both for the whole sample of firms and for the subsample of most polluting ones, those subject to the Emission Trading Scheme (ETS). Moreover, the complexity of innovation strategies and their effect is also remarked by the evidence of some relation of substitutability between ICT and other innovation variables.
14 Because the number of the probit regressions we run is extremely high (64) we decided to not report the results
for space constraint. The results are available upon request from the authors. Table 3. Probit specifications
EI fields (dep. Var.) ENERGY CO2 OTHER_EMISSIONS EMASISO
Size (d) Yes Yes Yes Yes
Sectors (d) Yes Yes Yes Yes
CentralReg –0.015 0.014 0.003 0.009 (0.030) (0.028) (0.029) (0.029) INTERN_OPEN 0.157 0.247 0.157 0.375* (0.182) (0.179) (0.192) (0.204) R&D_INVEST_D 0.094** 0.044 0.026 –0.028 (0.047) (0.041) (0.042) (0.040) TrainCov 0.001*** 0.001*** 0.001*** 0.001*** (0.000) (0.000) (0.000) (0.000) OrgIndex 0.043 0.008 0.016 0.052 (0.034) (0.031) (0.035) (0.034) TECH_D –0.010 0.014 –0.009 –0.021 (0.035) (0.032) (0.035) (0.036) CoopUniOrg 0.062* 0.033 0.056* 0.069** (0.032) (0.030) (0.032) (0.032) ICTSYSINTRO 0.061 0.070 0.066 –0.057 (0.052) (0.051) (0.053) (0.054) ICT_PROD_D 0.068* 0.059* 0.057* 0.068* (0.036) (0.033) (0.034) (0.036) ICT_COOP_D 0.007 0.013 –0.010 0.028 (0.032) (0.030) (0.031) (0.032) N 555 555 555 555 r2_p 0.177 0.165 0.167 0.180 chi2 71.011 717.433 552.368 80.752 ll_constant-only model –232.424 –198.405 –225.299 –228.891 ll_FullModel –191.196 –165.747 –187.737 –187.768 VIF 1.73
Notes: Marginal Effects dy/dx; Standard errors in parentheses; * p < 0.10, ** p < 0.05, *** p < 0.01; Var-iance Inflation Factor (VIF): critical threshold of 10 for multicollinearity presence. Reference category for sectors: DB, DC, DE. Reference category for size: more than 249 employees.
First of all, the results reported in Table 4 do not fully support the set of three hypoth-eses. For the whole sample of firms, the evidence does not support H1: there is no comple-mentary relationship between ICT and organizational changes, although substitutability does not emerge either. As far as H2 and H3 are concerned, we have mixed evidence. On the one hand, complementarities arise between technological innovation and both adoption of ICT management systems (ICTSYSINTRO_D/TECHNO_D) and ICT for cooperation with clients and suppliers (ICT_COOP_D/TECHNO_D) on EMASISO and CO2 respec-tively, not rejecting H3, although the relation of substitutability between the cooperation activity of the firm with universities and research organizations (COOPUNIORG_D) with both MRP and ERP possibly undermine the (just now) mentioned complementarities emerging between technological innovation (TECHNO_D) and two types of ICT mea-sures on the probability to adopt CO2 emissions abating technologies. On the other hand, substitutability on EIs introduced for emission reduction emerges for a specific type of ICT managerial system (MRP) when jointly adopted with training programs (TRAIN_D), thus rejecting H2 for this specific case. This mixed evidence for the whole sample is a signal that EI is weakly integrated within the core set of firm’s innovative actions. When we focus the attention on the most polluting sectors (Table 5), which are relatively more exposed to environmental policies (e.g. the EU ETS), both complementarity and substitutability emerge in a strong fashion relatively to the EIs introduced to reduce CO2 emission, which is not by chance the objective of the ETS. In this case it seems that firms likely subjects to environmental policies strive to complement their innovation strategies in order to gain advantages in EIs performance, but they sometimes fail in the attempt to integrate innova-tion strategies. In particular, H3 seems to be selectively not rejected, because while some complementarities emerge between ICT and technological innovation, they are not present and, in addition, they are replaced by substitution effects when ICT and cooperation for innovation are considered.
Overall, though the economies of scale and valuable integration effects that comple-mentarity might generate when is placed at center of firm’s strategies, it confirms to be a marginal factor when large numbers of firms are taken into account. Firms do tend to pursue innovative actions through non-integrated strategies. Even firms that are more exposed to policies do not use complementarity as a way to increase their efficiency and effectiveness.
Though we cannot say that ICT and EI are uncorrelated factors (see section 2.1 and works as Cainelli et al. 2012), this relationship seems to be detached from the full techno- organisational change regime of a firm. We believe this result has important implications for both managers and policy makers. Overall, this paper show that potential complemen-tarity between a general purpose technologies like ICT and other drivers of eco-innovation may exist, but they are still not exploited to a great extent. Therefore, managers must be conscious of the possibility of using these complementarities to enhance their environmen-tal innovation strategy, while policy makers should be aware that program for the diffu-sion of ICTs can have a wider value than expected. We encourage further analysis through surveys that originally investigate other and more refined EI and ICT components.
Ta ble 4. C om plem en ta rit ies t es ts in a di scr et e s et tin g. L in ea r r es tr ic tio n o n s ta tes o f t he w or ld co efficien ts f ro m p ro bi t r eg res sio ns (N = 555) ICT_D/INN O_D va ria bles ENER GY CO2 EMISS IO NS EMA SISO (M ea n va lue u se d fo r dico to mi sa tio n) W ald test§ Ad ju ste d p-va lue f or H_0: co eff . 11 + 00 >= co eff .10 + 01 Sig n o f th e lin ea r co m bin at io n (b1 + b4) + (–b2 – b3) W ald test§ Ad ju ste d p-va lue f or H_0: co eff . 11 + 00 >= co eff .10 + 01 Sig n o f th e lin ea r co m bin at io n (b1 + b4) + (–b2 – b3) W ald test§ Ad ju ste d p-va lue f or H_0: co eff . 11 + 00 >= co eff .10 + 01 Sig n o f th e lin ea r co m bin at io n (b1 + b4) + (–b2 – b3) W ald tes t§ Ad ju ste d p-va lue f or H_0: co eff . 11 + 00 >= co eff .10 + 01 Sig n o f th e lin ea r co m bin at io n (b1 + b4) + (–b2 – b3) ICT SY SINTR O_D O RG_D 0 0.5 ≤0 0.07 0.61 ≥0 0.06 0.41 ≤0 0.04 0.57 ≥0 ICT SY SINTR O_D TR AIN_D 0.33 0.28 ≤0 0.81 0.18 ≤0 0.69 0.2 ≤0 0.28 0.7 ≥0 ICT SY SINTR O_D TECHN O_D 0 0.52 ≥0 0.04 0.41 ≤0 0.04 0.42 ≤0 3.12* 0.97 ≥0 ICT SY SINTR O_D CO O PUNI O RG_D 0.01 0.53 ≥0 1.36 0.12 ≤0 2.11 0.07 ≤0 0.75 0.19 ≤0 ICT_P RO D _D O RG_D 0.82 0.18 ≤0 1.88 0.91 ≥0 0 0.45 ≤0 0.22 0.31 ≤0 ICT_P RO D _D TR AIN_D n.f . n.f . n.f . 0.47 0.75 ≥0 0.88 0.17 ≤0 0.01 0.54 ≥0 ICT_P RO D _D TECHN O_D 1.58 0.89 ≥0 0.41 0.74 ≥0 0.13 0.36 ≤0 0.04 0.42 ≤0 ICT_P RO D _D CO O PUNI O RG_D 0.03 0.57 ≥0 1.8 0.91 ≥0 1.37 0.88 ≥0 1.45 0.88 ≥0 ICT_C O O P_D O RG_D 0.6 0.78 ≥0 2.04 0.92 ≥0 0.01 0.54 ≥0 0.22 0.68 ≥0 ICT_C O O P_D TR AIN_D 0 0.5 ≥0 0.21 0.48 ≥0 0.01 0.52 ≥0 0.12 0.36 ≤0 ICT_C O O P_D TECHN O_D 1.7 0.9 ≥0 5.16** 0.98 ≥0 3.45* 0.96 ≥0 0.82 0.81 ≥0 ICT_C O O P_D CO O PUNI O RG_D 0.02 0.44 ≤0 0.05 0.59 ≥0 0.63 0.21 ≤0 0.37 0.27 ≤0 MRP O RG_D 0.68 0.2 ≤0 0.9 0.17 ≤0 0.83 0.18 ≤0 0.02 0.45 ≤0 MRP TR AIN_D 1.5 0.11 ≤0 2.74* 0.05 ≤0 2.13 0.07 ≤0 0.17 0.34 ≤0 MRP TECHN O_D 0.35 0.27 ≤0 0.04 0.42 ≤0 0.06 0.6 ≥0 1.14 0.85 ≥0 MRP CO O PUNI O RG_D 2.57 0.054 ≤0 6.3** 0.006 ≤0 5.38** 0.01 ≤0 4.23 0.2 ≤0 ERP O RG_D 0 0.51 ≥0 0.07 0.6 ≥0 0.1 0.38 ≤0 0.25 0.69 ≥0 ERP TR AIN_D 0.04 0.42 ≤0 0.13 0.36 ≤0 0.34 0.28 ≤0 0.02 0.56 ≥0 ERP TECHN O_D 0.14 0.64 ≥0 0.43 0.74 ≥0 0.47 0.75 ≥0 1.29 0.87 ≥0 ERP CO O PUNI O RG_D 1.07 0.15 ≤0 2.6 0.05 ≤0 4.4** 0.02 ≤0 0.68 0.2 ≤0 § S in ce w e a re t es tin g o ne lin ea r r es tr ic tio n a t a t im e t he C hi2 di str ib ut io n h as 1 deg re e o f f re edo m a s t he n um ber o f t he lin ea r r es tr ic tio ns. ^ Cr itic al va lues o f C hi2(1) di str ib ut io n: 6.63, 3.84 a nd 2.71 (***1%, ** 5% a nd * 10% le ve l o f sig nific an ce r es pe ct iv ely); N = 555. Sig nific an ce sig na ls t ha t w e m ay r ej ec t t he n ul l o f a bs en ce o f co m plem en ta rit y. (b1 + b4) + (–b2 – b3) ≥ 0 i s in dex o f s up er m od ul ar ity . (b1 + b4) + (–b2 – b3) < 0 i s in dex o f s ub m od ul ar ity . No te : T es ts a re co nd uc te d o n m ar gin al eff ec ts; n.f . m ea ns t ha t t he W ald t es t i s n ot f ea sib le b ec au se s pe cific s ta tes o f t he w or ld a re dr op pe d, sin ce t he y p re dic t fa ilur e (0) o r s ucces s (1) o f th e dep en den t va ria ble p er fe ct ly.
Ta ble 5. C om plem en ta rit ies t es ts in a di scr et e s et tin g. L in ea r r es tr ic tio n o n s ta tes o f t he w or ld co efficien ts f ro m p ro bi t r eg res sio ns. Po llu tin g s ec to rs (N = 183) ICT_D/INN O_D va ria bles ENER GY CO2 EMISS IO NS EMA SISO (M ea n va lue u se d f or dico to mi sa tio n) W ald test§ Ad ju ste d p-va lue f or H_0: co eff . 11 + 00 >= co eff .10 + 01 Sig n o f th e lin ea r co m bin at io n (b1 + b4) + (–b2 – b3) W ald test§ Ad ju ste d p-va lue f or H_0: co eff . 11 + 00 >= co eff .10 + 01 Sig n o f th e lin ea r co m bin at io n (b1 + b4) + (–b2 – b3) W ald test§ Ad ju ste d p-va lue f or H_0: co eff . 11 + 00 >= co eff .10 + 01 Sig n o f th e lin ea r co m bin at io n (b1 + b4) + (–b2 – b3) W ald tes t§ Ad ju ste d p-va lue f or H_0: co eff . 11 + 00 >= co eff .10 + 01 Sig n o f th e lin ea r co m bin at io n (b1 + b4) + (–b2 – b3) ICT SY SINTR O_D O RG_D 1.64 0.1 ≤0 0.64 0.21 ≤0 0.57 0.22 ≤0 0.14 0.35 ≤0 ICT SY SINTR O_D TR AIN_D n.f . n.f . n.f . n.f . n.f . n.f . n.f . n.f . n.f . n.f . n.f . n.f . ICT SY SINTR O_D TECHN O_D 2.68 0.95 ≥0 0.62 0.78 ≥0 0.62 0.78 ≥0 n.f . n.f . n.f . ICT SY SINTR O_D CO O PUNI O RG_D 0 0.51 ≥0 6.24** 0.006 ≤0 0.46 0.25 ≤0 1.19 0.14 ≤0 ICT_P RO D _D O RG_D 0.79 0.18 ≤0 0.83 0.81 ≥0 0.51 0.23 ≤0 1.52 0.11 ≤0 ICT_P RO D _D TR AIN_D n.f . n.f . n.f . 0.45 0.74 ≥0 n.f . n.f . n.f . n.f . n.f . n.f . ICT_P RO D _D TECHN O_D 2.49 0.94 ≥0 2.88* 0.95 ≥0 1.03 0.84 ≥0 0.87 0.82 ≥0 ICT_P RO D _D CO O PUNI O RG_D 0.05 0.41 ≤0 0 0.52 ≥0 0.44 0.25 ≤0 0.73 0.2 ≤0 ICT_C O O P_D O RG_D 0 0.49 ≤0 2.16 0.92 ≥0 0.49 0.24 ≤0 0.49 0.24 ≤0 ICT_C O O P_D TR AIN_D n.f . n.f . n.f . 0.11 0.63 ≥0 n.f . n.f . n.f . n.f . n.f . n.f . ICT_C O O P_D TECHN O_D 2.17 0.92 ≥0 3.62* 0.97 ≥0 1.89 0.91 ≥0 0.43 0.74 ≥0 ICT_C O O P_D CO O PUNI O RG_D 0.83 0.18 ≤0 0.09 0.38 ≤0 1.58 0.1 ≤0 0.68 0.2 ≤0 MRP O RG_D 1.07 0.15 ≤0 0.4 0.26 ≤0 0 0.5 ≤0 0.09 0.38 ≤0 MRP TR AIN_D n.f . n.f . n.f . n.f . n.f . n.f . n.f . n.f . n.f . n.f . n.f . n.f . MRP TECHN O_D 0.04 0.58 ≥0 0.12 0.37 ≤0 0.36 0.73 ≥0 n.f . n.f . n.f . MRP CO O PUNI O RG_D 0.01 0.47 ≤0 6.48** 0.005 ≤0 0.16 0.35 ≤0 1.34 0.12 ≤0 ERP O RG_D 0.55 0.22 ≤0 0.01 0.45 ≤0 0.97 0.16 ≤0 0.02 0.56 ≥0 ERP TR AIN_D n.f . n.f . n.f . n.f . n.f . n.f . n.f . n.f . n.f . n.f . n.f . n.f . ERP TECHN O_D 1.78 0.9 ≥0 0.6 0.78 ≥0 1.26 0.87 ≥0 2.88* 0.96 ≥0 ERP CO O PUNI O RG_D 0 0.5 ≥0 4.02** 0.02 ≤0 0.76 0.19 ≤0 0.33 0.71 ≥0 § S in ce w e a re t es tin g o ne lin ea r r es tr ic tio n a t a t im e t he C hi2 di str ib ut io n h as 1 deg re e o f f re edo m a s t he n um ber o f t he lin ea r r es tr ic tio ns. ^ Cr itic al va lues o f C hi2(1) di str ib ut io n: 6.63, 3.84 a nd 2.71 (***1%, ** 5% a nd * 10% le ve l o f sig nific an ce r es pe ct iv ely); N = 555. Sig nific an ce sig na ls t ha t w e m ay r ej ec t t he n ul l o f a bs en ce o f co m plem en ta rit y. (b1 + b4) + (–b2 – b3) ≥ 0 i s in dex o f s up er m od ul ar ity . (b1 + b4) + (–b2 – b3) < 0 i s in dex o f s ub m od ul ar ity . No te : T es ts a re co nd uc te d o n m ar gin al eff ec ts; n.f . m ea ns t ha t t he W ald t es t i s n ot f ea sib le b ec au se s pe cific s ta tes o f t he w or ld a re dr op pe d, sin ce t he y p re dic t fa ilur e (0) o r s ucces s (1) o f t he dep en den t va ria ble p er fe ct ly.
Conclusions
The paper enriches the evidence around eco innovation adoption by firms by introducing the role of ICT as a main correlated factor. ICTs are a prominent technological pillar to achieve a decarbonisation of the economy. Their effective role within firms green strate-gies is nevertheless somewhat overlooked, often due to paucity of data. In addition, we use the lens of complementarity theory to assess whether the synergies between different innovative firm strategies are possibly behind the adoption of EIs, namely whether EIs are adopted more as an isolated factor or as an output of a more integrated strategy that pursue sustainability and competitiveness by bundling together different ICT and techno-organisational innovations.
We find that ICT introduced to efficiently manage the process and product related strategies of manufacturing firms are likely to induce the adoption of EIs. In addition, complementarity is nevertheless present only in few cases. The result interestingly enough tends to be stronger for the sub-sample of more polluting firms, which cope with more radical challenges in relation to environmental issues. This mixed evidence suggests that EI is still weakly integrated within firm’s strategy, especially when they do not have to comply with stringent environmental regulations. On the other hand, firms that strive to tackle environmental targets, try to introduce ICT integrated with techno-organisational changes also as a “support” strategy to eco innovations.
Further research might focus on the complementarity between ICT and EI as an “asset” promoting higher economic and environmental performances. Micro and meso level data might be used for that aim.
Acknowledgements
This paper is based on work carried out in the EMInInn research project, funded by the European Union under the 7th Framework Programme for Research (Grant Agreement No. 283002, www.emininn.eu).
The authors acknowledge financial support of the Italian National Research Project PRIN-MIUR 2010-11 “Climate changes in the Mediterranean area: scenarios, mitigation policies and technological innovation” (2010S2LHSE_002). Usual disclaimers apply. References
Antonelli, C.; Quatraro, F. 2010. The effects of biased technological change on total factor productiv-ity: empirical evidence from a sample of OECD countries, Journal of Technology Transfer 35(4): 361–383. http://dx.doi.org/10.1007/s10961-009-9134-2
Antonioli, D.; Mancinelli, S.; Mazzanti, M. 2013. Are Environmental Innovations embedded within or-ganizational change?, Research Policy 42(4): 975–988. http://dx.doi.org/10.1016/j.respol.2012.12.005
Berkhout, F.; Hertin, J. 2004. De-materialising and re-materialising: digital technologies and the envi-ronment, Futures 36(8): 903–920. http://dx.doi.org/10.1016/j.futures.2004.01.003
Borghesi, S.; Cainelli, G.; Mazzanti, M. 2012. Brown sunsets and green dawns in the industrial sector. Nota di lavoro n. 2012.003, FEEM, Milan.
Borghesi, S.; Cainelli, G.; Mazzanti, M. 2015. Linking emission trading to environmental innovation: evidence from the Italian manufacturing industry, Research Policy 44(3): 669–683.
http://dx.doi.org/10.1016/j.respol.2014.10.014
Bresnahan, T. F.; Trajtenberg, M. 1995. General purpose technologies “Engines of growth”?, Journal of Econometrics 65(1): 83–108. http://dx.doi.org/10.1016/0304-4076(94)01598-T
Brunnermeier, S. B.; Cohen, M. A. 2003. Determinants of environmental innovation in US manufactur-ing industries, Journal of Environmental Economics and Management 45(2): 278–293.
http://dx.doi.org/10.1016/S0095-0696(02)00058-X
Cainelli, G.; Mazzanti, M.; Montresor, S. 2012. Environmental innovations, internationalization and local factors, Industry and Innovation 19(8): 697–734.
http://dx.doi.org/10.1080/13662716.2012.739782
Cecere, G.; Corrocher, N.; Gossart, C.; Ozman, M. 2012. Patterns of Innovation in green ICT: a pat-ent based analysis [online], [cited 30 November 2013]. Available from Internet: http://ssrn.com/ abstract=2117831
Cleff, T.; Rennings, K. 1999. Determinants of environmental product and process innovation, European Environment 9(5): 191–201.
http://dx.doi.org/10.1002/(SICI)1099-0976(199909/10)9:5<191::AID-EET201>3.0.CO;2-M
Consoli, D.; Rentocchini, F. 2014. A taxonomy of multi-industry labour force skills, Research Policy 44(5): 1116–1132. http://dx.doi.org/10.1016/j.respol.2014.12.005
Costantini, V.; Mazzanti, M. 2012. On the green and innovative side of trade competitiveness? The impact of environmental policies and innovation on EU exports, Research Policy 41(1): 132–153.
http://dx.doi.org/10.1016/j.respol.2011.08.004
De Marchi, V. 2012. Environmental Innovation and R&D cooperation: empirical evidence from Spanish manufacturing firms, Research Policy 41(3): 614–623. http://dx.doi.org/10.1016/j.respol.2011.10.002
Del Rio Gonzalez, P. 2009. The empirical analysis of the determinants for environmental technological change: a research agenda, Ecological Economics 68(3): 861–878.
http://dx.doi.org/10.1016/j.ecolecon.2008.07.004
Díaz-Chao, Á.; Sainz-González, J.; Torrent-Sellens, J. 2015. ICT, innovation, and firm productivity: new evidence from small local firms, Journal of Business Research 68(7): 1439–1444.
http://dx.doi.org/10.1016/j.jbusres.2015.01.030
EEA. 2015. Assessment of global megatrends – an update. Global megatrend 4: accelerating technological change. EEA, Copenhagen.
EMAS. 2009. Regulation of the European Parliament and of the Council No.1221/2009 on the voluntary participation by organization in a Community eco-management and audit scheme.
Frey, M.; Iraldo, F.; Testa, F. 2011. The determinants of eco innovation in green supply chains: evidence form an Italian sectoral study, Working Paper n. 03/2011. Istituto di Management – Scuola Supe-riore Sant’Anna di Pisa.
Frondel, M.; Horbach, J.; Rennings, K. 2004. End-of-pipe or cleaner production? An empirical comparison of environmental innovation decisions across OECD countries. Discussion Paper No. 04-82, Centre for European Economic Research.
Gilli, M.; Mancinelli, S.; Mazzanti, M. 2014. Innovation complementarity and environmental productiv-ity effects: realproductiv-ity or delusion? Evidence from the EU, Ecological Economics 103: 56–67.
http://dx.doi.org/10.1016/j.ecolecon.2014.04.004
Hall, B.; Lotti, F.; Mairesse, J. 2009. Innovation and productivity in SMEs: empirical evidence for Italy, Small Business Economics 33(1): 13–33. http://dx.doi.org/10.1007/s11187-009-9184-8
Hall, B.; Lotti, F.; Mairesse, J. 2013. Evidence on the impact of R&D and ICT investment on innovation and productivity in Italian firms, Economics of Innovation and New Technology 22(3): 300–328.
Horbach, J.; Rennings, K. 2012. Environmental innovation and employment dynamics in different tech-nology fields: an analysis based on the German community innovation survey 2009. Discussion Paper 12-006, Centre for European Economic Research.
Horbach, J. 2008. Determinants of environmental innovation – new evidence from German panel data sources, Research Policy 37(1): 163–173. http://dx.doi.org/10.1016/j.respol.2007.08.006
ISO 14001:2015. Environmental Management Systems. International Organization for Standardization, Geneva, Switzerland.
Jaffe, A.; Palmer, K. 1997. Environmental regulation and innovation: a panel study, The Review of Eco-nomics and Statistics 79(4): 610–619. http://dx.doi.org/10.1162/003465397557196
Jaffe, A. B.; Newell, R. G.; Stavins, R. N. 2002. Environmental policy and technological change, Environ-mental and Resource Economics 22(1): 41–69. http://dx.doi.org/10.1023/A:1015519401088
Johnstone, N.; Haščič, I.; Poirier, J.; Hemar, M.; Michel, C. 2012. Environmental policy stringency and technological innovation: evidence from survey data and patent counts, Applied Economics 44(17): 2157–2170. http://dx.doi.org/10.1080/00036846.2011.560110
Kemp, R. 2010. Eco-innovation: definition, measurement and open research issues, Economia Politica 27(3): 397–420.
Malerba, F.; Orsenigo, L. 1997. Technological regimes and sectorial patterns of innovative activities, Industrial and Corporate Change 6(1): 83–117. http://dx.doi.org/10.1093/icc/6.1.83
Malerba, F. (Ed.) 2004. Sectoral systems of innovation: concept; issues and analysis of six major sectors in Europe. Cambridge: Cambridge University Press. http://dx.doi.org/10.1017/CBO9780511493270
Mancinelli, S.; Mazzanti, M. 2009. Innovation, networking activities and complementarity empirical evidence on SME performances for a local economic system in Northern Italy, Annals of Regional Sciences 43(3): 567–597. http://dx.doi.org/10.1007/s00168-008-0255-6
Mazzanti, M.; Zoboli, R. 2008. Complementarity, firm strategies and environmental innovations, Envi-ronmental Sciences 5(1): 17–40. http://dx.doi.org/10.1080/15693430701859638
Mazzanti, M.; Zoboli, R. 2009. Embedding environmental innovations in local production systems: SME strategies, networking and industrial relations, International Review of Applied Economics 23(2): 169–195. http://dx.doi.org/10.1080/02692170802700500
Milgrom, P.; Roberts, J. 1995. Complementarities and fit strategy, structure, and organizational change in manufacturing, Journal of Accounting and Economics 192(3): 179–208.
http://dx.doi.org/10.1016/0165-4101(94)00382-F
Miravete, E.; Pernìas, J. 2006. Innovation complementarities and scale of production, Journal of Indus-trial Economics 54(1): 1–29. http://dx.doi.org/10.1111/j.1467-6451.2006.00273.x
Mohnen, P.; Röller, L. 2005. Complementarities in innovation policy, European Economic Review 46(6): 1431–1450. http://dx.doi.org/10.1016/j.euroecorev.2003.12.003
Montresor, S.; Vittucci Marzetti, G. 2011. The deindustrialisation/tertiarisation hypothesis reconsidered: a subsystem application to the OECD, Cambridge Journal of Economics 35(2): 401–421.
http://dx.doi.org/10.1093/cje/beq009
OECD. 2009. Measuring the relationship between ICT and the environment. Digital economy paper n. 162. OECD, Paris.
Pavitt, K. 1984 Sectoral patterns of technical change: towards a taxonomy and a theory, Research Policy 13(6): 343–373. http://dx.doi.org/10.1016/0048-7333(84)90018-0
Peneder, M. 2010. Technological regimes and the variety of innovation behaviour: creating integrated taxonomies of firms and sectors, Research Policy 39(3): 323–334.
http://dx.doi.org/10.1016/j.respol.2010.01.010
Rehfeld, K. M.; Rennings, K.; Ziegler, A. 2007. Integrated product policy and environmental product innovations: an empirical analysis, Ecological Economics 61(1): 91–100.
Rennings, K.; Rexhauser, S. 2010. Snowball effects and time lags of regulation on innovation – cumula-tive impacts of environmental policy phases on companies’ eco-innovacumula-tive activities, in The World Congress of Environmental and Resource Economists, 28 June – 2 July 2010, Montreal.
Rennings, K.; Ziegler, A.; Ankele, K.; Hoffmann, E.; Nill, J. 2006. The influence of different charac-teristics of the EU environmental management and auditing scheme on technical environmental innovations and economic performance, Ecological Economics 57(1): 45–59.
http://dx.doi.org/10.1016/j.ecolecon.2005.03.013
Roberts, J. 2006. The modern firm: organizational design for performance and growth. Oxford: Oxford University Press.
Roper, S.; Du, J.; Love, J. H. 2008. Modelling the innovation value chain, Research Policy 37(6): 961–977.
http://dx.doi.org/10.1016/j.respol.2008.04.005
Triguero, A.; Moreno-Mondejar, L.; Davia, M. A. 2013. Drivers of different types of eco-innovation in European SMEs, Ecological Economics 92: 25–33. http://dx.doi.org/10.1016/j.ecolecon.2013.04.009
Veugelers, R. 2012. Which policy instrument to induce clean innovating?, Research Policy 41(10): 1770– 1778. http://dx.doi.org/10.1016/j.respol.2012.06.012
Wagner, M. 2008. Empirical influence of environmental management on innovation: evidence from Europe, Ecological Economics 66(2–3): 392–402. http://dx.doi.org/10.1016/j.ecolecon.2007.10.001
Ziegler, A.; Rennings, K. 2004. Determinants of environmental innovations in Germany: do organiza-tional measures matter? A discrete choice analysis at the firm level. Discussion Paper 04.03, Centre for European Economic Research.
APPENDIX A
Fig. A1. The Emilia Romagna Region (5 millions inhabitants, GDP per capita 33,000€, 18% Italian industry GDP) 10 30 Kilometres Technological innovation Training Organisational change Environmental innovation Internationalisation ICT –0.10.0 0.1 0.2 0.3 0.4 0.5 0.6
Table A1. State of the world distribution
States of the world (555 obs.)
whole sample % States of the world (183 obs.) polluting sectors % (1.1) (1.0) (0.1) (0.0) (1.1) (1.0) (0.1) (0.0) ICTSYSINTRO _D ORG_D 23.60 20.54 18.55 37.29 13.11 16.93 27.86 42.07 ICT_PROD _D ORG_D 33.69 32.25 8.46 25.58 29.50 33.33 11.47 25.68 ICT_COOP _D ORG _D 29.00 34.59 13.15 23.24 25.68 33.87 15.30 25.13 MRP ORG _D 18.37 17.29 23.78 40.54 8.74 13.66 32.24 45.35 ERP ORG _D 25.76 21.80 16.39 36.03 18.03 19.12 22.95 39.89 ICTSYSINTRO _D TRAIN_D 16.75 27.38 20.90 34.95 10.38 19.67 34.42 35.55 ICT_PROD _D TRAIN_D 27.92 38.01 9.72 24.32 29.50 33.33 15.30 21.85 ICT_COOP _D TRAIN_D 26.30 37.29 11.35 25.04 28.41 31.14 16.39 24.04 MRP TRAIN_D 14.05 21.62 23.60 40.72 8.19 14.20 36.61 40.98 ERP TRAIN_D 18.73 28.82 18.91 33.51 16.93 20.21 27.86 34.97 ICTSYSINTRO _D TECH_D 34.41 9.72 36.03 19.81 23.49 6.55 45.35 24.59 ICT_PROD _D TECH_D 49.90 16.03 20.54 13.51 46.99 15.84 21.85 15.30 ICT_COOP _D TECH_D 46.84 16.75 23.60 12.79 45.35 14.20 23.49 16.93 MRP TECH_D 29.18 6.48 41.26 23.06 19.67 2.73 49.18 28.41 ERP TECH_D 36.93 10.63 33.51 18.91 27.32 9.83 41.53 21.31 ICTSYSINTRO _D COOPUNIORG 26.30 17.83 20.90 34.95 12.56 17.48 24.59 45.35 ICT_PROD _D COOPUNIORG 34.77 31.17 12.43 21.62 24.59 38.25 12.56 24.59 ICT_COOP _D COOPUNIORG 31.17 32.43 16.03 20.36 21.85 37.70 15.30 25.13 MRP COOPUNIORG 21.44 14.23 25.76 38.55 8.74 13.66 28.41 49.18 ERP COOPUNIORG 28.82 18.73 18.37 34.05 16.39 20.76 20.76 42.07
Table A2. Tetrachoric correlations for binary variables
R&D Org_D Tech_D CoopUniOrg ICT_PROD ICT_COOP
R&D 1 Org_D 0.2823 1 Tech_D 0.4667 0.2302 1 CoopUniOrg 0.4132 0.3018 0.241 1 ICT_PROD 0.2386 0.4086 0.2628 0.2485 1 ICT_COOP 0.2409 0.1495 0.1545 0.0767 0.5642 1
Table A3. Correlations for non-binary variables
INTERN_OPEN TrainCov OrgIndex ICT_INTRO
INTERN_OPEN 1
TrainCov 0.0844 1
OrgIndex 0.1424 0.2763 1
APPENDIX B
Selected questions for ICT and EI variables construction. The answers refer to the period 2006–2008.
Environmental Innovation (EI)
Q1: Did the firms adopt “environmental” products and/or process technological innova-tions that induced the following benefits?
Yes/No 1. Reduction in the use of materials and/or energy by output unit (including
recycling)
2. CO2 emissions reduction
3. Emission reductions that improve the quality of soil, water and air
ENERGY = 1 if Reduction in the use of materials and/or energy by output unit (included recycling) marked as Yes; 0 otherwise.
CO2 = 1 if CO2 emissions reduction marked as Yes; 0 otherwise.
EMISSIONS = 1 if Emission reductions that improve the quality of soil, water and air; 0 otherwise.
Q2: Does the firm have procedures that structurally identify its environmental perfor-mance?
Procedure Yes/No
1. EMAS 2. ISO 14001
3. Others such as LCA, ISO 14040, ………..(specify)
EMASISO = 1 if EMAS or ISO 14001 or Others is marked as Yes; 0 otherwise. ICT
Q3. Which types of management systems and network integration did you adopt? Yes/No 1. Management information system
2. Electronic Data Interchange (EDI) 3. Material Requirements Planning (MRP) 4. Supply Chain Management (SCM)
5. Customer Relationship Management (CRM) 6. Enterprise Resource Planning (ERP)
MRP = 1 if the firm introduced MRP systems: 0 otherwise. ERP = 1 if the firm introduced ERP systems; 0 otherwise. Q4. Which types of activities are supported by ICT?
Yes/No 1. Acquire information and services
2. Provide information and services 3. Manage buy-and-sell orders online
4. Manage the production process and control quality and time 5. Cooperate with clients and suppliers (post-selling services)
ICT_SYSINTRO = (number of the items in Q3 with a positive answer)/(number of all the items in Q3).
ICT_PROD = 1 if the item 4 in Q4 has a positive answer; 0 otherwise. ICT_COOP = 1 if the item 5 in Q4 has a positive answer; 0 otherwise.
Davide ANTONIOLI. Associate Professor at the University “G. d’Annunzio” of Chieti-Pescara, Depart-ment of Business Economics. His main research interests concern technological and organisational innovation, environmental innovations, industrial relations and the evaluation of innovation policy impact. He is author of many papers, published in international peer-reviewed journals.
Marianna GILLI. Postdoctoral Research fellow at the University of Ferrara. Her main research interests concern environmental innovation and technological change. She was awarded a doctorate in Econom-ics from the University of Ferrara and a MSc in StatistEconom-ics and EconometrEconom-ics from the University of Essex, UK.
Massimiliano MAZZANTI. PhD, Associate professor in Economics and Lecturer in Macroeconomics and Environmental Economics and Policy at the University of Ferrara, Italy. He graduated at the Uni-versity of Bologna (Italy) with a dissertation on ecological tax reforms, then he continued the education with a MSc in Environmental and Natural Resources Economics at the Department of Economics, UCL London, awarded with distinction and finally got a PhD in Economics at the University of Roma Tre in 2002 with studies on the economic evaluation of public goods. He is also lecturer at the University of Bologna in public economics, environmental economics, culture economics at the Faculties of law and arts. He has collaborated as research fellow with the IRCrES CNR institute of the National Research Council since 1999. Main research fields and publications deal with environmental policy, economics of innovation, economic performance and innovation, economic evaluation by stated preference tech-niques, waste management and policy, climate change and development. He is author of many books and papers, published in international peer-reviewed journals. He has the responsibility for SEEDS’ participation to the FP7 project CECILIA 2050.
Francesco NICOLLI. Postdoctoral research fellow at IRCrES (Institute of Research on firm and Growth of the National Research Council). His main research interest hinge on econometric analysis of envi-ronmental policy and technological change. He was awarded a doctorate in Applied Economics from the University of Ferrara, and received a MSc in environmental and resource Economics from the University of Birmingham, UK.