UNIVERSITÀ DEGLI STUDI DELLA TUSCIA DI VITERBO DIPARTIMENTO DI SCIENZE AGRARIE E FORESTALI
Corso di Dottorato di Ricerca in
Ecosistemi e Sistemi Produttivi –XXIX° Ciclo.
INTERMEDIATE TEMPERATURE SOLID OXIDE FUEL CELLS FED WITH SYNGAS: AN EVALUATION OF ELECTROCHEMICAL PHENOMENA
s.s.d. ING-IND/09
Tesi di dottorato di:
Dott. Davide Pumiglia
Coordinatore del corso Tutore
Prof. Alessandro Sorrentino Prof. Maurizio Carlini
Co-tutore
Dott. Stephen J. McPhail
3
ABSTRACT
One of the most interesting features of Solid Oxide Fuel Cells (SOFCs) is the capability to produce electrical and thermal energy starting from syngas sources, such as the gasification of biomass or the reforming of natural gas, with uncommonly high efficiencies.
Stable and safe operation of SOFC systems fed with syngas is currently an issue, under determined operating conditions, the endurance performance of the cell can be hindered, even to the point of critical failure. The number and the complexity of the intertwined chemical, electrochemical and thermo-fluid dynamic mechanisms driving the energy conversion of syngas into electrical power and heat call for more accurate analysis tools and techniques so as to correctly address the role of these mechanisms in the immediate and endurance performance, and thus going beyond the state-of-art.
An in-depth characterization of the processes occurring within SOFCs operating with syngas has been achieved by means of homogeneous testing protocols, innovative testing equipment and complex analysis methods, some of them applied while in operando.
The Distribution of Relaxation Times (DRT) method applied to Electrochemical Impedance Spectroscopy (EIS) measurements carried out over a wide range of operating conditions allowed the recognition of the single physicochemical processes and their contribution to the overall performances, the estimation of parameters related to the different processes, and the evaluation of degradation effects caused by a long operation of SOFC fed with clean and contaminated syngas.
Measurements with an innovative, in-house built experimental set-up, allowing to perform localized sampling of gas compositions and temperatures directly in operando have been realized, optimized and employed in the study of the thermal and concentration gradients arising along the anode surface. Chemical and thermal mapping of the anode surface have been obtained under different operating conditions, both with hydrogen and syngas fuels, highlighting the evolution, the competition and the impact of the different reactions with a spatial resolution. The obtained results provide an in-depth picture of the most important factors affecting the overall performances of syngas-fed SOFC cells, opening new perspectives for the investigation of SOFC systems.
5
ACKNOWLEDGEMENTS
The work hereby presented, that concludes my PhD course, could not have been taken shape without the contribution of those who guided, accompanied and supported me throughout this long path.
First and foremost, I would like to thank my supervisor, Prof. Maurizio Carlini, for giving me this opportunity and for his essential support during the entire PhD course.
I am deeply grateful to Dr. Eng. Stephen J. McPhail who, as my co-supervisor, mentor and friend, has promoted my professional and personal development with constant and unconditioned trust.
I would also like to thank all ENEA researchers I have had the pleasure to collaborate with, for their precious contributions to this work.
To my PhD colleague and childhood friend Andrea, who has shown me how good friends always get together again.
To my colleagues, to have shared with me joy and sorrow of the lab but, above all, because I have found in you more than just good colleagues, I have found precious friends.
To all of my friends, old and new, for having sustained and borne me: now that I would like to thank you one by one, I realize that you are so many, that I am really lucky for having you in my life, and that I am too lazy to write something profound for each one of you!
To my family, for sustaining and trusting me every day during these last years, as you have done for every day of my life.
7
Contents
1. INTRODUCTION 10
1.1. Goals of this work 11
1.2. Outline 12
2. FUNDAMENTALS 13
2.1. Operating principles of Solid Oxide Fuel Cells 13
2.1.1. Cell potential 14
2.1.2. Electrochemical losses 16
2.2. Materials and Design 20
2.2.1. Electrolyte 21 2.2.2. Anode 22 2.2.3. Cathode 23 2.2.4. Interconnects 24 2.2.5. Sealants 25 2.2.6. Tubular SOFCs 25 2.2.7. Planar SOFCs 26 2.3. Fuel Flexibility 28
2.3.1. Non-conventional Fuels: syngas 29
2.3.2. Operation of SOFC with syngas 30
2.3.3. Fuel impurities 32
3. ANALYSIS TOOLS AND TECHNIQUES 34
3.1. Polarization curves 34
3.2. Electrochemical Impedance Spectroscopy (EIS) 35
3.2.1. Principles of EIS 35
3.2.2. EIS measurements on SOFCs 36
3.3. Distribution of Relaxation Times (DRT) method: deconvolution of signals 38
3.4. Complex Non-linear Least Squares (CNLS) fit 43
8
3.4.2. Fitting strategy based on DRT 47
3.5. Other characterization techniques 51
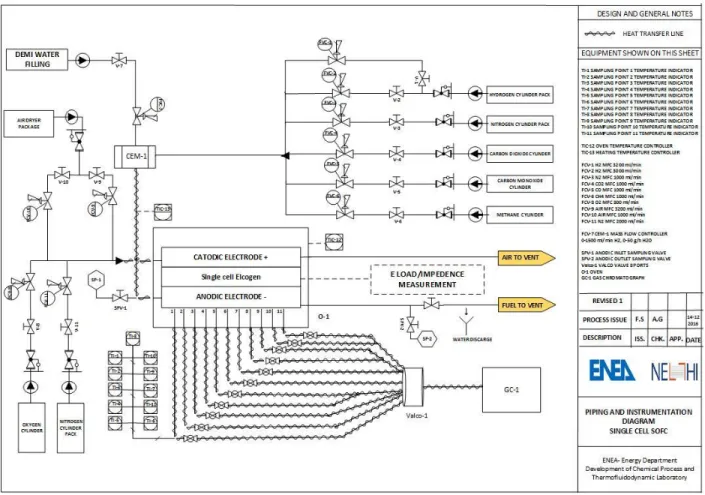
4. EXPERIMENTAL MATERIALS, METHODS AND PROCEDURES 54
4.1. Tested samples 54
4.2. Button cell test station 56
4.3. Multisampling cell housing 57
4.3.1. Design and Realization 57
4.3.2. Materials and Manufacturing 58
4.3.3. Placement and role of components 60
4.3.4. SOFC cell assembly 62
4.4. Single cell test station 64
4.5. Preliminary testing procedures 65
4.5.1. Button cells 65
4.5.2. Single cells 66
4.6. Button cells testing conditions 67
4.6.1. Process identification 67
4.6.2. Endurance performance in syngas 70
4.6.3. Tar contamination 70
4.7. Single cell testing conditions 71
4.7.1. Validation of the multisampling set-up 71
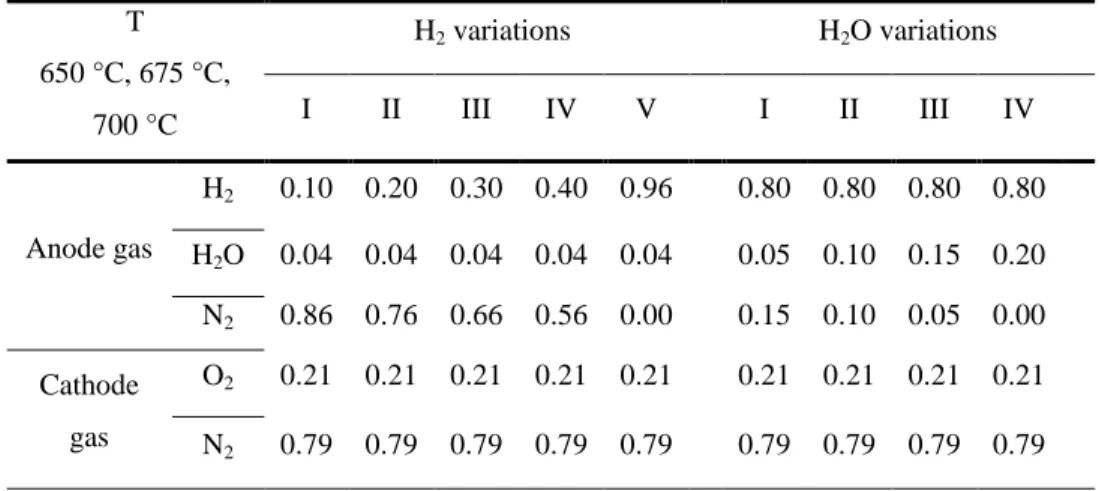
4.7.2. Hydrogen operation 72
4.7.3. Syngas operation 73
5. RESULTS AND DISCUSSION 75
5.1. Process identification 76 5.1.1. Fuel comparison 77 5.1.2. H2/H2O operation 78 5.1.3. CO/CO2 operation 80 5.1.4. Syngas operation 82 5.1.5. Oxygen variation 84
5.1.6. Current load variation 85
5.1.7. Resume of the identified processes 87
9
5.2.1. H2/H2O operation 90
5.2.2. CO/CO2 operation 101
5.2.3. Syngas operation 109
5.2.4. Resume of the estimated parameters 115
5.3. Endurance performance in syngas 117
5.3.1. Degradation of cell performances 117
5.3.2. Post-mortem analysis 120
5.3.3. Resume of endurance performances in syngas 122
5.4. Tar contamination 123
5.4.1. Effects of tar concentration 123
5.4.2. Degradation of cell performances 126
5.4.3. Post-mortem analysis 130
5.4.4. Resume of tar contamination 134
5.5. Reactions evolution on anode surface 135
5.5.1. Validation of the multisampling set-up 137
5.5.2. Hydrogen operation 138
5.5.3. Syngas Operation 141
5.5.4. Resume of the reactions evolution on anode surface 146
6. CONCLUSIONS 148
PUBLICATIONS 152
10
1. INTRODUCTION
Within the recent global efforts to develop a new energy production and distribution market based on the reduction of green house gas emissions 1, reduction of the consumption of fossil fuels, increased generation of power and heat from renewable sources, and enhancement of the energy conversion and distribution efficiency 2, electrochemical power generating systems such as fuel cells are driving in the last 20 years an increasing attention. Among the broad range of fuel cell typologies, Solid Oxide Fuel Cells (SOFCs) result the most promising in terms of global heat and power conversion efficiencies, wide range of applicability and cost effectiveness 3,4. In contrast to most traditional powering systems such as turbines and internal combustion engines, and more so than other fuel cell types, SOFC technology-based devices exhibit high efficiencies regardless of the scale 5. This technology stands out over the rest of its competitors also due to a number of valuable properties. Besides insignificant emissions of NOx, SOx and
particulate matter, very reduced CO2 emissions (only in the case of hydrocarbon fuels), silent and
vibration free operation, the most outstanding property is its fuel flexibility 6, which makes SOFCs attractive for their application with non-conventional fuels, cheaper and more accessible than pure H2.
In fact, thanks to the high operating temperatures (ranging between 600 and 1000°C) and due to the presence of a metal catalyst (generally Ni), the production of electricity and heat may be realized with uncommonly high efficiencies starting from carbon-based fuels, such as natural gas and hydrocarbon fuels, but also from those fuels like syngas and bio-syngas generated from the gasification of coal or biomasses, or from the anaerobic digestion of organic wastes, thus making this technology a fundamental pillar of a novel energy market based on the waste to energy chain7.
Nevertheless, to make this technology competitive with other power generating systems currently present in the market, the next generation of SOFC-based systems must fulfil two important goals: an increased life-span and a considerable reduction of production costs 8.
To achieve these tasks, it is mandatory to have access to a deep comprehension of all the mechanisms occurring within a SOFC while in operation, especially when this device is fed with complex multi-component fuels such as syngas and bio-syngas, where the number of chemical
11
and electrochemical reactions that affect the heat and power generation, and the physical quantities that regulate them, increase.
The possibility to measure physical quantities directly in operando, opens new possibilities to achieve the required characteristics for this technology to enter the energy market in an effective way, by developing new generations of cells based on novel materials and morphologies, tailor the operating conditions to achieve longer and safe operation, especially with carbon-containing fuels such as syngas and bio-syngas, and develop new and reliable predictive computational models based on experimental data able to predict the performance of the fuel cell over a broad range of operative conditions (temperature, pressure, gas composition), and experimentally validate their results.
1.1. Goals of this work
The main goal of this work is to deeply investigate the chemical and electrochemical processes occurring during the operation of a new generation of SOFC, Intermediate Temperature Solid Oxide Fuel Cells, when fed with different syngas compositions.
To do so, along with conventional characterization techniques such as polarization curves and electrochemical impedance spectroscopy (EIS), novel analysis tools and techniques are presented, developed and employed in this work: the first one is a deconvolution method for EIS measurements known as Distribution of Relaxation Times (DRT), that allows a clear identification of the single processes contributing to the overall polarization losses of the cell. The second one is an innovative, in-house built, multisampling set-up which allows the contemporaneous measurements of gas compositions and temperatures with a spatial resolution along the anode surface, making it possible to study the evolution of all the reactions occurring at the fuel electrode and investigating the concentration and thermal gradient arising at different operating conditions.
By means of these two advanced investigating tools, a number of different aspects of the coupling of syngas fuels with IT-SOFC systems were studied, resulting in an in-depth comprehension of the single physicochemical processes and their effect on the overall performances, of the thermal and chemical gradients arising during the operation, and of the degradation effects caused by a long operation with clean and contaminated syngas.. The contents of this doctoral thesis are resumed in the following Section.
12
1.2. Outline
In this work, an initial description of the operating principles of SOFCs, general aspects about the materials and designs related to this technology, and applicability with carbon-based fuels are briefly resumed in Chapter 2.
In Chapter 3 a description of the principal characterization techniques employed in this work is provided, with particular attention dedicated to the novel DRT methodology and all its useful implications in the analysis of the EIS measurements.
The experimental campaigns, the testing procedures, the characteristics of the samples, and the experimental apparatus employed are reported in Chapter 4; within this chapter, the novel multisampling housing developed in-house is described in detail, along with the details of the experimental campaign carried out with it.
In Chapter 5, the experimental results and the discussions related to them are widely reported. In particular, in the first part, the DRT methodology demonstrated to be extremely instrumental in the qualitative separation of all the processes that contribute to the polarization losses within an IT-SOFC fed with three different types of fuels: humidified hydrogen, carbon monoxide, and syngas. Starting from these results, an accurate equivalent circuit model (ECM) was defined and employed in a CNLS fitting procedure over the broad range of experimental spectra collected in different operating conditions, allowing to obtain a set of operating parameters for the three types of fuel employed. The same methodology was than employed in the study of the endurance performances of an IT-SOFC sample fed with a clean syngas, and in the investigations of the poisoning effects of a tar contaminant in the fuel stream.
In the second part, the novel multisampling set-up has been first validated in terms of the cell’s immediate performances, and then was employed in the study of the surface evolution of the reactions at the anode side in both dry H2 and simulated syngas composition coming from the
external steam reforming of natural gas, highlighting interesting aspects about the generation of local thermo-chemical gradients and about the competitiveness of the different reactions with syngas fuel, depending on the operating conditions.
Finally in Chapter 6, the results obtained from the experimental investigations are resumed and some conclusions are provided.
13
2. FUNDAMENTALS
The fundamental aspects of the operating principles of a generic SOFC are summarized in this chapter, with particular attention to those concepts that will be instrumental for the explanation of the experimental results within this work. In particular more details will be provided on the electrochemical loss mechanisms of SOFCs, and on the main reactions and mechanisms occurring in SOFCs fed with non conventional fuels. For more detailed information about the general operating principles of SOFC, the reader is referred to the relevant handbooks 9,10,11.
2.1. Operating principles of Solid Oxide Fuel Cells
Solid oxide fuel cells are electrochemical devices that promote electrochemical conversion of the energy content of a fuel, the most common being H2, directly to electrical and thermal energy,
avoiding the intermediate steps of combustion – thermal energy – mechanical energy – electrical energy, that are present in conventional power generating systems based on internal combustion engines.
In Figure 2.1 a schematic representation of the principal mechanism of operation of a solid oxide fuel cell is depicted. In this representation, it is considered that only pure H2 is provided to the
anode (negative electrode) and air is provided at the cathode (positive electrode).
The fuel (H2) flows through the porous structure of the anode, and reaches the interface with the
electrolyte. In the region known as triple phase boundary (TPB), where the gas, the electronic conducting phase (metal catalyst) and the ionic conducting phase meet, the hydrogen is oxidized at the catalytic active sites to water (H2O) by the oxygen ions (O2-) coming from the electrolyte
layer, releasing 2 electrons (e-) to the external circuit. The electrons are then transferred to the cathode side, where they reduce the oxygen present in the air. Thanks to peculiar properties of the cathode materials (explained in the following Section), the O2- ions pass through the cathode layer and reach the electrolyte layer which, being a ionic conductor, move the O2- ions to the TPB region, where they are ready for the oxidation of the incoming fuel.
What is explained above can be easily summarized considering the electrochemical semi-reactions occurring at the anode and at the cathode side:
14
When H2 is used as a fuel, the anode semi-reaction is described by means of Equation 2.1.
𝐻2 + 𝑂2−⇌ 𝐻2𝑂 + 2𝑒− (2.1)
At the cathode of an SOFC the reduction of oxygen into its anion can be expressed as:
1 2
𝑂2+ 2𝑒−⇌ 𝑂2− (2.2)
The overall electrochemical reaction for the conversion of the fuel to its product is expressed as a sum of the two previous semi-reactions, giving in turn Equation 2.3:
𝐻2 + 1 2 𝑂2 ⇌ 𝐻2𝑂 (2.3)
Figure 2.1 – Schematic representation of a solid oxide fuel cell operating mechanism, considering the oxidation reaction of H2.
2.1.1. Cell potential
The maximum potential difference in a fuel cell is given by the reversible cell potential, which is obtained under thermodynamically reversible conditions.
15
Consider the generic reaction:
𝑎𝐴 + 𝑏𝐵 ⇌ 𝑐𝐶 + 𝑑𝐷 (2.4)
where a, b, c and d are the stoichiometric coefficients of species A, B, C and D respectively.
The Gibbs free energy (ΔG) – which is a function of state – expresses the tendency of a reaction to occur under constant temperature and pressure conditions. When ΔG<0 the reaction is said to be spontaneous hence it is shifted towards the product formation, when ΔG=0 the reaction is in equilibrium and when ΔG>0 the reaction is shifted towards the formation of reactants. The Gibbs free energy can be expressed in terms of the activities of the reactants and products, namely 10:
∆𝐺 = ∆𝐺0+ 𝑅𝑇 𝑙𝑛 𝛾
𝑖
𝑖 [𝑖]𝑘 (2.5)
where ΔG0
is the Gibbs free energy under standard operating temperature and pressure conditions, 𝑅 is the ideal gas constant, 𝑇 the operating temperature, 𝑖 is the concentration of species 𝑖, k its stoichiometric coefficient, considered positive for the products and negative for the reactants, and 𝛾𝑖 its activity coefficient.
For electrochemical devices, and thus for electrochemical reactions, the electrical potential difference E between two electrodes is related to ΔG by the following equation 10:
∆𝐺 = −𝑛𝑒𝐹𝐸 (2.6)
where ne is the number of electrons transferred in the reaction and F is Faraday’s constant.
The Nernst equation combines Eq. (2.5) and Eq. (2.6) in order to obtain the maximum theoretical potential difference in an electrochemical device, specifically 10:
𝐸𝑁 = −∆𝐺 0 𝑛𝑒𝐹+ 𝑅𝑇 𝑛𝑒𝐹𝑙𝑛 𝐴 𝑎 𝐵 𝑏 𝐶 𝑐 𝐷 𝑑 + 𝑅𝑇 𝑛𝑒𝐹𝑙𝑛 𝛾𝐴𝑎·𝛾𝐵𝑏 𝛾𝐶𝑐·𝛾𝐷𝑑 (2.7)
16
The high operating temperatures of SOFCs (700-900 ºC) and the relatively low operating pressures (1-3 bar) allow to approximate the behaviour of the species as ideal gases; hence the activity coefficients take on a value of one and the species concentrations can be replaced by their partial pressures. Considering the overall reaction for the oxidation of H2 reported in Equation 2.3
the open circuit voltage takes on the following expression 10:
𝐸𝑁𝑂𝐶𝑉 = −∆𝐺0 2𝐹 + 𝑅𝑇 2𝐹𝑙𝑛 𝑝𝐻2,𝑏𝑢𝑙𝑘·𝑝𝑂2,𝑏𝑢𝑙𝑘0.5 𝑝𝐻2𝑂,𝑏𝑢𝑙𝑘 (2.8)
Where 𝑝𝑖,𝑏𝑢𝑙𝑘 denotes the partial pressure of species 𝑖 in the bulk composition, that is to say the composition under open circuit voltage (OCV).
2.1.2 Electrochemical losses
When the cell is operating and generating current, a number of different polarization losses caused by irreversible mechanisms make the theoretical Nernst potential of the cell drop to a value of voltage V which depends on the operating point. There are three principal losses: the activation losses, the ohmic losses and the concentration losses. The first and the latter are generated at both the anode and the cathode side, while the ohmic losses encompass the ohmic behavior of all the conducting phases. Each irreversibility generates a so called overpotential 𝜂𝑖, which is subtracted from the maximum theoretical Nernst potential: the resulting cell voltage will be then expressed as follows 11:
Vcell = ENOCV − η
act ,a + ηact ,c − ηohm − ηconc ,a + ηconc ,c − ηleak (2.9)
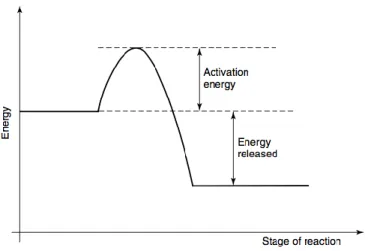
Activation polarization
Activation overpotentials in the anode (ηact,a) and cathode (ηact,c) are associated with overcoming
the energy barriers at the active sites which prevent reactions taking place spontaneously. The larger the activation energy, the bigger the energy supply needed from the reactants to surpass these barriers.
17
Figure 2.2. Schematic diagram of the stages of reaction as a function of the energy 11.
For electrochemical cells, the equation that relates the current density to the overpotential generated at an electrode is the Butler – Volmer equation 10:
𝑗 = 𝑗0 𝑒𝑥𝑝 𝛼𝐹𝜂𝑅𝑇 − 𝑒𝑥𝑝 1−𝛼 𝐹𝜂𝑅𝑇 (2.10)
where 𝑗 is the current density, 𝑗0 is the exchange current density, and 𝛼 is the charge transfer coefficient at the electrode. The exchange current densities are in turn defined as follows, applying an Arrhenius-type equation for both anode and cathode exchange current densities:
𝑗0,𝑎𝑛 = 𝑗0,𝑎𝑛𝑝𝑟𝑒 𝑝𝐻2 𝑝𝐻2,𝑟𝑒𝑓 𝛾𝐻2 𝑝 𝐻2𝑂 𝑝𝐻2𝑂,𝑟𝑒𝑓 𝛾𝐻2𝑂 𝑒𝑥𝑝 −𝐸𝑎𝑐𝑡 ,𝑎𝑛𝑜𝑑𝑒 𝑅𝑇 (2.11) 𝑗0,𝑐𝑎𝑡 = 𝑗0,𝑐𝑎𝑡𝑝𝑟𝑒 𝑝𝑂2 𝑝𝑂2,𝑟𝑒𝑓 𝛾𝑂2 𝑒𝑥𝑝 −𝐸𝑎𝑐𝑡 ,𝑐𝑎𝑡 𝑜𝑑𝑒 𝑅𝑇 (2.12)
where 𝑗0,𝑎𝑛𝑝𝑟𝑒 and 𝑗0,𝑐𝑎𝑡𝑝𝑟𝑒 are the exchange transfer current density pre-exponential factors in the anode and cathode respectively, 𝐸𝑎𝑐𝑡 ,𝑎𝑛𝑜𝑑𝑒 and 𝐸𝑎𝑐𝑡 ,𝑐𝑎𝑡 𝑜𝑑𝑒 the activation energies for anode and cathode, 𝑝𝑖,𝑟𝑒𝑓 the reference partial pressures which can all be considered to be equal to the ambient pressure, and 𝛾𝑖 is the reaction order of species i.
18
When the exchange current density 𝑗0 ≥ 4𝑗0𝑝𝑟𝑒, Equation 2.10 can be simplified and takes on the name of the Tafel equation, which expresses the activation overpotential as a function of the current density:
𝜂𝑎𝑐𝑡 = 𝛼𝑛𝐹𝑅𝑇 ln𝑗𝑗
0 (2.13)
Figure 2.2. Example of a generic Tafel plot 10.
With this linearization it is possible to estimate the values of 𝛼 and of 𝑗0 from the slope and the
intercept of the curve extrapolated for 𝜂 = 0. Ohmic polarization
The ohmic polarization is caused by the conduction of charge through the ionic and electric conductors within the cell. The electrolyte and the electrode layers in a SOFC obey Ohm’s law:
19
Where i is the current and 𝑅𝑜𝑚 contains the contributions of the ionic conduction, the electronic
conduction, and the contact resistance, so that:
𝑅𝑜𝑚 = 𝑅𝑖𝑜𝑛 + 𝑅𝑒𝑙 + 𝑅𝑐𝑜𝑛𝑡 (2.15)
However, in typical SOFCs the resistance associated to the conduction of O2- ions through the electrolyte layer results the major contribution, so that it is generally valid to consider the ohmic contribution to the voltage loss equal to that related to the electrolyte:
𝑅𝑜𝑚 ≅ 𝑅𝑖𝑜𝑛 ≅ 𝑅𝑒𝑙𝑒𝑐𝑡𝑟𝑜𝑙𝑦𝑡𝑒 (2.16)
Concentration polarization
For high utilization factors of the cell, hence for high current densities, the fuel is rapidly consumed in the TPB region; if the request of new H2 at the TPB is higher than that provided by
the diffusion of gas through the porous matrix of the anode, the local undersupply of fuel results in a drop of the cell voltage.
The mass transfer through a porous electrode can be expressed by means of Fick’s first law 10
:
𝑗 =𝑛𝐹 𝐷𝑖(𝐶𝑖𝑏𝑢𝑙𝑘−𝐶𝑖𝑇𝑃𝐵)
𝑙 (2.17)
where 𝐷𝑖 is the diffusion coefficient of the species i, 𝐶𝑖𝑏𝑢𝑙𝑘 and 𝐶𝑖𝑇𝑃𝐵 are the concentrations of
the species i in the bulk of the electrode and at the three phase boundary respectively, and 𝑙 is the thickness of the diffusing layer.
The maximum current, or the limit current, that can theoretically be obtained is when 𝐶𝑖𝑇𝑃𝐵= 0,
so:
𝑗𝐿 = 𝑛𝐹𝐷𝑖𝐶𝑖
𝑏𝑢𝑙𝑘
𝑙 (2.18)
20 𝐶𝑖𝑇𝑃𝐵
𝐶𝑖𝑏𝑢𝑙𝑘 = 1 − 𝑗
𝑗𝐿 (2.19)
By applying the Nernst equation (Equation 2.7), the concentration overpotential can be expressed as: 𝜂𝑐𝑜𝑛𝑐 =𝑅𝑇𝑛𝐹𝑙𝑛 𝐶𝑖𝑇𝑃𝐵 𝐶𝑖𝑏𝑢𝑙𝑘 = 𝑅𝑇 𝑛𝐹𝑙𝑛 1 − 𝑗 𝑗𝐿 (2.20) Leakage overpotential
Electrolytes are never perfectly fully dense gas barriers, thus leading to fuel crossover from anode to cathode reducing the maximum theoretical voltage. Furthermore, these are never ideal electrical insulators, therefore internal currents appear which further increase the Ohmic losses. These effects – fuel crossover and internal currents – are essentially equivalent. The crossing over of one hydrogen molecule from anode to cathode where it reacts, wasting two electrons, amounts to exactly the same as two electrons crossing from anode to cathode internally, rather than as an external circuit.
In Equation 2.9, these contributions are contained in the so-called leakage overpotential (ηleak);
nevertheless these are neglected in many occasions as their effect is insignificant when compared with the rest of overpotentials 11.
2.2. Materials and Designs
Solid oxide fuel cells are, at the state of art, multilayered structures of anode, electrolyte and cathode. Depending on the materials, typology and design of the cell, the operating conditions, their durability and their resistance to fuel contaminants may significantly vary.
Furthermore, when single cells are connected in series to form a stack of the desired power output, other fundamental components are needed: the interconnects layer, or bipolar plates, and, in the case of planar cells, the sealant layers. In the following Sections, a brief description is
21
provided of the most important types and proprieties of the materials employed for the state-of-art SOFC cells and stack, along with the different typologies of cells.
2.2.1. Electrolyte
The general requirements for an electrolyte in an SOFC are high ionic conductivity, null electronic conductivity, chemical stability in both oxidizing and reducing environments, good mechanical proprieties and long term stability. Moreover, the electrolyte layer must be gas tight in order to avoid cross leakage of the fuel and the oxidant gas.
The most conventional material for SOFC electrolytes is the 8YSZ (8YSZ: 8% Yttria-Stabilized Zirconia), which possesses a good conductivity of 0.5 S·cm-1, measured at T = 800°C. Other percentages of Y2O3 content have been tried, but the best performing composition, both in terms
of conductivity values and stability after annealing is the 8% 12,13. Even though its conductivity is not the highest achievable, compared to other candidates for electrolyte materials, it still best matches high conductivity, good thermal expansion coefficient (TEC), good chemical and mechanical stability over a wide range of oxygen partial pressures and temperatures, and at relatively low costs. The nominal operating temperature for cells based on this electrolyte material ranges from 750 to 900 °C, depending on the electrolyte layer thickness.
22
Scandia Stabilized Zirconia (ScSZ) is an alternative to YSZ, especially for use at intermediate temperature, because of its higher conductivity 14,15; until now, however, the lower price and the wider availability of yttria mean that it is much more frequently used as a stabiliser in contrast to scandia.
Another important candidate for the electrolyte material are Gadolinia Doped Ceria (GDC) and Samaria Doped Ceria (SDC) which possess very high ionic conductivity, even at very reduced operating temperature (550 °C). Nevertheless, they also exhibit part of electronic conduction which is attributed to the reduction of Ce4+ to Ce3+ at low oxygen partial pressures, and also the poor sintering proprieties make them react with other cell materials, especially with YSZ when it is employed as a diffusive barrier at the cathode side 16,17.
2.2.2. Anode
The most commonly applied anode material is a Ni/YSZ cermet18, which is a mixture of nickel oxide and YSZ powders that, after the sintering of the material and a reduction procedure during the start-up phase of the cell or stack, results in a final structure in which the skeleton of YSZ stabilizes the porosity of the electrode and provides the separation of finely dispersed metallic Ni particles, that act as a catalyst for the oxidation reaction of the hydrogen. In the most diffused typologies of SOFC cells, the planar anode supported cells (AS-SOFCs), the Ni-YSZ is prepared in two different morphologies: the first, thicker one (up to several hundred µm) is the anode substrate, which acts as a support for the whole cell, and possesses a high porosity in order to minimize the mass transport losses. The second structure is a thinner layer (c.a. 10-20 µm), the so called Anode Functional Layer (AFL), which consist of smaller sintered YSZ particles in which the fine Ni catalytic particles are dispersed, in order to extend to the maximum the active surface of the three phase boundary region, at the interface with the electrolyte, in order to minimize the activation polarization losses. This structure results in stable, good performing and low cost anodes.
Nevertheless, even though Ni is a good catalyst for the H2 oxidation, it suffers from carbon
deposition when SOFCs are fed with carbon based, non-conventional fuels; moreover, it is extremely sensitive to the poisoning effects of contaminants such as sulphur and tar compounds (see Section 2.3).
23
For this reason, other materials have been investigated, especially ceria based ones. CeO2 anodes
can electrochemically oxidize dry methane as the presence of mobile lattice oxygen reduces the rate of carbon deposits. For this particular feature, Ni-Gadolinia Doped Ceria (GDC), Samaria Doped Ceria (SDC) or Yttria Doped Ceria (YDC) have been studied for the application in SOFC anodes; nevertheless, lattice expansion due to Ce4+ / Ce3+ reduction still represents a problem in terms of stability of CeO2 anode based SOFCs 19,20.
Figure 2.4. Diagram of a state-of-the-art cermet anode illustrating the paths of electrons and O2- ions in the structure.
2.2.3. Cathode
Cathode materials should possess high electrical conductivity and high electrocatalytic activity for the oxygen reduction reaction.
Perovskyte materials of ABO3 type are generally used as cathode material. Among them,
Lanthanum Manganite (LaMnO3) with substitutions of Strontium or Calcium at the A-site have
been widely employed 21.
Mixed Ionic-Electronic Conductors (MIEC) are also drawing much attention as cathode materials. Lanthanum or Strontium Cobaltites, (La, Sr)CoO3 show higher cathodic performances
than (La, Sr)MnO3, even though the matching of the thermal expansion coefficient (TEC) with
YSZ is lower 22 . As a compromise between expansion mismatch and electrochemical performance, the composition La0.6Sr0.4Fe0.8Co0.2O3 (LSCF) has been established as a good
cathodic material 23. The advantage of such mixed ionic-electronic conducting cathodes is their increased reactive catalytic surface area over the whole perovskite grain.
24
2.2.4. Interconnects
The interconnect in SOFC stacks is the component which electrically connects the single cells and in planar systems it additionally separates the gas compartments. It requires a number of different proprieties to be achieved, such as good electrical conductivity, gas tightness, chemical compatibility with the adjacent electrodes, high corrosion resistance to the gases, good TEC matching and low costs.
Figure 2.5. Bipolar plates in a planar SOFC stack 24.
Principally, interconnects can be divided into two classes of constituent materials: ceramic and metallic materials.
All ceramic interconnects are based on LaCrO3. It is stable but possesses a good electrical
conductivity only at temperatures above 800 °C. Moreover their cost is significantly high, and since the general trend in SOFC systems is to reduce the operating temperatures, in order to reduce costs and ensure longer operations, this type of materials have lost their appeal in favour of metallic interconnects.
25
Metallic alloys have replaced ceramic interconnects due to their ease of manufacture, lower material cost and most importantly, higher electronic and thermal conductivities. However, these metallic alloys present a critical issue during long-term operation of the fuel cell stack: volatilization of Cr-containing species (e.g. CrO3 and Cr(OH)2O2) that end up depositing on the
surface of the cathode leading to a rapid deterioration of the O2 reduction rate 25,26.
2.2.5. Sealants
In planar SOFC stacks, gaskets are required to avoid leakages of gases between the bipolar plates and the electrodes. Seals should be electrically insulating, chemically compatible with different oxide and metallic cell components and stable under thermal cycling between room temperature and operating temperature.
There are two classes of seals: rigid and compressive.
Glass or glass ceramics27 have demonstrated to be chemically stable in both oxidizing and reducing environments. However, due to the addition of barium or calcium silicates to fulfil the requirements of thermal expansion coefficient, diffusion and segregation of species may occur during long term operation at the interface with the cell 28.
Besides glass-ceramics, compressive seals have also been investigated. They are generally metallic gaskets or mica-based materials 29. To achieve low leakage rates they generally require high mechanical loads, but possess however a good matching of TEC and chemical stability.
2.2.6 Tubular SOFCs
Tubular SOFCs are cylindrically shaped with a length comprised between 1.5 – 2 m for most of their applications. This geometry comprises three cylindrical and concentric layers of anode-electrolyte and cathode materials, that generate a rigid tube with only one opened extremity. Depending on the external layer, the fuel (or air) is fed by a coaxial tube, while the air (or fuel) flows over the external part of the cell.
26
Figure 2.6. Tubular geometry of a SOFC 30
The main advantage of tubular SOFCs, compared to their planar analogous, is that they do not require sealants. They also allow faster start-up and shut-down procedures, and possess a better structural robustness for long-term operation. Nevertheless, their power density is considerably lower, due to the high internal resistance caused by the long path that the current must cover to reach the external circuit; moreover, the production costs are higher due to complex deposition techniques required to obtain cylindrical oxide layers.
2.2.7. Planar SOFCs
Planar SOFCs are generally square-shaped with dimensions that range between 10 x 10 cm2 and 20 x 20 cm2, in order to avoid fractures during manufacturing due to the high temperature and pressure gradients, and with a mean thickness of around one mm (or even less).
Depending on the supporting layer, upon which the other layers are deposited, there are four typologies of planar SOFCs: Electrolyte Supported (ES-SOFCs), Anode Supported (AS-SOFCs), Cathode Supported (CS-SOFCs) cells and Metal Supported (MS-SOFCs) 9, 10, 11.
Concerning the first three types of cells, the anode supported type is the most widespread, allowing to reduce the thickness of the electrolyte layer below 10 µm, and thus dramatically reducing the overall internal resistance of the cell; moreover the anode support results more mechanically stable and has better manufacturing proprieties than the cathode materials.
27
Recently, to overcome the issues of anode supported SOFCs related to the low reliability of sealant materials, and to failures of the cells related to thermal transients and mechanical stresses, metal supported SOFCs have been developed 31.
The principal difference with respect to AS-SOFCs is that the anode support is substituted by a porous metallic support, and the anode is deposited as a thin film over its surface. The overall structure has generally the same thickness.
Metal supported cells offer several advantages like lower production costs, better tolerance to contaminants and general improved robustness to mechanical stresses. Nevertheless, they still require more investigations to finally enter the market of SOFC.
Figure 2.7. SEM images of the cross section of a typical anode supported SOFC. At the anode side, the anode support and the anode functional layers can be distinguished.
28
Figure 2.8. Schematic representation of the comparison between the anode supported and metallic supported SOFCs structures.
2.3. Fuel flexibility
Hydrogen is the preferred fuel for SOFCs systems, as it guarantees high power and thermal output, safe operation for cell components and water as the only exhaust gas; it is also planned in the future to be generated from renewable sources, thereby becoming an attractive energy vector for the spread of green technologies. Nevertheless, to the present day, hydrogen is produced almost totally from hydrocarbons, and there is a very low penetration of H2 distribution
infrastructures or storage facilities; this clearly hinders to some extent the possibility of hydrogen-fed SOFCs to become competitive systems for heat and power generation on the market.
However, as explained also in the previous Sections, fuel flexibility is one of the most attractive proprieties of SOFCs, thereby being able to produce electricity and heat starting from more conventional carbon-based fuels, due to their high operating temperatures, high catalytic activity and low susceptibility compared to low-temperature fuel cells.
A number of different fuels can be successfully employed with SOFCs: natural gas, syngas produced from gasification of coal and biomasses, biogas coming from anaerobic digestion of organic wastes, and even liquid fuels such as diesel and alcohols 32,33,34,35,36.
Since the aim of this work is to shed light on the different processes occurring when IT-SOFCs are fed with syngas mixtures, in the following Sections a brief discussion about the feeding of SOFC with syngas is reported, highlighting those aspects that will be instrumental for the discussion of the experimental results obtained within this work.
29
2.3.1 Non-conventional fuel: syngas
With the term syngas a gas mixture is generally intended in which the principal components are H2 and CO. There are several ways to produce a syngas; however the most interesting sources of
syngas for the application in SOFC systems are the gasification of biomass and the conversion of natural gas by means of the reforming reaction.
From these two sources, the produced syngas is generally a mixture of H2, H2O, CO, CO2, CH4
and N2. A typical syngas composition resulting from a biomass gasifier is reported in Table 2.1.
below 37:
Syngas
H2 (%) H2O (%) CO (%) CO2 (%) CH4 (%) N2 (%)
10-50 0-30 10-45 10-30 1-20 0-50
Table 2.1. Mean composition of a syngas
The gasification process is a thermochemical process that uses air, oxygen or steam as gasification agents that convert the biomas (or coal) in a gas rich in hydrogen and carbon monoxide. A generic reaction for the gasification of biomass can be expressed as follows:
𝐶𝑎𝐶𝐻𝑎𝐻𝑂𝑎𝑂𝑁𝑎𝑁 + 𝑥1𝐻2𝑂(𝑙)+ 𝑥2𝐻2𝑂(𝑔)+ 𝑥3 𝑂2+ 𝛾𝑁2 → 𝑧1𝐻2+ 𝑧2𝐶𝑂 + 𝑧3𝐶𝑂2+ 𝑧4𝐶𝐻4+
𝑧5𝑁𝐻3+ 𝑧6𝐻2𝑂(𝑔)+ 𝑧7𝐶10𝐻8+ 𝑧8𝐶(𝑠) (2.21)
The temperature employed for the gasification process is typically above 800 °C.
Besides the reported products, other impurities, which are contaminants for SOFCs, are generally present, such as H2S, HCl, NH3 and Tars. In Section 2.3.3, particular attention will be provided to
the description of tars and their effects on SOFCs, since part of the experimental analysis was aimed to investigate the effect of this class of compounds on IT-SOFC cells.
Natural gas can be converted into a syngas by means of the steam reforming reaction. In the case of SOFC systems, this fuel conversion can proceed directly at the SOFC anode, thanks to the catalytic proprieties of dispersed Ni particles, or in an upstream reformer. The former process is
30
called Direct Internal Reforming (DIR) while the latter is known as Indirect Internal Reforming (IIR). Depending on the applications, either the DIR or the IIR conversion can be applied; nevertheless, IIR is generally preferred due to the significant thermal and concentration gradients that arise when methane is reformed directly at the anode, which can compromise the longevity of the entire system.
For methane, the main reactions occurring in this conversion to syngas are the steam reforming reaction (Equation 2.22), and the subsequent water gas shift (2.23) and dry steam reforming (2.24), that may occur once the steam reforming products start to appear in the gas mixture.
𝐶𝐻4+ 𝐻2𝑂 ⇌ 𝐶𝑂 + 3𝐻2 ΔH° = +206 kJ ∙ mol−1 (2.22)
𝐶𝑂 + 𝐻2𝑂 ⇌ 𝐶𝑂2+ 𝐻2 ΔH° = −46 kJ ∙ mol−1 (2.23)
𝐶𝐻4+ 𝐶𝑂2 ⇌ 2𝐶𝑂 + 2𝐻2 ΔH° = +247 kJ ∙ mol−1 (2.24)
The endothermic steam reforming reaction is thermodynamically favoured at high temperatures and low pressures and, along with the water gas shift reaction, they are generally carried out at temperatures above 700 °C and with Nickel based catalysts.
2.3.2 Operation of SOFC with syngas
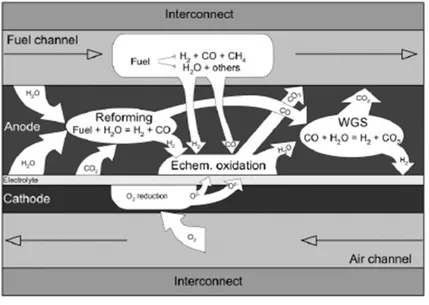
When an SOFC cell is fed with a syngas, a number of different reactions, both of chemical and electrochemical nature, occur.
Figure 2.9. below summarizes all the possible reactions than can develop in a SOFC fed with syngas.
31
Figure 2.9. Schematic representation of the possible reactions within an SOFC fed with syngas
Along with the electrochemical oxidation of H2 (Equation 2.1) and the aforementioned steam
reforming and water gas shift reactions (Equations 2.22 and 2.23) other mechanisms are theoretically possible, depending on the conditions of temperature, gas compositions, cell materials, and operating point at which the SOFC works.
Carbon monoxide and methane can be electrochemically oxidized (Equations 2.24 and 2.25 respectively) and equilibria like the methane cracking (Equation 2.26) and the Boudouard reaction may be present, forming carbon deposits:
𝐶𝑂 + 𝑂2−→ 𝐶𝑂
2 (2.24)
𝐶𝐻4+ 4𝑂2− ⟶ 𝐶𝑂2+ 2𝐻2𝑂 + 8𝑒− (2.25)
𝐶𝐻4 ⇌ 𝐶 + 2𝐻2 (2.26)
2𝐶𝑂 ⇌ 𝐶𝑂2+ 𝐶 (2.27)
The operation of SOFCs with syngas has been widely studied in literature, but a clear comprehension of the occurrence of all these reactions and their pathway is still missing, especially due to the lack of analysis tools able to provide information directly in-operando. As
32
previously mentioned, the study of these reactions by means of innovative tools of analysis will be the objective of this work.
2.3.3 Fuel impurities: tar
Especially in the case of syngas produced by gasification of biomasses, impurities that may be harmful for the safe operation of SOFC systems are always present and may cause a fast degradation of performances, leading to cell failure.
Moreover, since the general trend in SOFC systems is to reduce the operating temperatures, employing the next generation of IT-SOFCs, lowering the operating temperature leads to a general reduction of the tolerance limits of SOFCs to typical biomass gasification product gas contaminants 38.
These contaminants are mainly sulfurous compounds (such as H2S), NH3, HCl, alkali, and tars 39.
As regards the effects of the former impurities (H2S, NH3, HCl and alkali compounds) on solid
oxide fuel cells, they have been studied and results are reported in literature, together with tolerance limits, 40, 41, 42, 43, while there is a lack of literature concerning the tolerance limits and the effects of a long term exposure to the latter (tar).
Tar can be defined as an organic compound with a molecular weight larger than benzene. This class of compounds comprises a number of organic condensable hydrocarbons, formed by aromatics and polycyclic aromatic hydrocarbons (PAH). Tars are classified as primary, secondary and tertiary tars; however, Bergman et al.44 formulated an alternative classification based on the structure and on the molecular weight of the species; this classification is summarized in Table 2.2.
Class Type Examples
1 Gas Chromatography (GC) undetectable tars Biomass fragments, heaviest tars
2 Heterocyclic compounds Phenol, cresol, pyridine
3 Light aromatics (1 ring) Toluene, xylene
4 Light polyaromatics (2-3 ring) Naphthalene, anthracene,
phenenthrene 5 Heavy polyaromatics (>3 rings) Pyrene, fluoranthene
33
The amount of tars produced during the gasification of biomass can be as high as several hundred of g·Nm-3, depending on the gasification technology applied 45. Also the composition of the tar mixture in the gas stream largely depends on the nature of the feedstock, on the different gasification technologies, and on the operating conditions of the gasifier. However, it frequently comprises a 50% of benzene and toluene, with the other half covered by the rest of the tar typologies.
Tar species induce a pronounced carbon deposition through a complex series of different chemical reactions, comprising also the steam reforming (or even the dry reforming in presence of CO2) and the thermal degradation of this class of hydrocarbon. The product species of these
reactions can further interact with each other, leading to other possible carbon deposition reactions 46.
As a result of carbon formation, deactivation of Ni catalyst, reduction of the Three Phase Boundary length (TPB) and hindering of the transport of reactants to the active sites due to pore occlusion, are the main effects that affect negatively the cell performances 47, 48, 49, 50.
However, the possibility of carbon formation and the rate of deposition are strictly dependent on the operating conditions, such as operating temperature, moisture content and current density, on the anode material and on the type and concentration of tar species.
A study of the effects of a model tar in a simulated syngas fed to an IT-SOFC will be presented in Chapter 5.
34
3. ANALYSIS TOOLS AND TECHNIQUES
In this Chapter, a description of the basics of the principal and most renowned electrochemical characterization techniques employed in the study of SOFC cells, namely Polarization Curves (or i-V curves) and Electrochemical Impedance Spectroscopy (EIS), is provided.
The main focus of the following Sections will be the description of the fundamental principles of two advanced analysis techniques that both rely on the EIS measurements: the Distribution of Relaxation Times (DRT) method and the Complex Non-linear Least Squares (CNLS) fitting. The combination of these three analysis tools (EIS-DRT-CNLS) will be the basis of the main results obtained in the experimental work of this thesis.
Finally, a brief description will be provided at the end of this Chapter of the principal post-mortem characterizations employed to further confirm the results obtained from the in-operando analysis presented in this work.
3.1. Polarization curves
The polarization curve (or i-V curve) is the most employed diagnostic technique used to characterize the overall immediate performance of SOFC cells 10, 11 (see Figure 3.1).
35
It consists in the measurement of the cell voltage with the varying of the current generated and extracted from an external load. It provides information about the general electrical response of the cell over the range of currents investigated, and hence it is a valuable instrument to assess the dependency of the cell performances to the operating conditions, but it can also suggest hints about the effect of the different polarization losses by examining the different portions of the plot. First of all, the Open Circuit Voltage (OCV), measured at i = 0 A·cm-2, can be compared to the theoretical voltage calculated from the Nernst equation and the difference between them is a good estimation of losses related to gas leakages, since the Nernst voltage is the maximum voltage obtainable in ideal conditions.
The rapid drop of the cell voltage at low current densities is the reflection of the polarization losses related to the overcoming of the activation energies for the electrochemical reactions at the electrodes. Hence it weights the impact of the activation overpotential 𝜂𝑎𝑐𝑡 of both the anode and cathode reactions.
The linear trend that covers most of the plot is caused by the ohmic polarization due to the internal resistance of the cell, which is constant with respect to a change in the current density (Equation 2.14). As explained in Chapter 2, for SOFCs the main contribution to the ohmic resistance of the whole cell is ascribable to the resistivity of the electrolyte layer. From the slope of this central region of the i-V curve the physical quantity known as Area Specific Resistance (ASR), measured in Ω·cm2
, is generally estimated in order to compare the overall performances of different cells.
Finally, when high current densities are required from the cell, an undersupply of reactants in the active regions of the cell occurs, which is caused by the mass transport limitations of gases through the electrolyte layers or by simple fuel starvation. The fast drop of the cell voltage is related to the concentration overpotential 𝜂𝑐𝑜𝑛𝑐, and it represents the maximum current that can
be supplied from the cell without incurring into severe material degradation.
3.2 Electrochemical Impedance Spectroscopy (EIS)
3.2.1. Principles of EIS
Electrochemical Impedance Spectroscopy (EIS) is a very sensitive technique that maps an electrochemical cell’s response to the application of a periodic small AC signal carried out at
36
different frequencies. In contrast to polarization curves, EIS measurements can shed light on the diverse physicochemical processes occurring in the active layers of the cell, as each process has associated a unique time-constant (relaxation time) and therefore each one of is exhibited at different frequencies 52.
If the studied system satisfies contemporaneously the conditions of causality, linearity and time-invariance, the response to a sinusoidal voltage (or current) excitation signal is a sinusoidal current (or voltage) signal, sharing the same frequency 53. For a generic sinusoidal voltage input signal 𝑒 𝑡 = 𝐸 𝑐𝑜𝑠 𝜔𝑡 + 𝜃 the response is a current signal which can be expressed as: 𝑖 𝑡 = 𝐼 𝑐𝑜𝑠 𝜔𝑡 + 𝜑 , where 𝜔 = 2𝜋𝑓, 𝑓 being the signal’s frequency, 𝐸and 𝐼 are the amplitude of the voltage and current signals respectively, whilst 𝜃 and 𝜑 are their initial phases. Both sinusoidal expressions can be rewritten as complex-form functions, namely 54:
𝑒∗ 𝑡 = 𝐸 · 𝑒𝑥𝑝 𝑗 𝜔𝑡 + 𝜃 , 𝑤𝑖𝑡 𝑒 𝑡 = 𝑅𝑒[𝑒∗ 𝑡 ] (3.1)
𝑖∗ 𝑡 = 𝐼 · 𝑒𝑥𝑝 𝑗(𝜔𝑡 + 𝜑) , 𝑤𝑖𝑡 𝑖 𝑡 = 𝑅𝑒[𝑖∗ 𝑡 ] (3.2)
The impedance value measured at different frequencies is given by:
𝑍∗ 𝜔 =𝑒∗ 𝑡 𝑖∗ 𝑡 = 𝐸 𝐼𝑒𝑥𝑝 𝑗 𝜃 − 𝜑 = 𝐸 𝐼 𝑐𝑜𝑠 𝜃 − 𝜑 + 𝑗 𝑠𝑖𝑛 𝜃 − 𝜑 (3.3)
which can be expressed as a complex number having its real and imaginary components expressed as follows:
𝑅𝑒 𝑍∗ 𝜔 = 𝑍′(𝜔) =𝐸
𝐼𝑐𝑜𝑠 𝜃 − 𝜑 (3.4)
𝐼𝑚 𝑍∗ 𝜔 = 𝑍′′(𝜔) =𝐸
37
3.2.2. EIS measurements on SOFC
As illustrated in Chapter 2, during the operation of an SOFC, a number of physicochemical processes occur contemporaneously. Each of them have a characteristic frequency at which they can be excited by the sinusoidal stimulus provided by a Frequency Response Analyzer (FRA) and the electrical response, measured in terms of amplitude and phase shift of the signal, is the response of that single process having its maximum intensity at that particular frequency.
If the excitation signal has a small amplitude, which in SOFC cells generally corresponds to c.a. 10 mV (or a current stimulus corresponding to an oscillation of the cell’s voltage of 10 mV), the response of the cell can be considered linear and time invariant 55.
Impedance measurements can be reported in two different plots: the so-called Nyquist plot, which reports the real part of the measured impedance against its imaginary part, and the Bode plots, that depict the dependency on the imposed frequency of the impedance modulus or the phase shift.
The impedance response of a SOFC cell is generally reported in a Nyquist plot, as it provides quantitative information, expressed in terms of resistances, about the polarization losses that affect the i-V characteristics.
Figure 3.2. reports an experimental EIS spectrum, in the form of the Nyquist plot, measured from a sample tested in this work.
Figure 3.2. Electrochemical impedance spectrum of a single cell sample (10 x 10 cm2) measured at T = 700 °C in humidified hydrogen.
38
From the intercept of the experimental data with the real axis (– 𝑍′′ = 0 Ω ), the value of impedance corresponds to the total ohmic resistance of the cell, which generates in the i-V curve the linear trend in the central part of the plot.
The difference between the resistance measured from the last point on the real axis to the first one is the measure of the so-called polarization resistance 𝑅𝑝𝑜𝑙, that is given by the sum of all the
activation and mass transport losses of both the anode and cathode sides, as previously explained in Chapter 2.
Further information can be given accepting the general assumption, which is considered valid for SOFC cells, that the small arc appearing in the high frequency region is related to the fast charge transfer mechanism involved in the electrochemical reactions at the anode and at the cathode; for this reason, if the real part of the total impedance of this arc is extrapolated, it results as the resistance related to the charge transfer mechanisms that cause the activation overpotential losses. By similar considerations, the bigger arc appearing in the low frequency region is often associated to the mass transport losses related to the diffusion of the gasses in the porous matrix of the electrodes; it is thus a measure of the diffusion resistance which causes the voltage to rapidly drop at high current densities 56,57.
Even though the information obtainable from the analysis of Nyquist plots provides quantitative measurement about the polarization losses, nothing can be said about which process, anodic or cathodic, is predominant on a given amount of polarization loss; moreover, since the EIS response appears very broadened, it is difficult to clearly visualize the contributions of single physicochemical processes to the total polarization resistance, hence impeding a profound and complete comprehension of the evolution of these processes and their dependency to the operating conditions of the cell.
In the following Section, a novel and reliable deconvolution methodology (DRT) for the EIS spectra will be extensively explained.
3.3. Distribution of Relaxation Times (DRT) method: deconvolution of signals
SOFCs are complex electrochemical devices, in which many processes occur at the same time, each process being characterized by its typical relaxation time. When two (or more) processes have a similar relaxation time, it is hard to separate and distinguish their contributions to the
39
overall impedance of the cell, since the EIS spectra can clearly distinguish processes separated at least by two decades in the frequency domain. Furthermore, it is hard to identify small contributions, these being totally covered by processes with large polarization losses.
The Distributed Relaxation Times (DRT) method, is a mathematical tool which allows to overcome this issue, by calculating the distribution of relaxation times function of the processes from the experimental data 58.
It is based on the validity of the Kramers-Kronig equations 59, 60 for the cell studied:
𝑍′ 𝜔 = 𝑅 0+ 𝑅𝑝𝑜𝑙 1 + (𝜔𝜏1 𝑚)2 𝑚 𝑎𝑚 (3.6) 𝑍′′ 𝜔 = 𝑅 𝑝𝑜𝑙 1 +(𝜔𝜏−𝜔𝜏𝑚 𝑚)2 𝑚 𝑎𝑚 (3.7)
where 𝑅0 is the ohmic resistance of the cell, 𝑅𝑝𝑜𝑙 is the polarization resistance, 𝜔 is the angular frequency, 𝜏𝑚 the relaxation time of the process 𝑚 and 𝑎𝑚 is the contribution of the process 𝑚 to
the total polarization loss.
The DRT function can be calculated either from Eq. 3.6 or Eq. 3.7. Considering the Eq. 3.7 expressed in its matrix form, and introducing the constant value of the polarization resistance into the distribution vector 𝑏𝑚 = 𝑅𝑝𝑜𝑙𝑎𝑚, it results:
𝒁′′ = 𝑲𝒃 (3.8)
To solve the Eq. 3.8, the Tikhonov regularization algorithm has been employed 61 , 62. This algorithm allows to obtain the distribution vector 𝒃 as:
𝒃 = (𝑲−1 𝑲 + 𝜆𝑰)−1𝑲𝑇𝒁′′ (3.9)
where I is the identity matrix, and 𝜆 is the self-consistent regularization parameter that must be optimized: too small values result in artificial meaningless peaks, while too large values excessively smooth out the shape of the distribution function.
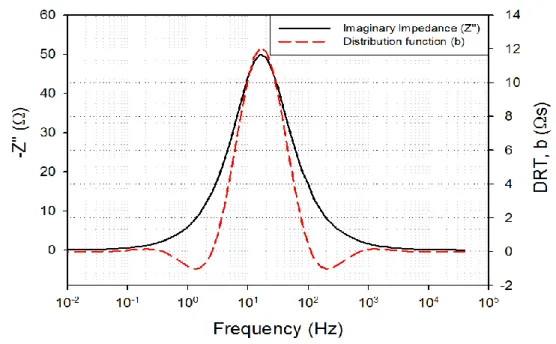
In Fig. 3.3, the imaginary part of the impedance of a dummy-cell is compared to the distribution function obtained from the DRT calculation over the experimental spectrum, as a function of the
40
frequency. In Fig. 3.4. the imaginary part of the EIS spectrum of an IT-SOFC button cell (active surface 2 cm2, employed in this work) is compared to its distribution function derived from the DRT calculation carried over the imaginary part of its impedance. The dummy-cell consisted of a resistance R1 in series with a resistance R2 and a capacitor C1 connected in parallel, with R1 = 10
Ω, R2 = 100 Ω, and C1 = 100 µF. The spectrum shown in Fig. 1b was obtained from a button cell
sample at T = 675°C in a fuel mixture of H2 = 20 %, N2 = 76 % and H2O = 4 %, in OCV
condition.
Figure 3.3. DRT distribution function with the imaginary part of the impedance of a dummy-cell.
Observing Figure 3.3, it shows that the DRT calculation does not affect the characteristic frequency at which the process occurs. Depending on the value of 𝝀, fluctuations in proximity of the peak may appear; however, the optimal value of 𝝀, which minimize the fluctuations related to the calculation process, can be estimated from the L-curve of the Tikhonov regularization method
63. The optimal value of 𝝀 is in proximity of the angle formed from the L-shaped curve (Figure
41
Figure 3.4. DRT distribution function the imaginary part of the impedance of an IT-SOFC button cell operating at T = 675°C in humidified H2 - N2 mixture.
42
As shown in Fig. 3.4, from the DRT calculation, 6 different peaks can now be distinguished from the imaginary part of the EIS measurement. The nature of these peaks will be assessed by means of a systematic experimental campaign, presented hereafter, to understand whether a single peak corresponds to an anodic process or a cathodic process, and to further comprehend the nature of the process behind each peak (charge transfer or mass transport phenomena).
The DRT method has been already successfully employed in the study of physicochemical processes occurring in anode-supported SOFCs operating in humidified hydrogen 64 , 65 or in reformate fuel 66, in tubular SOFCs 67, and in the study of degradation effects 68, 69, providing profound insights about the number, nature and behavior of the diverse processes that determine the overall response of a SOFC, under a broad range of different operating conditions.
It is important to underline that the quality of the experimental data plays a fundamental role in the interpretation of the DRT plots. If the experimental spectra are affected by instrumental interference that cause a loss in the linearity of the EIS response, scattered signals appears in the EIS spectra that will be converted into ghost peaks into the DRT plots, impeding a correct identification and analysis of the processes.
A method to assess the quality of the experimental spectra is the so-called Kramers-Kronig test, which basically assess the validity of the Kramers-Kronig relationships through all the frequency range examined. In this work, the Kronig test was performed by means of the Kramers-Kronig test for Windows 9, 10, software developed by B.A. Boukamp et al.
The residual errors plot of the aforementioned test is depicted in Fig. 3.6. Since the distribution of the points (red dots for the real part and blue dots for the imaginary part of the impedance) is random for all the frequency range, and the maximum error lies below 0.5%, the experimental data can be considered reliable.
It must be noted that in some cases, especially when high water contents are fed to the cell, the low frequency region of the spectra is affected by a more significant error, but still acceptable. As it will be explained in the discussion of experimental results, attempts to measure the impedance response of the cell under a constant current density were performed; however the quality of the spectra in these cases, evaluated by this KK-test, resulted poor and were judged unusable for the objectives of this work. On the contrary, all the measurements carried out in OCV conditions resulted acceptable.
43
Figure 3.6. Kramers-Kronig test results for the EIS measurement performed on a button cell sample (active area 2 cm2) at 700ºC in humidified hydrogen. Red dots are related to the real part of the impedance, while blue dots are
related to the imaginary part.
3.4. Complex Non-linear Least Squares (CNLS) fit
As previously explained, EIS is a powerful tool to measure the sources of potential losses within an SOFC under operating conditions. Nevertheless, a profound interpretation of the single physicochemical processes results in a very complex problem, since it often requires a-priori assumptions about the system being investigated 70.
One of the most widespread ways to extract quantitative information about the different contributions to the EIS spectra is a fitting procedure of the experimental data with a so-called Equivalent Circuit Model (ECM), which is a sequence of circuit elements, such as resistances and capacitors, connected in series and/or in parallel, which aims to simulate the experimental electrical response of the investigated device 3.
The unknown values of the parameters defining the equivalent circuit elements are generally evaluated by a Complex Non-linear Least Squares (CNLS) fitting algorithm.
This fitting procedure aims to find a set of parameters that minimize the following sum: