Dedicated to the men in my life: my dad that I miss a lot; my husband and my son that are my life.
TABLE OF CONTENTS
Chapter 1. Introduction
Chapter 2. Bioenergy overview 2.1 Traditional bioenergy 2.2 Modern bioenergy 2.3 First generation biofuels
2.4 Liquid biofuels - Bioethanol and Biodiesel
2.5 Biogas 2.6 Biohydrogen 2.7 Woodfuels
2.8 Second generation biofuels 2.9 Bioenergy for heat
2.10 Bioenergy for electricity
2.11 Bioenergy for combined heat and power
Chapter 3.
B
ioenergy production and consumptiono
utlook3.1 Bioenergy contribution to the Total Primary Energy Supply (TPES) 3.2 Primary solid biomass
3.3 Biogas
3.4 Bioethanol used for fuel 3.5 Biodiesel
3.6 Total bioenergy supply and contribution to TPES 3.7 Implications of the bioenergy outlook
Chapter 4. Bioenergy development at regional level – Case Studies 4.1 North America
4.1.1 Baseline scenario for production and consumption 4.1.2 Remarks and challenges
4.2
Latin America and the Caribbean
4.2.1 Baseline scenario for production and consumption 4.2.2 Remarks and challenges
4.3 Australia, Japan and New Zealand
4.3.1 Baseline scenario for production and consumption 4.3.2 Remarks and challenges
4.4
East Asia and the Pacific
4.4.1 Baseline scenario for production and consumption 4.4.2 Remarks and challenges
4.5
Europe and Central Asia
4.5.1 Baseline scenario for production and consumption 4.5.2 Remarks and challenges
4.6
South Asia
4.6.1 Baseline scenario for production and consumption 4.6.2 Remarks and challenges
4.7
Middle East and North Africa
4.7.1 Baseline scenario for production and consumption 4.7.2 Remarks and challenges
4.8
Africa
4.8.1 Baseline scenario for production and consumption 4.8.2 Remarks and challenges
Chapter 5. Zooming on liquid biofuels development at country level – Italy and Argentina at a comparison
Introduction
5.1 Liquid biofuels development in Italy
5.1.1 A policy perspective: the Italian legislation and the EU’s 5.1.2 A market perspective
5.2 Liquid biofuels development in Argentina
5.1.1 A policy perspective: the Argentinean legislation 5.1.2 A market perspective
Chapter 6. Bioenergy in the international context 6.1 Mandatory systems
6.2 Voluntary systems
Chapter 7. Key drivers and challenges of bioenergy sustainable development Introduction – Numbers in a nutshell
7.1 Sustainability at the core of bioenergy development 7.2 Environmental aspects
7.2.1 Greenhouse gas emissions 7.2.2 Biodiversity
7.2.3 Water availability, use efficiency and quality 7.2.4 Soil quality
7.2.5 Air quality
7.2.6 Land-use change (LUC) 7.3 Social aspects
7.3.1 Food security
7.3.2 Access to land, water and other natural resources 7.3.3 Rural and social development
7.3.4 Access to energy
7.3.5 Human health and safety 7.4 Economic aspects 7.4.1 Economic development 7.4.2 Trade 7.4.3 Energy security 7.5 Policy framework 7.6 Conclusions
Chapter 8. Methodology for an integrated assessment 8.1 Criteria selection
8.3 Criteria in a matrix
Chapter 9. Multi criteria assessment of bioenergy sustainability potentials 9.1 GHG emissions
9.2 Biodiversity
9.3 Water availability, use efficiency and quality 9.4 Soil quality
9.5 Air quality
9.6 Land-use change (LUC) 9.7 Food security
9.8 Access to land, water and other natural resources 9.9 Rural and social development
9.10 Access to energy
9.11 Human health and safety 9.12 Economic development 9.13 Trade
9.14 Energy security 9.15 Concluding remarks
Annexes
Annex I: Inventory of current initiatives on sustainable bioenergy development Annex II: Summary Table of the GBEP sustainability indicators
Annex III: Names and descriptions of the GBEP sustainability indicators Acronyms
Chapter 1.
Introduction
Bioenergy has been rapidly emerging as a top priority in the international agenda as countries face the triple challenges of ensuring food security, energy security and sustainable development. Scarce natural resources must be managed responsibly to meet these goals and to ensure that one is not attained at the expense of another.
The production of energy from biomass is mostly restricted to traditional uses of wood and agricultural wastes (i.e. for heating and cooking), often in rural areas and mostly in developing countries. However, in the last 5-10 years, there has been greatly renewed interest in bioenergy along with development of more modern bioenergy production systems.
Very recently, most attention has been given to the production of liquid biofuels that substitute oil-derived transport fuels, but there has also been increased interest in modern systems for heat and energy production using solid biomass in regions such as Europe. Some of the larger developing countries are also interested in liquid biofuels either to reduce imports of oil-derived fuels or as an opportunity to export to developed countries. In addition, while traditional uses of bioenergy remain important in most developing countries, some developing countries also have ambitions to increase renewable energy production, including bioenergy.
Bioenergy can be a clean source of energy and can contribute to sustainable development. As a low carbon or carbon-neutral source of energy, bioenergy can contribute to climate change mitigation by contributing to replace fossil fuels and through carbon sequestration in plants and soils in perennial energy plantations. Furthermore, perennial bioenergy cropping systems can help stabilise soils and reduce land degradation. Bioenergy feedstocks also present an opportunity for diversification of agricultural production at the large and small-scale levels.
Biofuels production and use is increasing inexorably all over the world and, although priorities may vary, its reasons are shared by most countries:
- first of all, rising oil prices and the concentration of supply force countries to look for alternative fuels and to diversify energy suppliers;
- secondly, biofuels can play a role in rural development, providing energy access to remote communities and creating new employment opportunities;
- last but certainly not least, climate change, is one of the main driving forces to replace fossil energy sources and to mitigate greenhouse gas emissions as well as to contribute by responding to the increasing global energy demand.
However, we are aware that fast-growing supply and demand for bioenergy could also bear risks. Rising demand for bioenergy has already caused a surge in the use of grain and other food crops for energy, pushing up the price of staple foods and contributing to affect food security. Bioenergy also poses environmental challenges, for instance where increasing mono-cropping practices and greater fertiliser and pesticide use may jeopardise water and soil quality over time. High concerns are also raised by land-use change and the risk that large areas of natural forests and grasslands be converted to energy crop production, which not only would threaten biodiversity and other ecosystem services, but also result in additional greenhouse gas emissions.
In this respect, sustainability is a key element and it is wise to put in place the necessary safeguards to ensure sustainable management of the entire production chain – feedstock production, conversion and use of biofuels. International indicators should be discussed internationally and introduced into the global energy market in order to ensure sustainable development and environmental gains as well as promote social equity. At the same time, sustainability criteria and indicators should not represent ways to the introduction of unnecessary trade barriers and protectionism against developing countries export opportunities.
Chapter 2. Bioenergy overview
Bioenergy is energy derived from biomass, while biofuels are the energy carrier derived from biomass1. The term biomass refers to all matter of organic origin from forest, agriculture or municipal waste, including the living plants and animals and resulting residues; dead but not yet fossil plants or animals and all matter that has been generated.
Biomass accounts for approximately 10% of total primary energy consumed globally and for about 94% of renewable energy, but not all of it is used in a sustainable manner2.
The term biofuels could be sub-divided by type (solid, liquid or gaseous).
The analysis of bioenergy production systems could be divided as follows: - Traditional bioenergy
- Modern bioenergy - First generation biofuels - Liquid biofuels
- Biogas - Biohydrogen - Woodfuels
- Second generation biofuels - Bioenergy for heat
- Bioenergy for electricity
- Bioenergy for combined heat and power
2.1 Traditional bioenergy
Traditional sources of biomass include mostly wood fuels but also agriculture residues and dung, and they contribute essentially to domestic heating and cooking. The number of people dependent on biomass for cooking is estimated at 2.7 billion (for 2008)3. Figure 1
1
GBEP, 2007. A Review of the current state of bioenergy development in G8 +5 Countries. Rome. 2
IEA WEO 2009a. International Energy Agency, World Energy Outlook 2009. OECD/IEA Paris.
3 Chum, H., A. Faaij, J. Moreira, G. Berndes, P. Dhamija, H. Dong, B. Gabrielle, A. Goss Eng, W. Lucht,
M. Mapako, O. Masera Cerutti, T. McIntyre, T. Minowa, K. Pingoud, 2011. Bioenergy. In IPCC Special
gives an overview of the share of people in developing countries depending on traditional biomass.
Although development in this sector is not undergoing rapid change, it accounts for the vast majority of bioenergy production in developing countries (80%4), it is directly relevant to poverty and natural resource management and there is a vast amount of literature and experience available about this sector.
Figure 1 Share of traditional biomass in residential consumption
Source: IEA/OECD, 2006.
2.2 Modern bioenergy
This covers the use of biomass for power and heat generation in modern efficient facilities. It includes co-firing (burning biomass in existing power plants), heat and
Y. Sokona, K. Seyboth, P. Matschoss, S. Kadner, T. Zwickel, P. Eickemeier, G. Hansen, S. Schlömer, C. von Stechow (eds)], Cambridge University Press, Cambridge, United Kingdom and New York, NY, USA.
4 FAO SOFA 2008a (Food and Agriculture Organization of the United Nations, The State of Food and
power installations fitted to processing facilities in forestry and agriculture, and stand-alone biomass heat and power plants.
2.3 First generation biofuels
Biofuels produced from sugar, starch and oil content that is into liquid fuels using conventional technology. The demand for first generation biofuels, produced mainly from agricultural crops traditionally grown for food and animal feed purposes, has continued to increase significantly during the past few years. The main liquid and gaseous biofuels on the market today are bioethanol, biodiesel and biogas.
All together, biofuels currently provide over 1.5% of the world total transport fuels and the crops grown for biomass feedstock take up less than 2% of the world’s arable land.5
The US has become the largest producer, having recently overtaken Brazil. Since it also imports large volumes, mainly ethanol from Brazil, it is also the largest consumer. Europe is the third largest produer, remaining well above China, although consumption has dipped recently due to a lower demand for biodielsel after a change in policy by a number of European governments. Between 2008 and 2013 biofuels are projected to account for half of the growth in incremental liquid fuel supply.6
2.4 Liquid biofuels
Current liquid biofuels are mainly bioethanol and biodiesel.
Bioethanol is derived from the fermentation of mainly sugar and starch crops and, in pilot
way, from cellulosic materials. Depending on agro-ecological and socio-economic context, sugarbeet, sugarcane, sweet sorghum are the most common sugar crops, with corn (maize), potatoes and cereals the most common starch crops.
By far the largest volume of biofuel production comes from ethanol, with 80% coming from corn and sugarcane. Corn ethanol is mainly produced in the US (24.4 bn l in 2007) with
5
WWI - Worldwatch Institute, 2007. Biofuels for transport: global potential and implications for
agriculture. Report prepared for the German Federal Ministry of Food, Agriculture and Consumer
Protection.
subsidies around USD 0.50/l and sugarcane ethanol in Brazil (18.0 bn l in 2007) now without subsidies following strong supporting policies over 3 decades. In the European Union, the situation is very challenging, although there is a 10% target blending level by 2020 in place, profitability is a real issue for many producers. The total world production of bioethanol has tripled between 2000 and 2007 to reach over 25.5 Mtoe.
Biodiesel is produced through trans-esterification of plant oil, which can also be used
directly depending on engine configurations. The derived ethyl or methyl esters can be used as a pure biodiesel or be blended with conventional diesel. Biodielsel can be made from all plant oils, and is so far derived principally from canola (rapeseed), palm or soybean oils, animal fats, waste vegetable oils, or micro-algae oils.
The potential for biodiesel is more limited than for ethanol. Production increased by a factor of 10 from 2000 to 2007 to reach around 8.6 Mtoe or 0.2% of total diesel fuel demand. In Europe where 70% of road transport fueld is diesel, 5.8 bn l of biodiesel (2% of total diesel fuel demand) was produced in 2007, mainly from oilseed rape and imported palm oil. In the US where only 20% of transport fuel is diesel, only 1.8 bn l was produced, mainly from soybean. Brazil has a programme for expanding the soybean production. Palm oil is grown mainly in Malaysia and Indonesia but other developing countries are following suit. Around 80% of the total cost for palm oil biodiesel is for the oil feedstock. Used cooking oils and meat processing by-products are comparatively cheap feedstocks but are in relatively limited supply.
The production and consumption of liquid biofuels for transport is currently highly concentrated. The US and Brazil account for around 87% of world ethanol production. The European Union produces nearly 60% of biodiesel production and consumption.7
Straight vegetable oil (SVO) is a potential fuel for diesel engines that can be produced from a variety of sources. These include oilseed crops such as rapeseed, sunflower, soybean and palm. Used cooking oil from restaurants and animal fat from meat processing industries can also be used as fuel for diesel vehicles.
7 FAO SOFA 2008a (Food and Agriculture Organization of the United Nations, The State of Food and
2.5 Biogas
Is the gas composed principally of methane and carbon dioxide produced by anaerobic digestion of biomass, comprising:
landfill gas
sewage sludge gas
other biogas e.g. from anaerobic fermentation of animal slurries and of wastes in abattoirs, breweries and other agro-food industries.
The conversion of animal wastes and manure to methane/biogas is employed successfully in various countries, and particularly in China and India where it has contributed to energy provision to rural populations, abatement of negative environmental impacts of livestock production and the production of organic fertilizer. Its impact on sanitation, clean cooking and heating and in the creation of small and medium enterprises in rural areas is considered very positive.
2.6 Biohydrogen
Hydrogen produced from biomass for use as an energy carrier by several routes e.g.: gasification or pyrolysis of solid biomass
reforming of biogas
novel technologies based on use of photosynthetic algae or bacteria, or on fermentative bacteria.
2.7 Woodfuels
All types of biofuels originating directly or indirectly from woody biomass. This category includes fuelwood, charcoal and black liquor.8
8
“Fuelwood: wood in the rough (from trunks, and branches of trees) to be used as fuel for purposes such as cooking, heating or power production. From Coniferous and Non-Coniferous.” “Charcoal: wood carbonized by partial combustion or application of heat from an external source. It is used as a fuel or for other uses.” “Black liquor is the alkaline-spent liquor obtained from the digesters in the production of sulphate or soda pulp during the process of paper production, in which the energy content is mainly derived from the content of lignin removed from the wood in the pulping process”. Definitions taken from the Unified Wood Energy Terminology (UWET), FAO.
2.8 Second generation biofuels
Biofuels derived from lignocellulosic materials (e.g. agricultural residues, wood crops, grasses, etc.) using advanced processes. Conversion of cellulose to ethanol involves two steps: the cellulose and hemicellulose components of the biomass are first broken down into sugars, which are then fermented to obtain ethanol. The first step is technically challenging, although research continues on developing efficient and cost-effective ways of carrying out the process. The lack of commercial viability has so far inhibited significant production of cellulose-based second generation biofuels.
As cellulosic biomass is the most abundant biological material on earth, the successful development of commercially viable second generation cellulose-based biofuels could significantly expand the volume and variety of feedstocks that can be used for production. Cellulosic wastes, including waste products form agriculture (straw, stalks, leaves) and forestry, wastes generated from processing (nut shells, sugar cane bagasse, sawdust) and organic parts of municipal waste, could all be potential sources.
Projections for second generation fuels to become commercial are wide ranging but often considered unlikely to occur before 20159. The basic conversion technologies are not new and their commercial development has been a long time coming. Considerable investment in pilot and demonstration plants has been made worldwide but when commercial scale-up can be realised is the key question.
2.9 Bioenergy for heat
Burning biomass for heat is by far the oldest use of bioenergy and is the dominant form of domestic energy in many developing countries (see traditional bioenergy paragraph above).
Biomass can also be used to provide process heat for other applications. An example commonly employed in Brazil is the combustion of waste sugar cane bagasse to provide the heat fermentation and distillation in bioethanol plants. This process heat is often surplus to requirements and can be used for on-site electricity co-generation.
2.10 Bioenergy for electricity
Biomass may be used to generate electricity in various ways. Solid biomass, such as sugarcane residues, wood chips, wood pellets or municipal solid wastes can be combusted alongside traditional fossil fuels in existing thermal power plants (co-firing), or in specialised biomass power plants. Biogas is also commonly used for power generation, either in gas engine generators or by co-firing with natural gas. Small biogas facilities are common in some remote areas, as in parts of China and India.
2.11 Bioenergy for combined heat and power
Combined heat and power systems are a mature technology that greatly improves the overall efficiency of energy use where both heat and electrical power are needed. Combined heat and power plants that run on biomass are increasingly popular and cost-effective. Due to the relatively dispersed nature of biomass resources such as agricultural and forest residues, and low efficiency of transporting hot water full biomass-fuelled combined heat and power plants lend themselves to community-scale operations of less than 50 MW.10
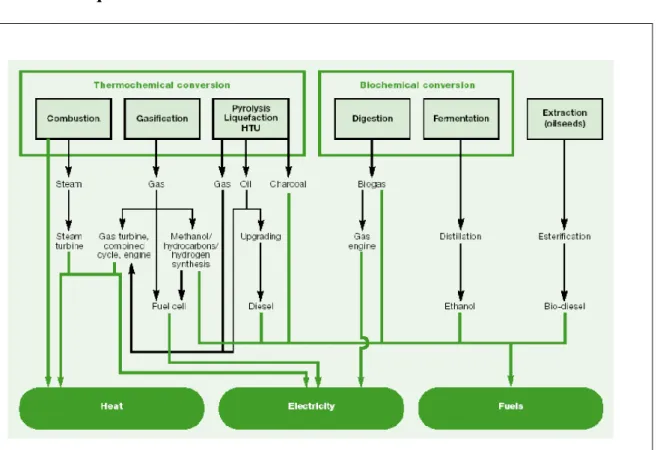
Figure 1 below gives an overview of the various conversion routes usually followed for biomass. These biofuels can be used in specially adapted engines, turbines, boilers, or ovens to provide thermal and/or mechanical energy, which in turn can be converted into electrical energy. In addition, liquid and gaseous fuels can be used directly, or after treatment, as fuels for internal combustion and engines for transportation vehicles and stationary power plants.11
10 IEA, 2005. Benefits of Bioenergy. OECD/IEA, Paris.
Figure 1 Key bioenergy conversion technologies for first and second generation liquid biofuels.
Chapter 3. Bioenergy production and consumption outlook
3.1
Bioenergy contribution to the Total Primary Energy Supply (TPES)
12 Biomass accounts for approximately 10% of total primary energy consumed globally13 and for about 94% of renewable energy, but not all of it is used in a sustainable manner.14Global biofuels supply reached 0.7 mb/d (34.1 Mtoe) in 2007, an impressive 37% increase on 2006, yet still accounted for only 1.5% of total road-transport fuel.
According to preliminary data, supply reached 0.8 mb/d in 2008. Most of the increase in the use of biofuels in 2007 and 2008 occurred in the OECD, mainly in North America and Europe.
The recent surge in biofuels production is not expected to continue in the near term.15 Concerns about the effects on food prices of diverting crops to biofuels, questions about the impacts in terms of greenhouse-gas emissions savings associated with switching to biofuels and concerns about their environmental sustainability have seen many countries rethinking biofuels blending targets. Furthermore, in certain times lower oil prices have cut the profitability of biofuel production and placed enormous financial strain on many bio-refineries. Investment in new plants has all but dried up and many existing plants are running at well below capacity.
Despite the recent downturn, world use of biofuels is projected to recover in the longer term, reaching 1.6 mb/d in 2015 and 2.7 mb/d in 2030. By 2030, the fuels meet 5% of total world road-transport energy demand, up from about 2% today. This scenario
12
Total Primary Energy Supply (TPES) is the total amount of primary energy consumed by a country to meet its energy needs. It is the basic measure of energy consumption used by policymakers (e.g. when considering renewable energy policies) and it is usually measured in million tonnes of oil equivalent (MTOE). For each of the main types of primary energy, TPES is calculated as production, plus imports and stock changes, less exports and transfers to international marine bunkers. At the individual country level, it also includes trade in electricity between countries.
13
IEA WEO 2009a. International Energy Agency, World Energy Outlook 2009. OECD/IEA Paris. Chum, H., A. Faaij, J. Moreira, G. Berndes, P. Dhamija, H. Dong, B. Gabrielle, A. Goss Eng, W. Lucht, M. Mapako, O. Masera Cerutti, T. McIntyre, T. Minowa, K. Pingoud, 2011. Bioenergy. In IPCC Special
Report on Renewable Energy Sources and Climate Change Mitigation [O. Edenhofer, R. Pichs‐Madruga, Y. Sokona, K. Seyboth, P. Matschoss, S. Kadner, T. Zwickel, P. Eickemeier, G. Hansen, S. Schlömer, C. von Stechow (eds)], Cambridge University Press, Cambridge, United Kingdom and New York, NY, USA.
14 IEA WEO 2009a. International Energy Agency, World Energy Outlook 2009. OECD/IEA Paris. 15 Ibidem.
considers that close to one-quarter of this increase comes from second generation technologies.16
3.2
Primary solid biomass
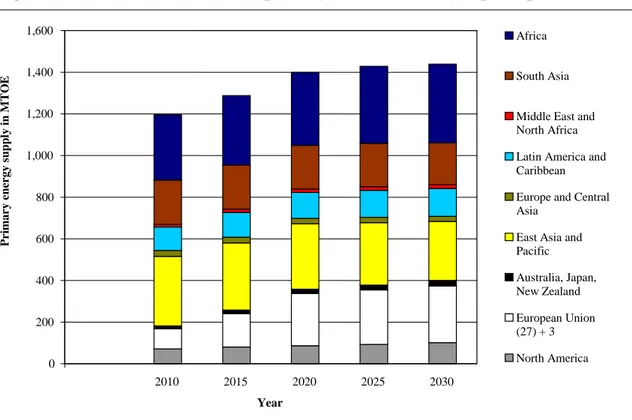
The outlook for bioenergy production from primary solid biomass is shown in Figure 1. Total production is expected to increase by about 250 MTOE (25%) over the next 20 years, from 1,200 MTOE to around 1,450 MTOE in 2030.
Figure 1 Outlook for TPES from primary solid biomass by region up to 2030
Source: based on IEA (2006)17 and Broadhead et al (2001)18.
As previously mentioned, currently 80% of biomass energy is consumed as solid fuels for cooking, heating and lighting, often with low efficiency19. As in the past, the expected growth in bioenergy production from primary solid biomass in each region
16 Reference Scenario of the IEA WEO 2009.
17 IEA, 2006, World Energy Outlook 2006, International Energy Agency, Paris. 18
Broadhead, J S, J Bahdon, and A Whiteman, 2001, Past trends and future prospects for the utilisation
of wood for energy, Food and Agricultural Organization of the United Nations, Rome, Italy.
19 FAO SOFA 2008a (Food and Agriculture Organization of the United Nations, The State of Food and
Agriculture 2008). Biofuels: prospects, risks and opportunities.
0 200 400 600 800 1,000 1,200 1,400 1,600 2010 2015 2020 2025 2030 Year Pr ima ry e n er g y su p p ly i n M T O E Africa South Asia
Middle East and North Africa Latin America and Caribbean Europe and Central Asia
East Asia and Pacific Australia, Japan, New Zealand European Union (27) + 3 North America
depends on the combination of changes in traditional use and the development of modern bioenergy production systems.
The most relevant element of this projection is the expected increase in bioenergy production in the EU due to the renewable energy target of 20% future energy consumption from renewables by 202020. This growth accounts for most of the increase in global bioenergy production and the reduced growth projection after 2020.
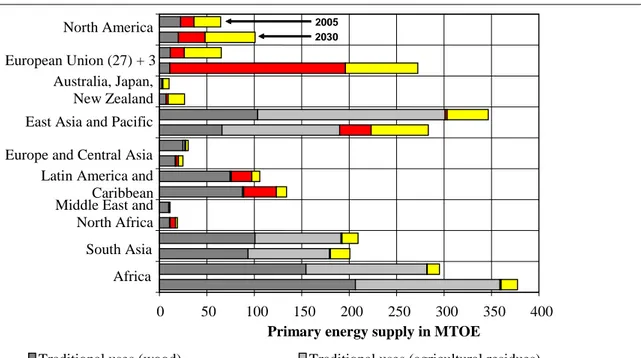
The composition of bioenergy production from primary solid biomass in the timeframe 2005-2030 is shown in Figure 2. This shows very clearly the expected growth in modern uses of primary solid biomass for bioenergy production.
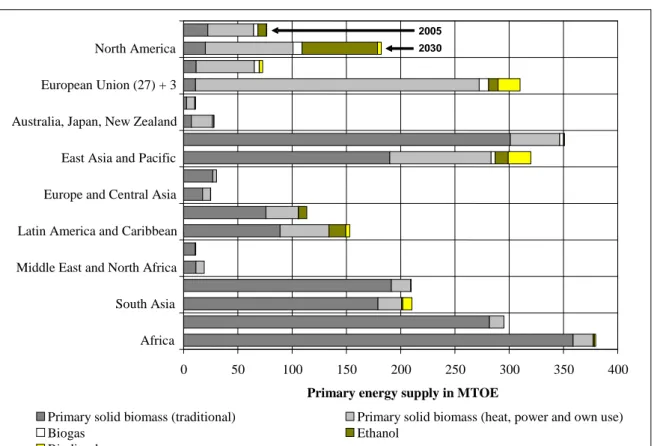
Figure 2 Outlook for TPES from primary solid biomass by region and type in 2005 and 2030
Source: based on IEA (2006) and Broadhead et al (2001).
20 Directive 2009/28/EC of the European parliament and of the Council of 23 April 2009 on the
promotion of the use of energy from renewable sources and amending and subsequently repealing Directives 2001/77/EC and 2003/30/EC. Para 9 “It endorsed a mandatory target of a 20 % share of energy from renewable sources in overall Community energy consumption by 2020 and a mandatory 10 % minimum target to be achieved by all Member States for the share of biofuels in transport petrol and diesel consumption by 2020, to be introduced in a cost-effective way.”
0 50 100 150 200 250 300 350 400 Africa
South Asia Middle East and
North Africa Latin America and
Caribbean Europe and Central Asia East Asia and Pacific Australia, Japan, New Zealand European Union (27) + 3 North America
Primary energy supply in MTOE
Traditional uses (wood) Traditional uses (agricultural residues)
Production of heat and power Internal use in forestry and agricultural processing
2005 2030
3.3
Biogas
The outlook for biogas production is shown in Figure 3. It shows how production is expected to increase of about 40% over the next 20 years with most growth expected in the EU.
Developed countries and China are expected to account for almost all biogas production. However, the contribution of biogas to total bioenergy production is expected to remain very small and far less than primary solid biomass and liquid biofuels.
Figure 3 Outlook for TPES from biogas by region 2010 - 2030
Source: based on IEA (2006).
3.4
Bioethanol used for fuel
The outlook for bioethanol consumption is shown in Figure 4. Consumption is expected to increase from about 60 million MT in 2010 to 170 million MT in 2030. North America accounts for the majority of projected consumption and most of this increase.
0 5 10 15 20 25 2010 2015 2020 2025 2030 Year P rima ry ener g y s up ply in M T O E Africa South Asia Middle East and North Africa Latin America and Caribbean
Europe and Central Asia
East Asia and Pacific Australia, Japan, New Zealand European Union (27) + 3 North America
Latin America and the Caribbean accounts for the second largest share of projected bioethanol consumption, led by Brazil. In the projections for the EU and East Asia and the Pacific significant growth is expected due to the establishment of blending mandates. Other regions account only for a small share of projected consumption. It is worth noting that significant growth in consumption will occur in Japan if a blending mandate will be introduced.
Figure 4 Outlook for bioethanol consumption for fuel by region 2010 - 2030
Source: based on IEA (2006) and national policy targets.
3.5
Biodiesel
The outlook for biodiesel consumption is shown in Figure 5. It is projected a high increase from under 20 million MT in 2010 to almost 65 million MT in 2030. In the initial part of the projection, the EU accounts for the majority of the projected increase, but growth in developing countries (India and China in particular) accounts for most of
0 20 40 60 80 100 120 140 160 180 2010 2015 2020 2025 2030 Year Co ns um ptio n in mi llio n M T Africa South Asia Middle East and North Africa Latin America and Caribbean
Europe and Central Asia
East Asia and Pacific Australia, Japan, New Zealand European Union (27) + 3 North America
the expected growth in consumption after 2020. Furthermore, developing countries are expected to overtake developed countries in biodiesel consumption in 2020.
Figure 5 Outlook for biodiesel consumption by region 2010 - 2030
Source: based on IEA (2006) and national policy targets.
3.6
Total bioenergy supply and contribution to TPES
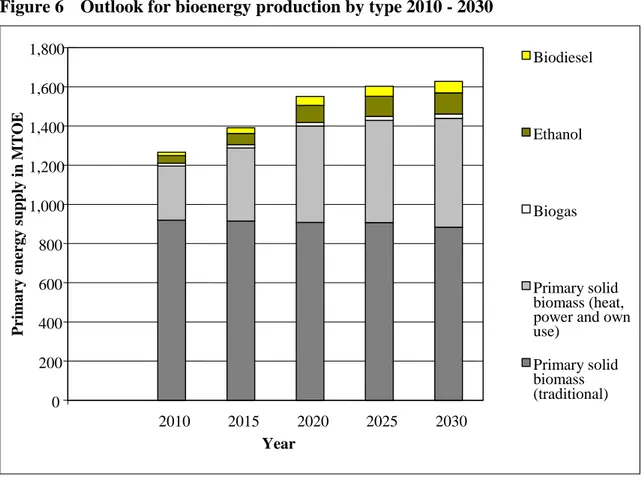
Figure 6 shows the outlook for bioenergy production by type. Traditional uses of biomass (wood and agricultural residues) are expected to decline slightly, while modern uses of primary solid biomass are expected to increase significantly, mainly driven by expected increases in developed countries, especially in the EU. The share of primary solid biomass in total bioenergy production will remain high despite the significant projected increases in liquid biofuel consumption.
0 10 20 30 40 50 60 70 2010 2015 2020 2025 2030 Year Co n sum p tio n in m il lio n MT Africa South Asia
Middle East and North Africa Latin America and Caribbean Europe and Central Asia
East Asia and Pacific Australia, Japan, New Zealand European Union (27) + 3 North America
Figure 6 Outlook for bioenergy production by type 2010 - 2030
Source: based on Cushion E., Whitemand A. and Dieterle G. (2010) 21, IEA (2006), FAO (2008a) 22 and Broadhead et al (2001).
The dynamics of some of the expected changes in the structure of bioenergy production are shown for each region in Figure Figure7. In particular, this shows the difference between North America and Europe. It also shows how some developing regions (e.g. East Asia and the Pacific, South Asia and Latin America and the Caribbean) will start to make progress using more advanced forms of bioenergy such as energy production from modern solid biomass systems and liquid biofuels.
21Cushion E., A. Whitemand and G. Dieterle, (2010), Bioenergy Development. Issues and Impacts for Poverty and Natural Resource Management. The World Bank, Washington, D. C.
22 FAO, 2008b, FAOSTAT – FAO’s online statistical database: available at: http://faostat.fao.org.
0 200 400 600 800 1,000 1,200 1,400 1,600 1,800 2010 2015 2020 2025 2030 Year Pri m ary e nerg y sup pl y i n MTO E Biodiesel Ethanol Biogas Primary solid biomass (heat, power and own use)
Primary solid biomass (traditional)
Figure 7 Contribution of solid, gas and liquid biofuels to bioenergy in 2005 and 2030
Source: Cushion E., Whitemand A. and Dieterle G. (2010), based on IEA (2006), FAO (2008a) and Broadhead et al (2001).
3.7
Implications of the bioenergy outlook
The projections above show some significant shifts in bioenergy production in the future, including an expansion in bioenergy consumption in developed regions and Latin America and the Caribbean; a decline in consumption in South Asia and East Asia and the Pacific but with a shift towards more modern forms of bioenergy; and increased production of traditional bioenergy in Africa.
In developing countries, the positive impact that these changes may bring will depend on the opportunities for income, employment generation and conditions, productivity, export opportunities, as well as their potential to increase access to modern forms of bioenergy. However, the increased consumption of bioenergy could also result in challenges like an increased competition for land that will have an impact on agriculture
0 50 100 150 200 250 300 350 400
Africa South Asia Middle East and North Africa Latin America and Caribbean Europe and Central Asia East Asia and Pacific Australia, Japan, New Zealand European Union (27) + 3 North America
Primary energy supply in MTOE
Primary solid biomass (traditional) Primary solid biomass (heat, power and own use)
Biogas Ethanol
Biodiesel
2005 2030
and forestry, and could negatively affect the poor through changes in access to energy resources, food security and overall environmental quality. These aspects will be analyzed further on in this report.
Finally, many of the potential impacts outlined above are also likely to affect other countries through global markets for food and forest products.23
23 Al-Riffai P., Bimaranan B., and Laborde d., 2010. European Union and United States Biofuel mandates. Impacts on world Markets. Inter-American Development Bank.
Chapter 4. Bioenergy development at regional level – Case Studies
This chapter examines scenarios for bioenergy developments in each of the main global regions and some of the major countries within those regions.24
For each region and group of countries, the text is divided into two parts. The first part presents the baseline scenario for future production and consumption of bioenergy. The second part introduces remarks and challenges that may be addressed.
4.1
North America
4.1.1 Baseline scenario for production and consumption
North America (Canada and United States of America) is currently the world’s leading biofuel producing region with a market share of roughly 46% in 200825, consisting almost entirely of first generation biofuel. According to the ambitious biofuels mandate in the Renewable Fuels Standard26, the United States will have to increase its biofuel production significantly within the next 15 years, in particular that of cellulosic ethanol which is not commercially available yet despite the RD&D efforts.
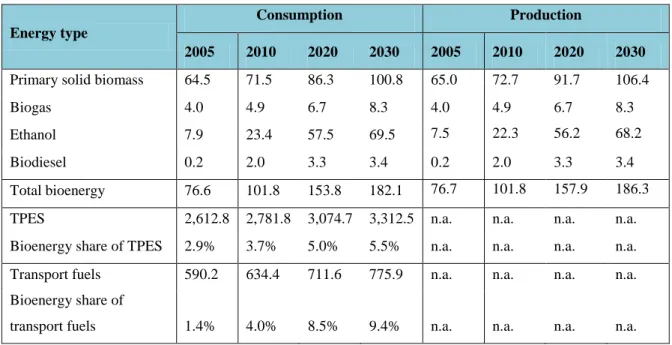
The baseline scenario for bioenergy production and consumption in North America is presented in Table 1. The two main areas of future growth are likely to be greater production and consumption of primary solid biomass and ethanol (particularly in the USA).
All of the expected increase in production and consumption will occur in modern uses of primary solid biomass while traditional uses of primary solid biomass are expected to remain flat or decline slightly in the future. Furthermore, about half of this increase is expected to occur in own uses of biomass for energy in the forest industry and the other half is expected to occur in power generation. In addition, production is expected to increase slightly more than consumption.
24 This chapter is mostly based on Cushion E. A. Whitemand and G. Dieterle, (2010), Bioenergy Development. Issues and Impacts for Poverty and Natural Resource Management. The World Bank,
Washington, D. C.
25
IEA 2009b. Medium Term Oil Market Report, OECD/IEA, Paris.
26 EPA, 2008, Renewable Fuel Standard Program, US Environmental Protection Agency, Washington
Table 1 Baseline scenario for bioenergy in North America (in MTOE)
Energy type
Consumption Production
2005 2010 2020 2030 2005 2010 2020 2030
Primary solid biomass 64.5 71.5 86.3 100.8 65.0 72.7 91.7 106.4 Biogas 4.0 4.9 6.7 8.3 4.0 4.9 6.7 8.3 Ethanol 7.9 23.4 57.5 69.5 7.5 22.3 56.2 68.2 Biodiesel 0.2 2.0 3.3 3.4 0.2 2.0 3.3 3.4 Total bioenergy 76.6 101.8 153.8 182.1 76.7 101.8 157.9 186.3 TPES 2,612.8 2,781.8 3,074.7 3,312.5 n.a. n.a. n.a. n.a. Bioenergy share of TPES 2.9% 3.7% 5.0% 5.5% n.a. n.a. n.a. n.a. Transport fuels 590.2 634.4 711.6 775.9 n.a. n.a. n.a. n.a. Bioenergy share of
transport fuels 1.4% 4.0% 8.5% 9.4% n.a. n.a. n.a. n.a.
Source: based on IEA (2006) Note: n.a. not available
Currently, wood accounts for the majority of primary solid biomass used for energy in North America and, due to expected increases in agricultural production in the future (including energy crops for ethanol production), it seems likely that wood will remain the dominant fuel used in this sector. Bioenergy production in wood raw material equivalent is expected to increase from about 250 million m3 in 2005 to 405 million m3 in 2030. About 50 million m3 of this increase in production is expected in heat and power production (mostly in the USA), pellet exports (mostly from Canada to Europe) will account for about 20 million m3 and the remaining 85 million m3 will occur in own uses of biomass for energy in the forest industry.27
In the ethanol sector, the USA accounts for almost all North American consumption (about 98.5% in 2005, projected to fall to 95% in 2030 as Canadian consumption increases). However, imports from Brazil and the Caribbean have accounted for an average of about 5% of USA consumption in recent years and it is assumed that this share of imports in consumption will continue in the future.
27
Ethanol production in the USA is currently almost entirely based on maize so, with a conversion factor of around 400 litres of ethanol (= 0.2 TOE) per one MT of maize, the use of maize for ethanol in the USA was around 38 million MT in 2005. For the future, the recent Renewable Fuel Standard (RFS) has capped the use of conventional biofuels (made from maize and sugar, including imports) at 15 billion gallons (or about 57 billion litres) from 2015. Thus, from 2015 to 2030, the amount of maize used for ethanol production in the USA (assuming imports meet 5% of the RFS cap) should remain at around 135 million MT.28 Revisions to the RFS, adopted in 2010, increase the required renewable fuel volume to be used for transport to the annual 36 billion gallons from 2022.
In addition to conventional biofuels, ethanol produced from other feedstocks is projected to rise from almost zero at present to 20 billion gallons (76 billion litres or 38 MTOE) in 2030. The majority of this is expected to be cellulosic ethanol derived from biomass (from various sources). The conversion of cellulose to ethanol currently yields about 250 litres (65 gallons) per MT of dry biomass, but could reach 350 litres (90 gallons) per MT with improvements in technology. Therefore, using the mid-point of this range, the amount of biomass required to meet this target would amount to around 250 million MT.
Canadian ethanol production is currently based on maize and wheat (roughly two-thirds and one third respectively) and international trade in ethanol is not significant. Therefore, ethanol production in 2005 probably used about 400,000 MT of maize and slightly less than 200,000 MT of wheat (the ethanol yield of wheat per MT is slightly higher than for maize). With the projected increase in production and consumption and assuming that half of future production will eventually come from cellulose (as in the USA) and the shares of maize and wheat stay the same, consumption of feedstocks in 2030 would amount to: 4.3 million MT of maize; 2.1 million MT of wheat; and 16.3 million MT of biomass.
28 Ibidem.
Biodiesel production and consumption are also projected to increase significantly over the next few decades, although the overall size of this sector is relatively small compared with ethanol. Statistics for imports of biodiesel into North America are not readily available - but believed to be small - and the majority of domestic production is manufactured from soybeans (in the USA), rapeseed (planned in Canada) and waste oils and fats.
Production of biodiesel in the USA in 2005 probably used up to 1.3 million MT of soybean production (at a yield of 60 gallons or 225 litres of biodiesel per MT of soybeans). By 2030, the increase in biodiesel production would require up to 17.2 million MT of soybeans. No significant production of biodiesel was recorded in Canada in 2005, but the projected production of biodiesel in 2030 would require up to 1.1 million MT of rapeseed (at a yield of 0.4 MT biodiesel per MT of rapeseed).29
4.1.2 Remarks and challenges
The scenario presented here suggests that bioenergy developments in North America will result in a doubling of the contribution of bioenergy to TPES and a several-fold increase in their contribution to transport fuel use, but the level of these contributions will remain quite modest.
The main socio-economic impacts of these developments in North America are likely to be increased income and employment in the agricultural sector and changes in household expenditure on food. On the contrary, the main negative effect is likely to be increases in food prices that will occur due to the increased demand for commodities (this has already happened in 2008).
The main environmental impacts of bioenergy developments in North America are likely to be the impacts on biodiversity, land and water resources from land-use changes and intensification of production, and the overall impact of these changes on energy intensity and greenhouse gas emissions.
29
With respect to the latters, all of the four main feedstocks currently used for bioenergy production in North America have high fossil fuel energy intensities and result in relatively low net greenhouse gas emissions.
The most significant challenge for North America is to rapidly improve research and development in order to reduce the cost of cellulosic ethanol feedstock production, transport and conversion technologies.
4.2
Latin America and the Caribbean
4.2.1 Baseline scenario for production and consumption
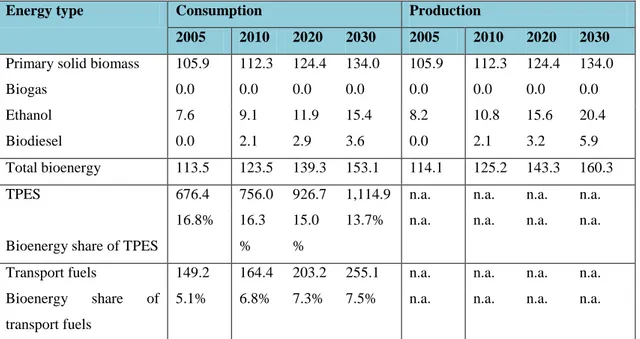
The baseline scenario for bioenergy production and consumption in Latin America and the Caribbean is presented in Table 2. Bioenergy consumption in this region is expected to increase by 2020, due to policies and targets for renewable energy and liquid biofuels in addition to general economic trends in this direction.
Table 2 Baseline scenario for bioenergy in Latin America and the Caribbean (in MTOE)
Energy type Consumption Production
2005 2010 2020 2030 2005 2010 2020 2030
Primary solid biomass 105.9 112.3 124.4 134.0 105.9 112.3 124.4 134.0 Biogas 0.0 0.0 0.0 0.0 0.0 0.0 0.0 0.0 Ethanol 7.6 9.1 11.9 15.4 8.2 10.8 15.6 20.4 Biodiesel 0.0 2.1 2.9 3.6 0.0 2.1 3.2 5.9 Total bioenergy 113.5 123.5 139.3 153.1 114.1 125.2 143.3 160.3 TPES 676.4 756.0 926.7 1,114.9 n.a. n.a. n.a. n.a.
Bioenergy share of TPES
16.8% 16.3 %
15.0 %
13.7% n.a. n.a. n.a. n.a.
Transport fuels 149.2 164.4 203.2 255.1 n.a. n.a. n.a. n.a. Bioenergy share of
transport fuels
5.1% 6.8% 7.3% 7.5% n.a. n.a. n.a. n.a.
Source: Cushion E., Whitemand A. and Dieterle G. (2010), based on IEA (2006) and FAO (2008c)
Despite the Latin America and the Caribbean region is already a significant net exporter of ethanol, higher net exports of ethanol and biodiesel are expected in the future thank to the competitiveness of production in this region.
Primary solid biomass represents the main bioenergy production in the region and it is expected to increase significantly by 2030. While traditional biomass use (mostly woodfuel) is expected to increase by about 10%, a modern uses of biomass for energy is expected to increase by about 5%.
With reference to ethanol production and consumption, this region is the largest producer (Brazil accounts for the majority of the production) and second largest consumer (after North America) in the world. Sugar cane is the main feedstock for ethanol production and is likely to remain as such in the future. A part from Brazil, currently using around half of its sugar cane for ethanol production, other countries in the region are planning or starting to increase ethanol production. For this purpose some of them have already fixed targets for ethanol use as a transport fuel.
If we focus on the Brazilian experience with ethanol as a gasoline additive it dates back to the 1920s, and it was only in 1975, with the launching of the National Ethanol Program (ProAlcool), that the government created the necessary conditions for the sugar and ethanol industry to become, three decades later, one of the most modern in the world. Over the last thirty years, the use of ethanol was utilized as a substitute for gasoline. As a consequence, the Brazilian energy mix is one of the cleanest in the world and currently more than 45% of all energy consumed comes from renewable sources, reflecting the combined use of hydroelectricity (14.5%), and biomass (30.1%) in 2006. The use of sugar cane in the internal renewable energy supply increased from 31% in 2005 to 32.2% in 2006, representing 14.5% of total internal energy supply.
Biodiesel production and consumption in this region is currently very limited, but several countries have or are planning to introduce biodiesel targets. In addition, some countries are targeting biodiesel production as an export opportunity. This will be at the core of the following chapter. The feedstocks used to produce biodiesel are mostly oil palm and soybeans.
4.2.2 Remarks and challenges
The scenario for this region highlights that the contribution of bioenergy to TPES will decline slightly and its contribution to transport fuels will increase slightly. Bioenergy development in this region is currently driven by its competitive advantage, which is mostly based on expansion of large-scale and intensive feedstock production.
The developments in the region are likely to contribute to rural development with a small positive impact expected on energy security. The bioenergy industry - considering the entire chain from feedstock production, conversion and use – is among the productive sectors that employ the highest number of workers in the region and this has a positive impact on socio-economic aspects. On the other side, land-use change is likely to be a major factor affecting both the environmental and socio-economic impacts of these developments.
If we focus on the Brazilian experience it is worth mentioning that official data (Ministry of External Relations of Brazil) highlights that Brazilian ethanol contributed to prevent emissions of 850 million tons of CO2/eq in 30 years; 35 million tons of
CO2/eq in 4 years only in Sao Paulo State, equivalent to the contribution of a forest of 118 million trees. Furthermore, from a social point of view bioethanol in Brazil contributed to create 835 thousand jobs in 440 plants and 95% of formal jobs are linked to the bioethanol industry.
Second generation biofuels in the region are less attractive than first generation. It is uncertain if the new technology could become a driver in the region to increase agricultural productivity and free land for feedstock production. The current situation in the region suggests that available land will be used to produce feedstocks like sugarcane and oil palm for first generation biofuels, while second generation biofuels would use residues of such production processes.30
30 IEA, 2010. Sustainable production of second-generation biofuels. Potential and perspectives in major economies and developing countries, OECD/IEA, Paris.
4.3
Australia, Japan and New Zealand
4.3.1. Baseline scenario for production and consumption
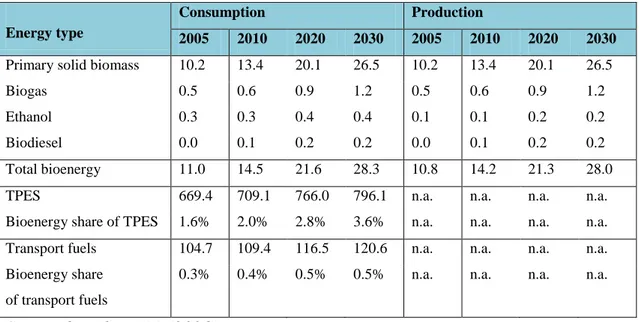
The baseline scenario for Australia, Japan and New Zealand is presented in Table 3. Most bioenergy will be produced from primary solid biomass (largely in the forest industry), along with small amounts of ethanol and biodiesel production.
Table 3 Baseline scenario for bioenergy in Australia, Japan and New Zealand (in MTOE)
Energy type
Consumption Production
2005 2010 2020 2030 2005 2010 2020 2030
Primary solid biomass 10.2 13.4 20.1 26.5 10.2 13.4 20.1 26.5 Biogas 0.5 0.6 0.9 1.2 0.5 0.6 0.9 1.2 Ethanol 0.3 0.3 0.4 0.4 0.1 0.1 0.2 0.2 Biodiesel 0.0 0.1 0.2 0.2 0.0 0.1 0.2 0.2 Total bioenergy 11.0 14.5 21.6 28.3 10.8 14.2 21.3 28.0 TPES 669.4 709.1 766.0 796.1 n.a. n.a. n.a. n.a. Bioenergy share of TPES 1.6% 2.0% 2.8% 3.6% n.a. n.a. n.a. n.a. Transport fuels 104.7 109.4 116.5 120.6 n.a. n.a. n.a. n.a. Bioenergy share
of transport fuels
0.3% 0.4% 0.5% 0.5% n.a. n.a. n.a. n.a.
Source: based on IEA (2006) Note: n.a. not available
Total bioenergy production from primary solid biomass is expected to increase by 150% by 2030 in this group of countries.
Most ethanol in the region is currently consumed in Japan, which imports almost all of its requirements from Brazil. Ethanol use in Australia and New Zealand is currently relatively small, but is projected to rise over the next few years as current liquid biofuel targets take effect. As in Japan, also in these two countries policies are currently under discussion and may result in future ethanol use increasing by more than shown here.
Ethanol in Australia is produced from cereals and sugar cane, while New Zealand expects to import most of its ethanol requirements. Some of this future feedstock
requirement could be re-orientated with the introduction of second-generation biofuel technologies.
Biodiesel consumption in Japan is currently negligible and there are currently no plans to increase its use. A very small amount is produced from waste vegetable oils and the remainder is imported. The scenario presented above assumes no significant changes from the present situation. The main drivers for the development of bioenergy in Japan are the mitigation of climate change, creation of a recycling-oriented society, development of the agricultural sector and the creation of competitive industrial technologies31.
The current liquid biofuel targets for Australia and New Zealand suggest that biodiesel consumption will also increase by a modest amount in the next few years. Currently, all production of biodiesel in Australia uses tallow and waste vegetable oil and mostly tallow in New Zealand. In the future feedstock use in Australia and New Zealand is expected to diversify, including rapeseed, jatropha, imported palm oil, and, possibly, pongamia. In addition, the development and introduction of second-generation technology could also reorient feedstock demand towards biomass.
4.3.2 Remarks and challenges
The scenario for this group of countries suggests that bioenergy developments will result in a modest increase in the contribution of bioenergy to TPES and transport fuel use (see Table 3 above). These developments are also likely to make a positive impact on climate change in light of national countries’ policies.
In light of this relatively modest level of expected bioenergy development in this group of countreis, the socio-economic impacts of these developments are likely to be quite small. Similarly, with respect to food prices, these developments are not likely to have a major impact.
The policy strategy of the Japanese government addresses the main technological and policy challenges related to the development of bioenergy with the aim of helping national industries to compete with countries that have a longer tradition of bioenergy utilization. On the other side, Australia and New Zealand have strong potential to expand their forest resources, which could lead to further environmental benefits in terms of climate change, soil quality and, possibly, biodiversity. The significant amount of degraded and under-utilised land in Australia presents another opportunity that could be explored for appropriate bioenergy development.
4.4
East Asia and the Pacific
4.4.1 Baseline scenario for production and consumption
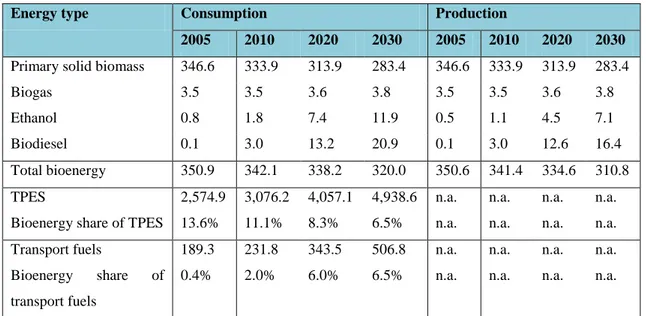
The baseline scenario for bioenergy production and consumption in East Asia and the Pacific is presented in Table 4. Within this region, China accounts for most of the developments shown below, but a few other countries register also quite significant developments like Indonesia, Malaysia, Thailand, Vietnam and the Philippines.
Table 4 Baseline scenario for bioenergy in East Asia and the Pacific (in MTOE)
Energy type Consumption Production
2005 2010 2020 2030 2005 2010 2020 2030
Primary solid biomass 346.6 333.9 313.9 283.4 346.6 333.9 313.9 283.4 Biogas 3.5 3.5 3.6 3.8 3.5 3.5 3.6 3.8 Ethanol 0.8 1.8 7.4 11.9 0.5 1.1 4.5 7.1 Biodiesel 0.1 3.0 13.2 20.9 0.1 3.0 12.6 16.4 Total bioenergy 350.9 342.1 338.2 320.0 350.6 341.4 334.6 310.8 TPES 2,574.9 3,076.2 4,057.1 4,938.6 n.a. n.a. n.a. n.a. Bioenergy share of TPES 13.6% 11.1% 8.3% 6.5% n.a. n.a. n.a. n.a. Transport fuels 189.3 231.8 343.5 506.8 n.a. n.a. n.a. n.a. Bioenergy share of
transport fuels
0.4% 2.0% 6.0% 6.5% n.a. n.a. n.a. n.a.
Source: Cushion E., Whitemand A. and Dieterle G. (2010), based on IEA (2006) and FAO (2008c)
In this region, total bioenergy production and consumption is expected to decline due to a fall in traditional uses of primary solid biomass for energy as incomes rise. However, liquid biofuel production and consumption is expected to increase significantly over the next two decades. Furthermore, the region is expected to become the world’s largest net importer of liquid biofuels.
In the primary solid biomass sector, production of bioenergy within the forest and agricultural processing sectors is expected to increase by 2030, as well as heat and power production. In contrast, traditional uses of forest and agricultural biomass should fall dramatically over the same period. The majority of the increase in heat and power production is expected to be accounted in China, mostly due pellets made from agricultural residues. Indonesia is also expected to increase heat and power production from biomass by a significant amount.
In the liquid biofuels sector, China again accounts for the majority of growth in production and consumption. Thailand and the Philippines also have targets for ethanol and biodiesel, while Indonesia and Malaysia have targets for biodiesel. Ethanol production in China currently uses corn, wheat and cassava as main feedstocks, but future production is expected to come from corn, cassava, sugar cane and sweet sorghum. However, China expects to import about half of its ethanol requirements in the future.
Biodiesel production in China is currently quite limited and is based mainly on the use of waste cooking oils. The main difficulty of biodiesel production in China is the lack of feedstock. For this reason China is the largest importer of soybeans and imports significant quantities of other oil-based products32. Oil palm is likely to be the main feedstock used in the rest of the region with, possibly, some small amounts of jatropha. Indonesia and Malaysia are expected to produce biodiesel exceeding domestic needs and resulting in exports of biodiesel to other countries.
32 Ibidem.
4.4.2 Remarks and challenges
The contribution of bioenergy to TPES is expected to decline by more than half by 2030, while its contribution to transport fuels will increase significantly (see Table 4 above). This overall decline is due to an expected decrease in traditional uses of primary solid biomass for bioenergy combined with a doubling of TPES as the region develops. A significant increase in modern uses of biomass for energy is expected. Although declining, traditional uses of biomass for bioenergy will remain significant.
Negative socio-economic and environmental outcomes may happen due to the above developments. The main socio-economic impacts that may arise are higher food prices. Environmental impacts will vary by feedstock, with generally positive impacts only where biofuel feedstocks are planted on degraded land and negative impacts where they are planted on forest land. On this, the replacement of some forest areas with crops for bioenergy feedstock production seems inevitable, but these areas should be chosen in order to minimise negative socio-economic and environmental impacts.
The expected bioenergy development in the region is likely to make a significant contribution to rural development and probably have a positive impact on climate change. Energy security in the region is likely to increase, but a high level of liquid biofuel imports is expected, which will replace some of the current dependence on oil imports.
The challenge for this region is to direct bioenergy development towards non-food crops grown on marginal or degraded land and to produce second-generation liquid biofuels from biomass, considering the abundance of biomass residues that are currently under-utilised and its potential for expansion.
4.5
Europe and Central Asia
4.5.1 Baseline scenario for production and consumption
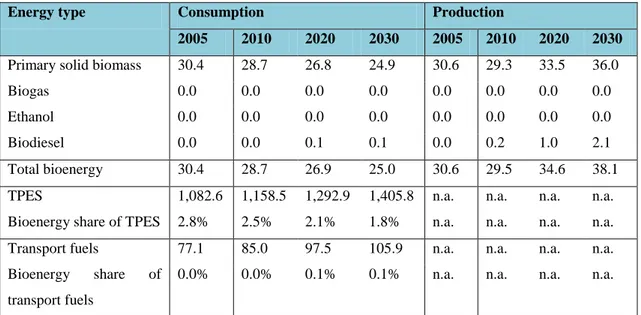
The baseline scenario for bioenergy production and consumption in Europe and Central Asia is presented in Table 5.
Table 5 Baseline scenario for bioenergy in Europe and Central Asia (in MTOE)
Energy type Consumption Production
2005 2010 2020 2030 2005 2010 2020 2030
Primary solid biomass 30.4 28.7 26.8 24.9 30.6 29.3 33.5 36.0 Biogas 0.0 0.0 0.0 0.0 0.0 0.0 0.0 0.0 Ethanol 0.0 0.0 0.0 0.0 0.0 0.0 0.0 0.0 Biodiesel 0.0 0.0 0.1 0.1 0.0 0.2 1.0 2.1 Total bioenergy 30.4 28.7 26.9 25.0 30.6 29.5 34.6 38.1 TPES 1,082.6 1,158.5 1,292.9 1,405.8 n.a. n.a. n.a. n.a. Bioenergy share of TPES 2.8% 2.5% 2.1% 1.8% n.a. n.a. n.a. n.a. Transport fuels 77.1 85.0 97.5 105.9 n.a. n.a. n.a. n.a. Bioenergy share of
transport fuels
0.0% 0.0% 0.1% 0.1% n.a. n.a. n.a. n.a.
Source: Cushion E., Whitemand A. and Dieterle G. (2010), based on IEA (2006) and FAO (2008c)
Note: n.a. not available
Bioenergy consumption in this region is expected to decline in the future due to reductions in the use of primary solid biomass. Production and consumption of liquid biofuels is not expected to increase despite consumption targets in the European Union33. In light of this increased demand in the European Union, it is expected that this region will become an exporter, mostly of biodiesel from rapeseed.
33On 23 April 2009 the European Parliament and the Council adopted the Renewable Energy Directive
(Directive 2009/28/EC) which endorses a mandatory target of a 20 % share of energy from renewable sources in overall Community energy consumption by 2020 and a mandatory 10 % minimum target to be achieved by all Member States for the share of biofuels in transport petrol and diesel consumption by 2020, to be introduced in a cost-effective way. The directive also established sustainability criteria for biofuels. It prescribes to ensure at least 35% greenhouse gas emission saving from the use of biofules compared to fossil fuels. The figure rises at least to 50% as of 2017 and at least 60% as of 2018.
4.5.2 Remarks and challenges
The scenario described above suggests a declining contribution of bioenergy to TPES in the region and its contribution to transport fuels will remain limited.
Considering the relatively modest level of future bioenergy developments projected above, the socio-economic impacts of these developments are expected to be negligible. Some impacts may be registered with respect to food prices due to the projected significant increase in rapeseed production.
The environmental impacts of bioenergy developments in this region are expected to be modest and again mostly related to increased production of feedstocks for biodiesel.
Concluding, these developments are expected to make a modest contribution to rural development and have a small positive impact on climate change. The main challenge for future bioenergy developments in this region could be related to cellulosic ethanol.
4.6
South Asia
4.6.1 Baseline scenario for production and consumption
The baseline scenario for bioenergy production and consumption in South Asia is presented in Table 6. Total bioenergy production in this region is expected to remain about the same in the future, with a slight decrease in primary solid biomass use, but significant growth in liquid biofuel use.
India accounts for around three-quarters of bioenergy production from primary solid biomass in this region, with Pakistan as second.
Table 6 Baseline scenario for bioenergy in South Asia (in MTOE)
Energy type Consumption Production
2005 2010 2020 2030 2005 2010 2020 2030
Primary solid biomass 209.4 212.8 210.2 200.8 209.4 212.8 210.2 200.8 Biogas 0.0 0.1 0.1 0.1 0.0 0.1 0.1 0.1 Ethanol 0.1 0.2 0.9 1.2 0.1 0.2 0.9 1.2 Biodiesel 0.0 1.1 6.1 8.4 0.0 1.1 6.1 8.4 Total bioenergy 209.6 214.1 217.2 210.4 209.6 214.1 217.2 210.4 TPES 657.6 755.4 974.5 1,229.7 n.a. n.a. n.a. n.a. Bioenergy share of TPES 31.9% 28.3% 22.3% 17.1% n.a. n.a. n.a. n.a. Transport fuels 42.7 49.5 66.7 89.8 n.a. n.a. n.a. n.a. Bioenergy share of
transport fuels
0.2% 2.6% 10.5% 10.6% n.a. n.a. n.a. n.a.
Source: Cushion E., Whitemand A. and Dieterle G. (2010), based on IEA (2006) and FAO (2008c)
Note: n.a. not available
With respect to liquid biofuels, India has a target for ethanol consumption and other countries in the region have or are planning biodiesel targets. The region registers a small production of ethanol produced from sugar cane and it is likely that this will remain the main feedstock for ethanol production. The objective of several countries in the region is to become self sufficient in ethanol production. For biodiesel, jatropha is attracting government support and attention from investors.
4.6.2 Remarks and challenges
The scenario for this region suggests that the contribution of bioenergy to TPES will fall by almost half by 2030, but its contribution to transport fuels is expected to increase significantly (see Table 6 above).
These developments are likely to contribute to rural development, have a small positive impact on energy security and relatively few negative environmental impacts. Policies to improve the sustainability of bioenergy production in the region are essential. In this regards it is relevant to mention that a research carried out in 2006 by Wetlands
International and Delft Hydraulics34, shows that palm-oil production in Indonesia was increased to meet demand for biofuels in the European Union by draining and burning peat land, as well by razing huge tracts of the South East Asian rainforest, in combination with overuse of chemical fertilizers. Peat is an organic carbon storage sponge. Draining and burning the peat land, which is 90% water, releases about 2 billion tons of carbon dioxide a year, equivalent to 8% of annual global emissions from the use of fossil fuels. In this case palm oil production in Indonesia produced more harmful emissions than the fossil fuels they replace.
The main challenge for future bioenergy developments in this region could be related to cellulosic ethanol.
4.7
Middle East and North Africa
4.7.1 Baseline scenario for production and consumption
The baseline scenario for bioenergy production and consumption in the Middle East and North Africa is presented in Table 7. Currently, there is no liquid biofuel production and consumption in this region and there are no targets for the future. It is expected that production and consumption will remain at zero in the future. However, primary solid biomass is used for bioenergy production in the region and it is expected to increase.
4.7.2 Remarks and challenges
The scenario for this region suggests that bioenergy contributes to TPES and transport fuels in a negligible manner. Furthermore, this is expected to continue in the future (see Table 7 below). Despite this scenario, small-scale development of drought-tolerant bioenergy feedstocks to be produced on degraded or arid land, and for local use, is being considered by few governments as part of a rural development policy.
34
Hooijer A, Silvius M, Wösten H, Page H and S, 2006. PEAT-CO2, Assessment of CO2 emissions from
drained peatlands in SE Asia, Delft Hydraulics report Q3943.