https://doi.org/10.1177/1352458517694432 https://doi.org/10.1177/1352458517694432 MULTIPLE
SCLEROSIS MSJ JOURNAL
Multiple Sclerosis Journal
2017, Vol. 23(8) 1123 –1136 DOI: 10.1177/
1352458517694432 © The Author(s), 2017.
Reprints and permissions: http://www.sagepub.co.uk/ journalsPermissions.nav
Background
In severe and disabling diseases where the underlying mechanisms are not well understood, hospitalisation generally represents the majority of direct healthcare costs, while production losses dominate overall costs. When effective treatments are introduced, costs shift to outpatient care, while research into the underlying disease mechanisms intensifies. This can lead to fun-damental changes in the management of the disease. A well-known example of this is peptic ulcer disease where, historically, costs were dominated by surgery and loss of work capacity. The advent of the proton pump inhibitors led to better understanding of both the causes and mechanisms of the disease, and the discovery of the role of Helicobacter pylori led both to a cure and a reduction in costs.1
Multiple sclerosis (MS) is currently on a similar jour-ney. Prior to the mid-1990s, hospitalisation repre-sented 80%–90% of MS-related healthcare costs in
the United Kingdom and Sweden.2–4 The introduction and use of disease-modifying therapies (DMTs) over the past two decades has had profound effects on the management of the disease. In parallel, improved diagnostic criteria have enabled earlier diagnosis and treatment.5,6 In addition, a new emphasis has been placed on understanding the mechanisms underpin-ning disability progression, championed by the Progressive MS Alliance.7 Costs have shifted, and outpatient care now represents 80%–90% of MS-related healthcare costs.8 Between the late 1990s and 2008, total societal costs per patient in the early stages of MS rose from around 10,000€–15,000€ to 20,000€–25,000€.9–12 Robust evidence on the effect of early treatment on long-term costs and outcomes is still sparse, however, due to the need to collect real-world data over the entire duration of the disease course. At the same time, public authorities demand proof that their considerable investment in DMTs rep-resents an efficient use of public funds across the
New insights into the burden and costs of
multiple sclerosis in Europe
Gisela Kobelt, Alan Thompson, Jenny Berg, Mia Gannedahl and Jennifer Eriksson; the MSCOI Study Group* and the European Multiple Sclerosis Platform
Abstract
Background: The current focus in multiple sclerosis (MS) is on early diagnosis and drug intervention, with a view to modifying disease progression. Consequently, healthcare costs have shifted from inpatient care and rehabilitation to outpatient care.
Objectives: This European burden of illness study provides data that can be combined with other evi-dence to assess whether management approaches provide value to society.
Methods: A cross-sectional study was conducted in 16 countries. Patients reported on their disease, health-related quality of life (HRQoL) and resource consumption. Descriptive analyses were performed by disease severity. Costs are reported from a societal perspective in 2015€ PPP (adjusted for purchasing power parity). Results: The 16,808 participants had a mean age of 51.5 years, and 52% had relapsing–remitting multiple sclerosis (RRMS). Work capacity declined from 82% to 8%, and utility declined from normal population values to less than zero with advancing disease. Mean costs were 22,800€ PPP in mild, 37,100€ PPP in moderate and 57,500€ PPP in severe disease; healthcare accounted for 68%, 47% and 26%, respectively. Fatigue and cognitive difficulties were reported by 95% and 71% of participants, respectively; both had a significant independent effect on utility.
Conclusion: Costs and utility were highly correlated with disease severity, but resource consumption was heavily influenced by healthcare systems organisation and availability of services.
Keywords: Multiple sclerosis, burden of illness, fatigue, cognition, costs, HRQoL Date received: 14 November 2016; revised: 17 January 2017; accepted: 25 January 2017
Correspondence to:
G Kobelt
European Health Economics, 15 Rue Victor Schoelcher, 68200 Mulhouse, France.
Gisela Kobelt
European Health Economics, Mulhouse, France
Alan Thompson
Institute of Neurology, Faculty of Brain Sciences, University College London, London, UK
Jenny Berg Mia Gannedahl Jennifer Eriksson
Mapi Group, Stockholm, Sweden
*The members of the MSCOI Study Group are listed in Appendix 1.
healthcare system as a whole.13,14 This question is becoming more pressing due to the number of new DMTs in development.15
The cost-effectiveness of interventions in chronic progressive diseases is assessed by linking changes in disability and/or symptoms with changes in health-related quality of life (HRQoL) and resource consumption (costs). Several cost-effectiveness models for MS have been proposed, generally when a new DMT is introduced, and its cost-effectiveness has to be estimated for decisions about reimburse-ment.12,16–18 However, all existing models use clini-cal trial data to estimate changes in outcomes and are thus relevant mostly for the population included in the trials.19 Generally, use in clinical practice expands beyond these groups.20
A number of patient registries collect prospective real-world outcome and safety data.21 Some regis-tries also collect HRQoL data, but none collect com-prehensive data on resource consumption. Thus, cost-effectiveness assessments still require model-ling to link real-world effectiveness data with costs, which have to be collected separately. This is best done using a measure that represents disease state and is also correlated with costs and HRQoL, such as the Kurtzke Expanded Disability Status Scale (EDSS) in MS.19
This study provides data on disease state, costs and HRQoL from 16,808 patients with MS in 16 European countries, reported by severity of disease on the EDSS.
Methods
Patient enrolment
This cross-sectional, observational study was endorsed by the European Multiple Sclerosis Platform (EMSP) and carried out in collaboration with national MS societies and local clinical and economic experts. The methodology was similar to previous studies,8 and the countries included were Austria, Belgium, Czech Republic, Denmark, France, Germany, Hungary, Italy, Netherlands, Poland, Portugal, Russia, Spain, Sweden, Switzerland and the United Kingdom. A standard questionnaire was translated and discussed with each local study group to ensure relevance and easy comprehension. Authorisation from ethics com-missions and informed consent from participants were obtained in all countries. Patients 18 years of age or over were invited to participate by patient
organisations, via direct electronic mail, a printed invitation mailed directly or with a regular informa-tion bulletin, or the organisainforma-tions’ websites and social media platforms, whichever was the most feasible and efficient. In all cases, patients could respond either directly on a study-specific Internet platform or return a paper questionnaire. All responses were fully anon-ymous, with no opportunity to verify answers, com-plete missing information or identify individuals.
Sample size
Resource data are generally highly variable and severely skewed, with few patients having very high resource consumption. We therefore aimed to enrol sufficient participants at each stage of disease severity (defined by EDSS score) in order to estimate the costs related to disease progression, rather than aiming to enrol a representative prevalence sample. In earlier studies, the magnitude of the standard deviation (SD) was stable once a sample size of at least 50 was reached.8 We thus set an optimistic target of enrolling 50–100 patients for each of 11 EDSS scores.
Data
The survey contained questions about patients’ dis-ease (self-assessed EDSS score, relapses and disdis-ease type); demographics (age, gender, living arrange-ments, education and work situation); inpatient care (admissions, day admissions, rehabilitation and nurs-ing homes); outpatient care (consultations, investiga-tions and tests, MS medicainvestiga-tions, relapse treatments, other prescription and non-prescription drugs); equip-ment, aids and investments; community assistance (nurse visits, home help, transportation); and family assistance (informal care). The recall periods for resource use were varied by resource in order to enhance the precision of the answers. Resource use is reported for these recall periods, while costs are annualised.
In addition, measures of difficulties at work and symptoms, such as current fatigue and cognitive impairment, were collected using visual analogue scales (VAS; 0 = no problem, 10 = severe problems). HRQoL was assessed using the EuroQol Five Dimensions questionnaire with three levels per domain (EQ-5D 3L), a standardised, disease-inde-pendent instrument that estimates the level of prob-lems experienced in five domains (mobility, self-care, usual activities, pain/discomfort, anxiety/depression). Answers are related to preference values from the general population to derive an overall utility weight, defined as a value between 1 (full health) and 0
(death), with negative values possible.22 To enable comparisons between countries and with previous studies, the original preference values for the United Kingdom were used.23
Analysis
Responses were analysed as available without source data verification. Incomplete online questionnaires were excluded. For paper questionnaires, rules to han-dle missing resource data were developed. Data for symptoms and HRQoL were analysed as available with no imputation of missing values. Illogical answers related to disease state, occurring mainly in the paper surveys, were adjusted in consultation with the clinical expert.
Outliers for continuous variables were checked using patient listings, graphical inspection (box plots) and application of a pre-defined cut-off (relative to the maximum possible value). Depending on the type of outlier, these were set to missing or replaced using trimmed means (where 5% of extreme values are eliminated) plus one SD. As the resource data fol-lowed a skewed distribution, this pertained only to the upper values.
Unit costs for individual resources were taken from publicly available sources (price lists, tariffs, publi-cations, personal communication from provider organisations) and adjusted, if necessary, to 2015 val-ues using the consumer price index. The analysis is presented from a societal perspective, that is, it includes all costs to all parties. Patient co-payments and other out of pocket expenses are thus included. Productivity losses (sickness absences, early retire-ment, invalidity) were estimated by the human-capi-tal method using the national average age- and gender-adjusted cost of labour. Loss of leisure time for informal care was attributed to all carers, regard-less of age, gender or occupation, and calculated using the national average disposable income after contributions and taxes. As this calculation is based on average salaries for average working hours, costs were capped at 8 hours of care per day, although actual hours of care are reported.
All analyses were done by country and will be reported in detail separately, as will the detailed meth-odology. Here we report summary findings for all 16 countries. Due to the study objective and data collec-tion process, demographic data were expected to vary between the countries, making inter-country compari-sons meaningless. Results are therefore reported for the entire study population, according to EDSS score
or according to three levels of disease severity: mild (EDSS 0–3), moderate (EDSS 4–6.5) and severe (EDSS 7–9). Confidence intervals for mean costs were estimated using the bootstrap method (1000 rep-licates) and reported in 2015 Euros adjusted for pur-chasing power parity (2015€ PPP).
Findings
Sample description
Data were collected over a period of 15 months, as responses from ethics commissions took between 2 weeks and 12 months. The databases were locked at the end of April 2016, with a total of 16,808 valid responses. The full range of EDSS scores was present in each country sample.
Overall, the mean age was 51.1 years, but country means ranged from 38.5 to 56.7 years. This had a direct effect on disease duration, disease severity and workforce participation data. Age at diagnosis and time from first symptoms to diagnosis were higher in older country samples, as these patients had not ben-efitted from newer criteria that enable earlier diagno-sis (Table 1).
The majority of patients in the study had relapsing– remitting MS (52%), of whom 78% received treat-ment with a DMT. Overall, 57% of patients received a DMT, with use declining with higher EDSS scores. Therapies introduced in the last decade represented 46% of DMT use, but this varied substantially between the countries due to affordability issues and delays in reimbursement. At least one relapse had been experienced by 13% of patients during the 3-month reporting period for this data (Table 2).
HRQoL and utility
In multiple regression analysis, EDSS score was, as previously shown,8 the strongest driver of utility, with reductions in utility ranging from −0.051 to −0.925 for EDSS 1–9 (p < 0.001). In addition, fatigue and cognitive difficulties each had an independent impact on utility. After controlling for EDSS, each one-point increase in the VAS scales for fatigue and cognitive difficulties led to a reduction in utility of −0.025 and −0.013, respectively (p < 0.001).
Fatigue and cognitive difficulties were reported very early in the disease course. Fatigue was reported as an issue by 95% of patients, whose mean fatigue VAS scores were 4.9 in mild, 6.0 in moderate and 6.1 in severe disease. Cognitive difficulties were reported
Table 1. Demographics.
Countrya N Proportion
online answers
Mean age Patients below retirement age
Current (SD) At diagnosis (SD) At symptoms (SD) Proportion of sample Proportion working Proportion not working due to MS Russia 208 8% 38.5 (10.5) 32.0 (10.6) 27.8 (9.3) 97% 49% 28% Poland 411 100% 39.7 (12.3) 32.2 (9.8) 27.3 (8.6) 94% 59% 32% Spain 462 83% 42.6 (10.7) 32.1 (10.0) 27.2 (9.0) 96% 45% 37% Italy 1010 80% 45.0 (11.9) 34.2 (10.4) 29.1 (9.2) 94% 56% 20% Czech Republic 747 100% 46.7 (12.0) 31.8 (10.0) 27.5 (9.5) 86% 57% 34% Hungary 521 60% 46.9 (12.0) 33.8 (9.5) 29.3 (9.1) 92% 45% 33% France 491 33% 47.2 (13.1) 35.1 (11.2) 31.5 (10.7) 82% 56% 44% Switzerland 721 99% 48.4 (11.9) 37.2 (10.6) 32.4 (10.5) 90% 65% 28% Portugal 535 9% 48.5 (11.0) 35.9 (11.3) 29.7 (10.4) 92% 43% 47% Germany 5475 12% 51.8 (11.0) 36.3 (10.6) 30.6 (9.8) 82% 51% 43% Austria 516 15% 53.0 (12.4) 35.1 (11.3) 29.5 (10.2) 72% 46% 41% Belgium 1856 11% 54.0 (12.6) 37.7 (11.6) 32.0 (10.4) 66% 44% 47% Netherlands 382 100% 54.0 (10.5) 39.9 (10.4) 31.7 (10.5) 81% 31% 64% Denmark 830 100% 54.3 (10.2) 38.0 (10.2) 30.0 (10.0) 78% 43% 52% Sweden 1864 11% 56.2 (12.0) 40.7 (11.4) 33.2 (11.0) 74% 55% 37% United Kingdom 779 96% 56.7 (10.8) 40.2 (10.9) 32.2 (11.2) 72% 36% 55%
SD: standard deviation; MS: multiple sclerosis.
aSorted by mean age of sample.
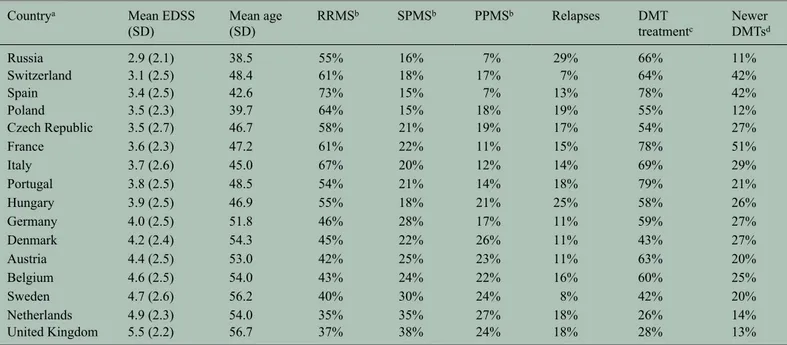
Table 2. Disease information. Countrya Mean EDSS
(SD) Mean age (SD) RRMSb SPMSb PPMSb Relapses DMT treatmentc Newer DMTsd Russia 2.9 (2.1) 38.5 55% 16% 7% 29% 66% 11% Switzerland 3.1 (2.5) 48.4 61% 18% 17% 7% 64% 42% Spain 3.4 (2.5) 42.6 73% 15% 7% 13% 78% 42% Poland 3.5 (2.3) 39.7 64% 15% 18% 19% 55% 12% Czech Republic 3.5 (2.7) 46.7 58% 21% 19% 17% 54% 27% France 3.6 (2.3) 47.2 61% 22% 11% 15% 78% 51% Italy 3.7 (2.6) 45.0 67% 20% 12% 14% 69% 29% Portugal 3.8 (2.5) 48.5 54% 21% 14% 18% 79% 21% Hungary 3.9 (2.5) 46.9 55% 18% 21% 25% 58% 26% Germany 4.0 (2.5) 51.8 46% 28% 17% 11% 59% 27% Denmark 4.2 (2.4) 54.3 45% 22% 26% 11% 43% 27% Austria 4.4 (2.5) 53.0 42% 25% 23% 11% 63% 20% Belgium 4.6 (2.5) 54.0 43% 24% 22% 16% 60% 25% Sweden 4.7 (2.6) 56.2 40% 30% 24% 8% 42% 20% Netherlands 4.9 (2.3) 54.0 35% 35% 27% 18% 26% 14% United Kingdom 5.5 (2.2) 56.7 37% 38% 24% 18% 28% 13%
EDSS: Expanded Disability Status Scale; SD: standard deviation; RRMS: relapsing–remitting multiple sclerosis; SPMS: secondary progressive multiple sclerosis; PPMS: primary progressive multiple sclerosis; DMT: disease-modifying therapy; MS: multiple sclerosis.
a Sorted by mean EDSS of sample. b Missing answers excluded.
c DMT use is influenced by the data collection method: in countries where the responses from the patient associations had to be complemented with patients from
MS centres or other associations where more DMT use must be expected. This applies to Russia, Spain, Poland, France and Portugal.
by 71% of patients, whose mean cognition VAS scores were 4.3, 4.9 and 5.3 in mild, moderate and severe disease, respectively. In the full sample, assign-ing 0 to patients with no problem, mean scores were 3.0, 3.8 and 3.8. In addition, fatigue and cognitive dif-ficulties were the main reasons given for reduced work productivity: fatigue was reported by 70% of participants, cognitive difficulties by 34%, followed by mobility by 28%, pain by 21% and low mood by 18%. The mean VAS score for the effect on work was 3.5 for all participants (Figure 1).
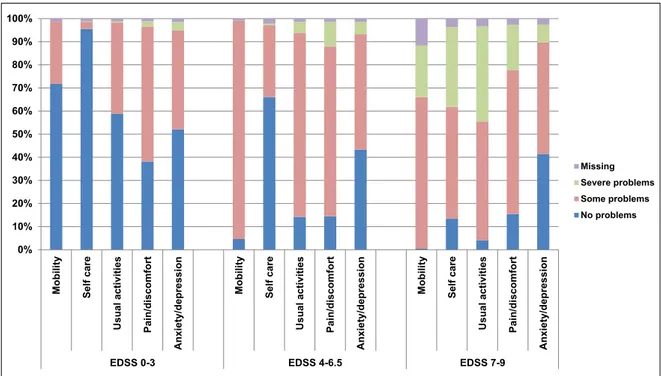
In each of four EQ-5D domains (mobility, self-care, usual activities and pain/discomfort), at least 70% of participants reported problems, the impact of which rose with increasing disease severity (Figure 2). Mean utility scores by EDSS were almost identical in all countries, ranging from normal values at EDSS 0 (0.922) to a state considered worth than death at EDSS 9 (−0.254) (Figure 3(a) and (b)).
Resources used
Healthcare resource use appeared to be driven more by system organisation than by medical need, and dif-ferences between countries were thus substantial. Within a 3-month reporting period, inpatient admis-sions occurred for 7.5% of all participants and day admissions for 9.9%; brain magnetic resonance imag-ing (MRI) was performed in 24.2%. Overall, 74.9% of participants had at least one consultation: 62.2% saw a neurologist, 11.9% saw an MS nurse and 27.7% saw a general practitioner (Table 3). Among paramed-ical professions, physiotherapists were used most (32.7%). Community services were used by 23.3% of participants: 5.7% had home visits by nurses, 14.6% had home help, 10.1% used transportation services and 3.6% had personal assistants.
Family members provided informal care to 46.3% of participants. Both resource use and hours were very much dominated by patients with severe disease, most
Figure 1. Severity of fatigue, cognitive difficulties and reduced productivity at work, by level of disease severity (mean VAS and CI). Answers to all three questions were reported using a visual analogue scale (VAS) from 0 (no problems) to 10 (severe problems). No imputations were made for missing answers The question on cognition was preceded by a yes/ no question about whether participants experienced cognitive difficulties, and patients answering ‘no’ were assigned 0 on the VAS. Answers for productivity were accepted only for participants in employment. Although the severity of fatigue, cognitive difficulties and impact on work productivity increased with increasing EDSS, all factors were present very early in the disease. EDSS: Expanded Disability Status Scale; VAS: visual analogue scale; CI: confidence interval.
of whom required assistance in excess of 8 hours per day (Figure 4).
Resources lost
The proportion of employed participants in each coun-try was primarily influenced by the age of the full sam-ple and ranged from 25.7% to 58.1%, with an overall mean of 41.8%. Among participants below retirement age, however, the proportion in employment was more similar, at around 50% (Table 1). Disease state had a marked effect on the proportion of participants below retirement age in employment, which declined from 81.9% at EDSS 0 to 8.2% at EDSS 9 (Figure 5).
Costs
Costs are dependent on the availability, use and price of services and on disease severity. All of these var-ied between countries, leading to very different mean annual costs per patient and making inter-country cost comparisons meaningless. Costs were related to disease severity (EDSS score) in all countries and were dominated by production losses, non-healthcare costs and DMTs (Figures 6 and 7). Overall mean
costs (in € PPP) for patients with mild, moderate and severe disease were 22,800 (range of country means, 12,600–27,300), 37,100 (22,500–54,700) and 57,500 (27,500–77,600), respectively. The mean cost of relapses occurring during a 3-month reporting period was estimated at 2188€ PPP (patients with EDSS scores 0 to 6) and ranged from 632 to 4569€ PPP depending on the country.
Discussion
Cost of illness studies provide information on all types of costs related to a disease, wherever they occur. Prevalence studies look at costs relating to all patients within a given geographic area and timeframe (generally country-level annual costs) and incidence studies observe costs from diagnosis to cure/death. In MS, both of these approaches are difficult, due to the long disease duration, changing diagnostic criteria and difficulty in surveying a sample representative of prevalence. We have thus chosen to collect data for groups of patients, at all different levels of disease severity. This allows the data to be combined with prevalence data to estimate population-level total costs,12 or with natural history or cohort data to esti-mate lifetime costs for a patient with MS.
Figure 2. Proportion of patients and level of problems in the five domains of the EQ-5D, by level of disease severity (N = 15,429). The EQ-5D 3L addresses five domains of HRQoL, with three levels of answers (no problem, some problems and severe problems). The proportion of patients with no problems decreases rapidly with advancing disease severity in all domains except for anxiety/depression, where similar levels of problems were present at all levels of disease severity. EDSS: Expanded Disability Status Scale; EQ-5D 3L: EuroQol Five Dimensions questionnaire with three levels per domain; HRQoL: health-related quality of life.
Figure 3. Utility scores by level of disease severity (N = 15,429). (a) Utility scores for the total sample by level of disease severity (EDSS). Mean scores and confidence intervals (CIs). (b) Utility scores by country and by level of disease severity EDSS).
The EQ-5D is designed to calculate a single score for HRQoL, a preference-based utility, which anchored between full health (a score of 1) and death (a score of 0). In MS, utility decreases steadily from normal population levels in early disease until EDSS 6.5, then declines steeply to values below zero, a state considered worth than death. The seeming flatness of the curve in the mid range of EDSS score results from the non-linearity of the EDSS scale. EDSS: Expanded Disability Status Scale; EQ-5D: EuroQol Five Dimensions questionnaire.
Table 3. Resource consumption: percent of patients using a resource during a 3-month period. Countrya Mean EDSS Admissions Day admissions Consultations Neurologist MS Nurse GP Physiotherapist MRI Russia 2.9 17% 15% 61% 55% 6% 2% 2% 31% Switzerland 3.1 4% 8% 71% 55% 2% 28% 16% 20% Spain 3.4 4% 27% 75% 65% 20% 28% 16% 23% Poland 3.5 21% 20% 77% 67% 10% 14% 11% 28% Czech Republic 3.5 3% 4% 63% 55% 9% 16% 10% 17% France 3.6 8% 36% 82% 61% 7% 39% 41% 38% Italy 3.7 5% 19% 81% 71% 7% 19% 21% 36% Portugal 3.8 5% 14% 73% 60% 19% 18% 22% 23% Hungary 3.9 16% 8% 81% 69% 10% 32% 18% 16% Germany 4.0 10% 4% 90% 81% 5% 35% 45% 28% Denmark 4.2 3% 4% 65% 33% 32% 13% 26% 11% Austria 4.4 9% 5% 75% 58% 3% 34% 22% 23% Belgium 4.6 10% 17% 88% 68% 14% 43% 58% 34% Sweden 4.7 3% 10% 60% 34% 24% 9% 21% 18% Netherlands 4.9 5% 9% 70% 44% 21% 15% 33% 11% United Kingdom 5.5 4% 7% 67% 25% 27% 34% 19% 5%
EDSS: Expanded Disability Status Scale; MS: multiple sclerosis; GP: general practitioner (family doctor); MRI: magnetic resonance imaging.
aSorted by mean EDSS.
Figure 4. Use of informal care by patients at different levels of disease severity (N = 7176). In all, 42% of patients require assistance from their families, with the intensity of usage concentrated in the group with severe disease which represented 34% of users (N = 2414). The mildly severe disease group represented 20% (N = 1433) and the moderately severe disease group 46% (N = 3329). Most of the respondents in the severe disease group use family help around the clock. The intensity of usage is, however, also dependent on the availability of community support, family structure and traditions: better community support reduces the need for informal care (e.g. Sweden, Switzerland); families in Mediterranean countries are often larger and more support is available (e.g. Italy, Spain, Portugal). Mild: EDSS 0–3; moderate: EDSS 4–6.5; severe: EDSS 7–9.
Figure 5. Workforce participation: proportion of patients below retirement age (N = 13,391) employed or self-employed (N = 6769). Workforce participation decreases rapidly with advancing EDSS, from normal population levels at EDSS 0 to only a few patients being able to work at EDSS 9. EDSS: Expanded Disability Status Scale.
Figure 6. Mean total annual cost per patient by disease severity and resource type, 2015€ PPP (N = 16,808). Results are presented for the main resource categories and by disease severity. Early in the disease, the cost of DMTs dominates, while late in the disease, community services and informal care represent a large proportion of costs. Production losses play a major role in moderate and severe disease. Costs are converted to Euros and adjusted with purchasing power parity according to GDP. EDSS: Expanded Disability Status Scale; PPP: purchasing power parity.
A number of factors may have influenced the compo-sition of our sample populations. We collected data
with the help of patient organisations, both online and on paper, which leads to some degree of bias. Patient
Figure 7. Mean total annual cost per patient by EDSS score, 2015€ PPP (N = 16,808). (a) Mean total annual costs in the study sample by EDSS score, 2015€ PPP (N = 16,808). Costs are adjusted with purchasing power parity (PPP) and confidence intervals (CIs) calculated with the bootstrap method (1000 replicas). (b) Mean total annual cost per patient by country and by EDSS score, 2015€ PPP (N = 16,808). Total annual costs per patient in early disease are very similar in all countries when adjusted to €PPP, but start to differ at higher EDSS scores. Particularly in severe disease, costs are highly variable between countries according to the provision of services, with Sweden, Denmark and Switzerland providing the most support. EDSS: Expanded Disability Status Scale; PPP: purchasing power parity.
organisations provide an opportunity to enrol partici-pants with all levels of disease severity, but depending on the association’s activities, its membership may be biased towards older or younger people. Enrolment may also be biased towards more active and involved patients because they are on treatment and online data collection will favour a younger and better-educated population. Thus, the cost estimate and patient-reported outcome data from this study would need to be adjusted using prevalence data before they are rep-resentative of the overall MS population. However, these biases only minimally affect estimates by dis-ease severity (EDSS score).
The proportion of participants receiving a DMT was higher than expected in some countries, particularly those in which the participants had a lower mean age or where the sample had to be augmented with partici-pants recruited through MS centres or other sources (France, Spain, Poland, Portugal and Russia). As DMT use represents the majority of healthcare costs, especially for patients with mild MS (Figure 6), this raises the question of whether DMT costs from this study can be adjusted to reflect the proportion of patients on treatment in the overall MS population. DMTs have an effect on relapse rate and thereby on change in EDSS score. Therefore, it could be expected that the total costs for patients with the same EDSS score and no relapses should be similar if DMT costs are excluded. We investigated this in the German sample as it provided sufficiently large subgroups. However, we found that patients on DMTs had slightly but statistically significantly higher costs due to more intensive management. Thus, adjustments are not straightforward.
Our DMT costs are also likely to be overestimated. As actual selling prices are not public, list prices were used to calculate the average cost per patient. In recent years, however, the market for expensive treatments has seen a number of price adjustments in the form of mandatory or voluntary discounts, special national or local contract agreements, special forms of distribu-tion or bundling.24,25 As a consequence, list prices will overestimate the actual cost of DMTs, particularly in countries with lower gross domestic product (GDP). We partly addressed this by assuming that price reductions are set according to economic wealth and adjusting costs (including DMT costs) using PPP. This may only partly be the case, however, and does not allow for other forms of discount that are known to exist.
It is noteworthy that total costs per patient are similar across countries for participants with mild MS (EDSS
0–3). This could result from a number of factors. First, healthcare costs – in particular DMTs – consti-tute the majority of costs in this group, while fewer community services are required and employment status is still relatively unaffected. DMTs have similar list prices across Europe and differences in our esti-mates could result mainly from differences in pre-scribing patterns. This appears not to be the case in our sample, however. A second interpretation could be that the importance of early intervention with a DMT6 leads to a concentration of healthcare resources on this patient group, even in less wealthy countries. As MS progresses and becomes more severe, dispari-ties between countries appear owing to differing availability and use of community services.
The intensity of healthcare service use varied widely across the countries and appeared unrelated to differ-ences between the sample populations. Rather, this reflects differences in healthcare organisation, medi-cal traditions, ease of access and – most importantly – availability of given services. Hence, each country needs to be considered in its own right, and few gen-eral observations can be made.
Using questionnaires to collect patient-reported data has the advantage of enabling data on HRQoL and symptoms to be related to disease severity. This approach can, however, lead to uncertainty related to clinical features (e.g. type of MS) and recall bias. Indeed, the proportions of patients with primary pro-gressive multiple sclerosis (PPMS) in our sample populations is higher than the known prevalence of PPMS. This attests to the difficulty classifying MS by type, which itself is subject to ongoing discussions.26 In addition, all types of MS are present at some of the EDSS scores; therefore, in this study, we ignore dis-ease type and focus on EDSS score. Recall bias has been shown to be a very minor problem in previous studies. For example, data on the mean number of sick days (from insurance companies) and hospitali-sations (sourced from patient charts) differed by only half a day from those reported by patients.11 The advantage of using questionnaires is therefore more important than the drawbacks.
Previous large cost of illness studies have shown simi-lar results for utility (Figure 3),8 but have not included information on fatigue and cognition. Although we collected these data using VAS rather than validated instruments in order to minimise questionnaire length, the answers can still provide insight. Interestingly, ferences between countries were small, despite the dif-ferences in the sample populations presented earlier. Fatigue was experienced by practically all patients,
and mean VAS scores were similar for mild, moderate and severe disease. Fatigue was also the most burden-some symptom for employed patients, although it was more pronounced in patients who were not working (VAS score 6.0 vs 5.0 for employed patients). These data cannot confirm, however, whether fatigue was a cause for leaving the workforce. Cognitive difficulties were reported by over 70% of patients, and VAS scores were similar at different disease severities (as for fatigue). A similar pattern has been shown previ-ously.27 Several confounders for self-reported cogni-tive difficulties have been found: fatigue,28 depression29 and anxiety.30 In our sample, 95% of patients reported fatigue, 14% reported treatment for depression and 50% reported problems in the EQ-5D anxiety/depres-sion domain. These symptoms were only weakly cor-related with EDSS score, and an interesting question would be whether a given level of difficulties was interpreted differently by patients with different dis-ease severities due to differences in demands or a cop-ing effect. Regardless of the underlycop-ing causes and confounders, however, we believe that how patients report that they feel is of primary importance.
Future research
Our study highlights a number of areas for further research. In order to estimate the total burden of MS in Europe, new epidemiological studies are needed that estimate prevalence by disease severity (EDSS score), rather than by disease type. This may be facili-tated using self-assessed EDSS scores that have shown an excellent correlation with clinician-assessed EDSS.31 In addition, we need new estimates of DMT use, ideally also by disease severity. Further research into how fatigue, cognition, depression and anxiety affect employment and community participation is warranted. Research on healthcare services should investigate the differences evident in our study between systems, incentives and payment-driven resource utilisation, as a basis of reform and learning from existing practice. Finally, and most importantly, we need data on the long-term impact of DMTs in preventing and delaying disability progression in order to assess their value to society.
Acknowledgements
G.K. had full access to all of the data in the study and final responsibility for the decision to submit for pub-lication. We are grateful for the support of MS Societies in Austria (ÖMSG), Belgium (LNMSB/ NBMSL), Czech Republic (ROSKA), Denmark (Skleroseforeningen), France (LFSEP and UNISEP), Germany (DMSG), Hungary (SMTARSASAG), Italy (AISM), Netherlands (MSVN), Poland (PTSR),
Portugal (SPEM), Russia (ARMSS), Spain (FELEM and AEDEM), Sweden (Neurförbundet), Switzerland (SMSG) and United Kingdom (MS Society). We also gratefully acknowledge the following for support in additional data collection: Fundacja NeuroPozytywni (Poland), SFSEP (France), the Moscow Multiple Sclerosis Center (Russia), the Hospital de S. João Porto (Portugal) and the Hospital Clinico San Carlos Madrid (Spain). Finally, we thank Daniela Capsa and Johan Dalén of MAPI Sweden for analytical support and Dr Heather Lang of Oxford PharmaGenesis for independent editing.
Declaration of Conflicting Interests
The author(s) declared the following potential con-flicts of interest with respect to the research, author-ship and/or publication of this article: G.K. has received consulting fees from Almirall, Bayer, Biogen, Merck Serono, Novartis, Oxford PharmaGenesis, Sanofi Genzyme and Teva. In the past 3 years, A.T. has received honoraria/support for travel for consul-tancy from Eisai, Biogen (OptumInsight), MedDay, Novartis, Teva, Remedica and Excemed. He received support for travel for consultancy from the International Progressive MS Alliance, National MS Society (USA) and the Multiple Sclerosis International Federation. He receives an honorarium from SAGE Publishers as Editor-in-Chief of Multiple Sclerosis Journal. J.B., M.G. and J.E. were at the time of the study employed by Mapi, a research company acting as consultants to pharmaceutical companies.
Funding
The author(s) disclosed receipt of the following finan-cial support for the research, authorship and/or publi-cation of this article: Financial support for this study was provided by Biogen, who had no influence on the collection, analysis and interpretation of data; on the writing of the report; or on the decision to submit the paper for publication.
References
1. Jönsson B. Cost-effectiveness of Helicobacter pylori eradication therapy in duodenal ulcer disease. Scand J
Gastroenterol Suppl 1996; 215: 90–95.
2. O’Brien B. Multiple sclerosis. London: Office of Health Economics, 1987, https://www.ohe.org/ system/files/private/publications/162%20-%20 1987_Multiple_Sclerosis_OBrien.pdf?download=1 (accessed 5 October 2016).
3. Blumhardt L and Wood C. The economics of multiple sclerosis: A cost of illness study. Br J Med Econ 1996; 10: 99–118.
4. Henriksson F and Jönsson B. The economic cost of multiple sclerosis in Sweden in 1994.
Pharmacoeconomics 1998; 13: 597–606.
5. Rieckmann P, Boyko A, Centonze D, et al. Future MS care: A consensus statement of the MS in the 21st Century Steering Group. J Neurol 2013; 260: 462–469.
6. Giovannoni G, Butzkueven H, Dhib-Jalbut S, et al. Brain health: Time matters in multiple sclerosis. Mult
Scler Relat Disord 2016; 9(Suppl. 1): S5–S48.
7. Thompson AJ. A much-needed focus on progression in multiple sclerosis. Lancet Neurol 2015; 14: 133–135.
8. Kobelt G, Berg J, Lindgren P, et al. Costs and quality of life of patients with multiple sclerosis in Europe. J
Neurol Neurosurg Psychiatry 2006; 77: 918–926.
9. Kobelt G, Lindgren P, Parkin D, et al. Costs and
quality of life in multiple sclerosis: A cross-sectional observational study in the UK. EFI research report
no. 398, 2000. Stockholm: Stockholm School of Economics, http://swopec.hhs.se/hastef/papers/ hastef0398.pdf (accessed 5 October 2016). 10. Henriksson F, Fredrikson S, Masterman T, et al.
Costs, quality of life and disease severity in multiple sclerosis: A cross-sectional study in Sweden. Eur J
Neurol 2001; 8: 27–35.
11. Kobelt G, Lindgren P, Smala A, et al. Costs and quality of life in multiple sclerosis: An observational study in Germany. Eur J Health Econ 2001; 2: 60–68.
12. Kobelt G and Kasteng F. Access to innovative
treatments in multiple sclerosis in Europe. Brussels:
The European Federation of Pharmaceutical Industry Associations (EFPIA), 2009, http://www. comparatorreports.se/Access%20to%20MS%20 treatments%20-%20October%202009.pdf (accessed 5 October 2016).
13. Edling A and Stenberg AM. General guidelines
for economic evaluations from the Pharmaceutical Benefits Board (LFNAR 2003:2). Stockholm:
Pharmaceutical Benefits Board, 2003, http://www. tlv.se/Upload/English/Guidelines-for-economic-evaluations-LFNAR-2003-2.pdf (accessed 5 October 2016).
14. National Institute for Health and Care Excellence.
Guide to the methods of technology appraisal 2013.
National institute for Health and Care Excellence, 2013, https://www.nice.org.uk/process/pmg9/ resources/guide-to-the-methods-of-technology-appraisal-2013-pdf-2007975843781 (accessed 5 October 2016).
15. Radick L and Mehr SR. The latest innovations in the drug pipeline for multiple sclerosis. Am Health Drug
Benefits 2015; 8: 448–453.
16. Hawton A, Shearer J, Goodwin E, et al. Squinting through layers of fog: Assessing the cost effectiveness of treatments for multiple sclerosis. Appl Health Econ
Health Policy 2013; 11: 331–341.
17. Thompson JP, Abdolahi A and Noyes K. Modelling the cost effectiveness of disease-modifying treatments for multiple sclerosis: Issues to consider.
Pharmacoeconomics 2013; 31: 455–469.
18. Guo S, Pelligra C, Saint-Laurent Thibault C, et al. Cost-effectiveness analyses in multiple sclerosis: A review of modelling approaches. Pharmacoeconomics 2014; 32: 559–572.
19. Kobelt G. Health economic issues in MS. Int MS J 2006; 13: 17–26, 16.
20. Lekander I, Kobelt G, Svarvar P, et al. The comparison of trial based and registry data-based cost-effectiveness of infliximab treatment for rheumatoid arthritis in Sweden using a modeling approach. Value Health 2013; 16: 251–258. 21. Flachenecker P, Buckow K, Pugliatti M, et al.
Multiple sclerosis registries in Europe – Results of a systematic survey. Mult Scler 2014; 20: 1523–1532. 22. EuroQol Group. EuroQol – A new facility for the
measurement of health-related quality of life. Health
Policy 1990; 16: 199–208.
23. Dolan P, Gudex C, Kind P, et al. A social tariff for
EuroQol: Results from a UK general population survey (discussion paper number 138). York: Centre
for Health Economics, University of York, 1995, http://www.york.ac.uk/media/che/documents/papers/ discussionpapers/CHE%20Discussion%20Paper%20 138.pdf (accessed 5 October 2016).
24. Paris V and Belloni A. Value in pharmaceutical
pricing. OECD Publishing, 2013, http://apps.who.
int/medicinedocs/documents/s21368en/s21368en.pdf (accessed 5 October 2016).
25. Theidel U and von der Schulenburg JM. Benefit assessment in Germany: Implications for price discounts. Health Econ Rev 2016; 6: 33.
26. Lublin FD, Reingold SC, Cohen JA, et al. Defining the clinical course of multiple sclerosis: The 2013 revisions. Neurology 2014; 83: 278–286.
27. Fox RJ, Bacon TE, Chamot E, et al. Prevalence of multiple sclerosis symptoms across lifespan: Data from the NARCOMS Registry. Neurodegener Dis
Manag 2015; 5: 3–10.
28. Beier M, Amtmann D and Ehde DM. Beyond depression: Predictors of self-reported cognitive function in adults living with MS. Rehabil Psychol 2015; 60: 254–262.
29. Blair M, Gill S, Gutmanis I, et al. The mediating role of processing speed in the relationship between depressive symptoms and cognitive function in
multiple sclerosis. J Clin Exp Neuropsychol 2016; 38: 782–794.
30. Akbar N, Honarmand K and Feinstein A. Self-assessment of cognition in multiple sclerosis: The role of personality and anxiety. Cogn Behav Neurol 2011; 24: 115–121.
31. Collins CD, Ivry B, Bowen JD, et al. A comparative analysis of Patient-Reported Expanded Disability Status Scale tools. Mult Scler 2016; 10: 1349–1358.
Appendix 1
The members of the MSCOI Study Group are as fol-lows: Thomas Berger, MD, Medical University Innsbruck, Austria; Benedicte Dubois, MS, University Hospital Leuven, Belgium; Eva Havrdova, MD,
Charles University Prague, Czech Republic; Peter Vestergaard Rasmussen, MD, Aarhus University Hospital, Denmark; Christine Lebrun-Frenay, MD, Hospital Pasteur Nice, France; Peter Flachendecker, MD, Rehabilitation Centrum Bad Wildbad, Germany; Samuel Komoli, MD, University of Pecs, Hungary; Mario Battaglia, MD, University of Siena, Italy; Bernard Uitdehaag, MD, VU Medical Center, Amsterdam, the Netherlands; Krzysztof Selmaj, MD, University of Lodz, Poland; Maria Jose Sà, MD, Hospital S. João Porto, Portugal; Alexej Boyko, MD, Russian State Medical Center, Moscow, Russia; Celia Oreja Guevara, MD, University Hospital San Carlos, Madrid, Spain; Lou Brundin, MD, Karolinska Institute, Stockholm, Sweden; Pasquale Calabrese, MD, University of Basel, Switzerland; David Miller, MD, University College London, UK.
Visit SAGE journals online journals.sagepub.com/ home/msj