Organic farming in Italy
BIOREPORT 2012
Published with the aid of EAFRD (European Agricultural Fund for Rural
Development) as part of the National Rural Network 2007-2013 activities -
www.reterurale.it
BIOREPOR T 2012 Organic f arming in It alyNational Rural Network 2007-2013
2012
BIORepORt 2012
ORGANIC FARMING IN ItALY
this work was carried out under the National Rural Network 2007-2013, WG integration between rural development and other policies - Manager Graziella Romito, and it was possible thanks to the collaboration between MIpAAF (DISR II, pQA V, IV DISR , ICQRF), SINAB, IAMB, ISMeA and INeA.
Coordinator: Francesca Marras (INeA).
Coordinating Committee: Carla Abitabile, Francesca Marras, Laura Viganò.
Technical-Scientific Committee: Carla Abitabile (INeA), Giovanna Carlini (MIpAAF-ICQRF, DG pReF), enrico De Ruvo (ISMeA), Francesco Giardina (SINAB-IAMB), Francesca Marras (INeA), Cristina Micheloni (AIAB), Giacomo Mocciaro (MI-pAAF-pQA V), Roberto pinton (FederBio), Serenella puliga (MIpAAF-DISR IV), Lorena timi (MIpAAF-ICQRF, DG VICO), Laura Viganò (INeA), Christian Vincentini (MIpAAF-DISR II).
INEA Editing Committee: Carla Abitabile, Francesca Giarè, Roberto Henke, Francesca Marras, Gaetana petriccione, Rober-ta Sardone, Stefano trione, Antonella trisorio, Laura Viganò, Raffaella Zucaro.
Texts by:
Chap. 1: Marta Romeo (SINAB)
Chap. 2: Simonetta De Leo and Alfonso Scardera (INeA) Chap. 3: enrico De Ruvo (ISMeA)
Chap. 4: emanuele Blasi (University of Viterbo), enrico De Ruvo (ISMeA), Davide Marino (University of Molise) Chap. 5: Andrea Arzeni (INeA)
Chap. 6: Stefano trione and Alberto Sturla (INeA) Chap. 7: Sabrina Giuca (INeA)
Chap. 8: Sabrina Giuca (INeA)
Chap. 9: Simonetta De Leo (INeA), Christian Vincentini (MIpAAF) Chap. 10: Camillo Zaccarini Bonelli (ISMeA)
Chap. 11: Manuela Scornaienghi (INeA)
Chap. 12: Carla Agricoli and Barbara Dore (MIpAAF) Chap. 13: Roberto pinton (FederBio)
Chap. 14: paolo Agostini (Società di consulenza Albert) Chap. 15: Cristina Micheloni and Livia Ortolani (AIAB) Chap. 16: Rosa Maria Bertino and Caterina Santori (AIAB) thanks to Gaetana petriccione for critical reading of texts
Processing and technical support: Marco Amato, Laura Guidarelli, Anna Lapoli Technical secretary: Isabella Brandi
Publishing coordinator: Benedetto Venuto Publishing secretary: Roberta Capretti Graphic design and layout: Sofia Mannozzi
Cover photo by Bruna Ricci, pecore di razza frobosana roaschina nel Gias della Vagliotta, m. 1595, allevate dall’azienda a condu-zione biologica en Barlet (CN)
Presentation
PART I:
Overall data on organic farming
1. the structural situation of farms 9
2. the economic situation of farms 15
3. the market 21
4. prices and value chain 27
5. Inputs 37
6. Organic livestock 43
PART II:
Policies for organic farming
7. Legislation and policies 51
8. the regional case: emilia-Romagna 61
9. Support for the organic sector 67
10. Organic farming in the CAp reform 73
11. training and services for organic farming 77
PART III:
Organisation and characteristics of the organic sector
12. Control 85
13. the organic pasta category 89
14. the use of organic products in school
meals 97
15. Organic wine 105
16. Bio-organic cosmetics and detergent 115
Appendix
Links 121
Now in its second edition, BIORepORt continues in its ef-forts to improve awareness of the Italian organic sector, in its various facets. the 2012 edition focuses on contrast-ing aspects and problems of the sector, to be dealt in the future through coherent policies at regional, national and eU levels, also because of the similarity of Italy’s situation with that of other european countries.
the Italian organic sector has in fact significant growth opportunities in terms of supply, given the increase in de-mand that has continued for more than six years. How-ever, organic surface has been substantially stationary for about ten years, while the number of organic farms, especially smaller ones, continues to shrink. According to the latest general agriculture census, average UAA on Italian organic farms is 18 hectares, compared with 7.9 of the average UAA of all farms surveyed. As noted by the FADN, this contributes to a higher average profitability for organic farms compared to conventional ones, though the former have lower production intensity than the latter. the growing domestic demand, therefore, is also satisfied by increased imports, as reported by the data related only to imports from countries not in the equivalence scheme in 2007-2011.
the consumption of fertilisers allowed in organic farming indicates that the sector can trigger sustainable processes throughout agriculture. With organic surface substantially unchanged, in fact, the continuous increase of fertiliser consumption is mainly due to their greater use by conven-tional farms, thus helping to reduce the overall negative impact on the environment by the agricultural sector. the increase of the quantity of feed distributed, however, is related to the increase in the number of organic livestock farms, though the level of farms’ self-supply remains high. As feed and seeds have a number of problems with regard to quality, availability and cost, that growth should lead to a greater focus by institutions for appropriate regulatory action.
Presentation
On the other hand, in the proposed CAp reform, the eU is keen to promote organic farming, in both the first and the second pillar, exempting farms from greening and provid-ing a specific measure of support for organic farms. pend-ing proposals becompend-ing operational, the need must be un-derlined for greater coherence between eU decisions, for example allowing Member States to decide on GMO culti-vation, the reason for the withdrawal of a number of cer-tifications of organic corn in countries where these crops are allowed, as in Spain.
Also with regard to national and regional policies greater incisiveness is called for, establishing clear objectives for the sector and trying to make good use of the limited financial resources available. examples of this abound, both among european countries, and at the national lev-el, where emilia-Romagna proved to be one of the most virtuous regions in Italy for the support given to organic farming on many fronts, making best use of all the tools and resources available to develop the sector.
to disseminate positive experiences that can be replicated in other contexts, a chapter of this year’s BIORepORt is devoted to the analysis of policies for organic farming car-ried out by a specific Italian region. With the same objec-tive, in 2013, a chapter will be devoted to the examination of a european country that stands for policies to support organic farming.
As with the last edition, more specific topics provide data and information on some branches of organic. pasta, cos-metics, detergents and wine - just regulated at the eu-ropean level - are analysed to illustrate the character-istics and peculiarities of their supply chains, and trace the profiles of production and the market, highlighting in particular the need to establish Community regulation for cosmetics and detergents, to reassure the consumer and differentiate organic products from those indicated by misleading labels and advertising.
to the complexity of organic production and its many prob-lems. However, it aims to help the potential reader - in particular operators, institutions and researchers - to find information on organic farming and hopes, at least in part, to fill the gaps of knowledge about specific issues. It also
aims to provide an overall framework, from which contra-dictions and weaknesses emerge, on which to base pos-sible measures by policy makers for the development of the sector.
PART I:
The international context
the overall distribution of organic farming in the world is fairly stable, after continuous growth in recent years. International data for comparison are those published in the last annual FiBL-IFOAM report: they refer to 2010 and do not reveal significant changes from the previous year . the total area affected is around 37 mil-lion hectares, 83% of which is concentrated in Oceania, europe and Latin America. Italy remains among the top ten countries in the world for organically cultivated area and, among these, is the one with the highest per-centage to total UAA.
Our country is also among the top ten in the world and first in europe for the number of producers, as well as certified operators in general (including processors and importers).
eurostat has recently issued figures for 2011 on the development of organic farming in european coun-tries. France has increased by about 15%, for both the number of operators and area; positive values, al-though smaller, also apply to Germany. Spain, with an increase of 12% compared to 2010, recorded an area of 1.85 million hectares, ranking top in europe, and also shows a significant increase in the number of opera-tors (+18%).
1. The structural situation of farms
Tab.1 - Top ten countries in the world for surface planted using organic methods, 2010
Organic
surface Organic surface/total UAA
ha %
World 37,041,005 0.8
Australia 12,001,724 2.9
Argentina 4,177,653 3.0
United States of America 1,948,946 0.6
Brazil 1,765,793 0.7 Spain 1,456,672 5.9 China 1,390,000 0.3 Italy 1,113,742 8.7 Germany 990,702 5.9 Uruguay 930,965 6.3 France 845,442 3.1 Source: FIBL-IFOAM 2012
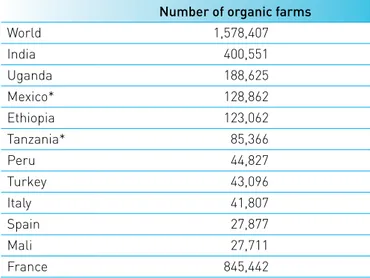
Tab. 2 - Top ten countries in the world by number of organic farms, 2010
Number of organic farms
World 1,578,407 India 400,551 Uganda 188,625 Mexico* 128,862 Ethiopia 123,062 Tanzania* 85,366 Peru 44,827 Turkey 43,096 Italy 41,807 Spain 27,877 Mali 27,711 France 845,442
* Latest figures refer to 2008. Source: FIBL-IFOAM (2012). 1 FiBL – IFOAM. The world of organic agriculture. Statistics and emerging trends 2012.
Organic farming in Italy
SINAB produces an annual report, Bio in cifre (Organic in figures), with which MipAAF issues official data on organic farming in Italy as of December 31 of the previ-ous year, collected from monitoring agencies. this data gives the number of certified operators broken down by
type, hectares of cultivated area divided by crop type, amount of livestock, aquaculture and processing activi-ties.
the figures for 2010 and 2011 show that organic has re-sponded well to negative developments in the primary sector in general, in many cases represents a valid al-ternative for farms, probably a function of a more sub-Tab. 3 - Organic operators by type and region (n.), 2010 and 2011
A B C AB TOTAL OPERATORS Exclusive producers Exclusive preparers Exclusive importers Producers / Preparers 2010 2011 2010 2011 2010 2011 2010 2011 2010 2011 Piedmont 1,369 1,323 376 396 8 3 179 231 1,946 1,977 Valle d'Aosta 67 69 12 11 0 0 2 6 81 86 Lombardy 680 700 543 642 4 4 95 126 1,353 1,506 Liguria 232 210 104 111 5 1 47 56 396 389 Trentino A. A. 966 1,009 248 294 4 4 141 145 1,364 1,459 Veneto 951 932 549 640 8 12 124 194 1,665 1,811 Friuli V.G. 262 268 94 119 1 0 30 40 390 432 Emilia R. 2,465 2,465 772 816 10 10 244 266 3,540 3,602 Tuscany 2,190 2,278 479 499 2 10 559 728 3,252 3,536 Umbria 977 942 116 145 0 2 222 223 1,321 1,318 Marche 1,783 1,758 187 228 1 0 121 133 2,097 2,127 Lazio 2,490 2,461 320 366 1 1 154 168 2,969 3,001 Abruzzo 1,275 1,263 176 200 0 3 126 143 1,580 1,612 Molise 137 177 38 36 0 1 15 16 192 232 Campania 1,350 1,475 272 288 0 0 120 128 1,751 1,896 Puglia 4,501 4,166 454 464 0 6 356 441 5,319 5,081 Basilicata 1,256 1,178 82 98 0 1 63 71 1,402 1,348 Calabria 6,234 6,471 222 214 0 1 289 425 6,749 7,115 Sicily 7,632 6,636 482 526 0 2 184 295 8,311 7,469 Sardinia 1,862 2,124 66 72 0 2 57 71 1,985 2,272 Total 38,679 37,905 5,592 6,165 44 63 3,128 3,906 47,663 48,269 Source: SINAB.
stantial farm income that has produced greater vitality in the sector.
With regard to specific dynamics, it appears that in 2010 there were 47,663 certified operators, a decrease of 1.7% compared to 2009, and 48,269 in 2011 with a re-covery of 1.3 percentage points over the previous year. the distribution of operators in Italy in the period, among regions with the largest number of organic farms, is led by Sicily, followed by Calabria, in line with previous years, while the leader in number of proces-sors was emilia-Romagna, followed by Veneto and
Lombardy.
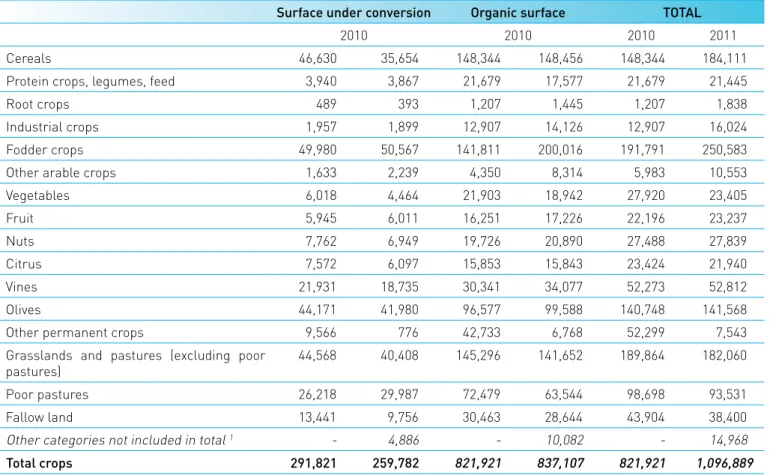
Area affected, under conversion or for which conver-sion is already complete, amounted to 1,113,742 hec-tares in 2010, basically stable over the previous year (+0.6%) and 1,096,889 hectares in 2011, a decrease of 1.5%. the main types of production are cereals, fodder, pastures and olive growing.
For livestock production, distinguished on the basis of main species raised, the data show a significant in-crease in 2011 in the number of head for pigs, sheep, goats and poultry.
Tab. 4 - Organic surface by type of crop (ha),2010 and 2011
Surface under conversion Organic surface TOTAL
2010 2010 2010 2011
Cereals 46,630 35,654 148,344 148,456 148,344 184,111
Protein crops, legumes, feed 3,940 3,867 21,679 17,577 21,679 21,445
Root crops 489 393 1,207 1,445 1,207 1,838
Industrial crops 1,957 1,899 12,907 14,126 12,907 16,024
Fodder crops 49,980 50,567 141,811 200,016 191,791 250,583
Other arable crops 1,633 2,239 4,350 8,314 5,983 10,553
Vegetables 6,018 4,464 21,903 18,942 27,920 23,405 Fruit 5,945 6,011 16,251 17,226 22,196 23,237 Nuts 7,762 6,949 19,726 20,890 27,488 27,839 Citrus 7,572 6,097 15,853 15,843 23,424 21,940 Vines 21,931 18,735 30,341 34,077 52,273 52,812 Olives 44,171 41,980 96,577 99,588 140,748 141,568
Other permanent crops 9,566 776 42,733 6,768 52,299 7,543
Grasslands and pastures (excluding poor
pastures) 44,568 40,408 145,296 141,652 189,864 182,060
Poor pastures 26,218 29,987 72,479 63,544 98,698 93,531
Fallow land 13,441 9,756 30,463 28,644 43,904 38,400
Other categories not included in total 1 - 4,886 - 10,082 - 14,968
Total crops 291,821 259,782 821,921 837,107 821,921 1,096,889
1 Forest surface and volunteer harvest surface (wild mushrooms, truffles, wild berries); other. Source: SINAB.
Data on the number of certified organic farms oper-ating with livestock, exclusively or in conjunction with crops or processing are derived from the SIAN data-base, on the basis of lists submitted by authorised inspection bodies. they number 7,355 farms in 2010, with an overall increase of 13.1% compared to 2009 and 6,884 farms in 2011 with a decline of 6.4% over the pre-vious year.
Ultimately, the data from the last two years show sub-stantial stability in the diffusion of organic farming in Italy.
With regard to type of operators, there was a drop in the number of producers, offset however by a signifi-cant increase in producers who also process (produc-ers/preparers), signalling an attempt by agricultural enterprises to secure greater value for organic prod-ucts. this element is indicative of the specificity of
Tab. 5 - Head of livestock raised using organic methods by type of animal (n.)
Type of livestock Head 2011/2010% Change
2007 2008 2009 2010 2011 Cattle 244.156 216.476 185.513 207.015 193.675 -6 Pigs 26.898 34.014 25.961 29.411 32.436 10 Sheep 859.980 1.007.605 658.709 676.510 705.785 4 Goats 93.876 83.411 74.500 71.363 72.344 1 Poultry 1.339.415 2.157.201 2.399.885 2.518.830 2.813.852 12 Horses 8.325 9.903 8.597 9.563 9.548 0
Bees (number of hives) 112.812 102.280 103.216 113.932 99.260 -13
Other animals 1.926 2.501 2.948 2.089 1.751 -16
Source: SINAB.
Tab. 6 - Trend in number of organic producers in Italy (n.)
2007 2008 2009 2010 2011
Organic producers 45,390 44,563 43,236 41,825 41,816
of which exclusive producers 43,159 42,037 40,462 38,679 37,905
of which producers/preparers 2,065 2,324 2,564 3,128 3,096
Source: SINAB.
multi-functionality for the organic sector and also the action that consumers are making in choosing and, as much as possible, shortening the supply chain.
Imports
Analysis of the data processed by SINAB on imports of organic products from Non-eU countries shows a sharp increase for the years 2010-2011 in the total amount of imported product, by about 49% between 2009 and 2010 and 61% from 2010 to 2011.
the comparison between 2010 and 2009 shows an in-crease in import volume for cereals of more than 19,800 tons, in particular from non-eU european countries (sig-nificant imports of corn and barley come from Moldova). Volumes of rice purchased from Asian countries were
halved; on the other hand there was an increase for both durum and soft wheat from Kazakhstan. there were also increased imports from North America, particularly of Canadian wheat. In 2011, the imported volume of corn has more than doubled and comes almost entirely from non-eU european countries.
For industrial crops, there was a strong rise in imported volume of sunflowers and soybeans, a substantial sta-bility for flax and a sharp drop for rape, which continued the decline that began in 2009. Soybeans, sunflowers and rapeseed, used mostly in animal feed, come from non-eU european countries, particularly from Moldova. Tab. 7 - Imports of organic products by category (t)
2007 2008 2009 2010 2011
Cereals 21,831.55 44,378.04 23,269.28 43,142.19 50,697.16
Industrial crops 3,265.20 8,811.54 426.4 9,437.13 45,832.20
Fresh and dried fruit and nuts 8,339.55 8,813.97 7,245.16 3,479.38 5,558.62
Natural extracts, aromatics and condiments 135.32 240.53 139.11 701.42 1,041.66 Vegetables 10,083.04 9,435.70 8,165.34 7,639.65 5,303.58 Processed 16,299.39 18,179.34 10,264.26 9,502.90 10,558.36 Aquaculture - - - - 2.07 Total 59,954.05 89,859.12 49,509.55 73,902.67 118,993.65 Source: SINAB.
Graph. 1 - Trend in number of operators and organic surface in Italy (n.; '000 ha)
Source: SINAB. 0 200 400 600 800 1,000 1,200 1,400 0 1990 1991 1992 1993 1994 1995 1996 1997 1998 1999 2000 2001 2002 2003 2004 2005 2006 2007 2008 2009 2010 2011 10,000 20,000 30,000 40,000 50,000 60,000 70,000
Graph. 2 - Volumes of organic product imported to Italy by geographical area of origin (tonnes)
Source: SINAB.
Natural extracts, aromatics and condiments were up for all geographical areas of origin.
Vegetables in 2010 remained slightly lower than in 2009 (there were increases for peas from Moldova), and con-tinued to decline in 2011.
In the two-year period, processed products showed con-stant growth rates; note that movements of olive oil are not recorded, probably because of entry into the system of equivalence of third-country producers.
In conclusion, the geographical origin of organic prod-ucts imported from third countries not in the equivalency scheme translates into a prevalence of vegetables from Africa, processed products from South America, cereals from non-eU european countries and North America, fresh and dried fruit and nuts from non-eU europe and South America, and industrial crops from non-eU eu-rope. 2007 2008 2009 2010 2011 Africa Central America North America South America Asia Non-EU Europe 0 5,000 10,000 15,000 20,000 25,000 30,000 35,000 40,000 45,000 50,000 55,000 60,000 65,000 70,000 75,000 80,000 85,000 90,000 95,000 100,00 0
2. The economic situation of farms
the Italian FADN 2010 surveyed a total sample of 10,973 farms, including 749 farms in the national registry of organic farms. Most of these (78%) are located in the Central and South of the peninsula, and are devoted mainly to specialised permanent crops or non-special-ised production (mixed crops and livestock), particularly
common among organic farms because they conform to organic regulations regarding rotations, organic fertili-sation and the presence of improvement crops.
the Farm Accountancy Data Network (FADN ) is a Com-munity tool designed to monitor the economic situation of farms in europe. In Italy, the FADN provides annual Tab. 1 - Structural comparison of organic and conventional FADN farms, 2010
Organic Conventional
average farm figures
UAA ha 54.8 34.9
LSU n. 21.1 18.0
AWU n. 2.3 1.7
Land capital euro 624,720 420,298
structural indicators
UAA/TWU ha 23.9 20.4
LSU/TWU n. 9.2 10.5
LSU/UAA n. 0.4 0.5
Land capital/UAA euro 11,404 12,037
Source: INEA, FADN data bank (2012)
What is FADN?
the Farm Accountancy Data Network (FADN1) is a Community tool designed to monitor the economic situation of farms in
europe. In Italy, the FADN provides annual economic data of a representative sample of commercial farms, ie farms whose
production is market-oriented, with economic size greater than 4,000 euro standard gross margin2. the presence of organic
production units in FADN allows assessment of their economic profile, also with reference to conventional farms.
1 Detailed information on FADN available at www.rica.it. 2 European Size Units (ESU: 1 ESU equals 1,200 euro).
economic data of a representative sample of commercial farms, ie farms whose production is market-oriented, with economic size greater than 4,000 euro standard gross margin . the presence of organic production units in FADN allows assessment of their economic profile, also with reference to conventional farms.
In order to evaluate their structural profile and econom-ic performance, the FADN sample of organeconom-ic farms was
compared with a sample of 5,906 conventional farms se-lected by FADN similar to the former based on size, farm type and geographical location.
the average agricultural area of organic farms in the FADN sample is higher than that of their convention-al counterparts by about 20 hectares (55 hectares as against 35 for conventional farms). Organic farms un-der consiun-deration also have higher average number of Tab. 2 – Economic results of organic and conventional farms FADN (euro, 2010)
Organic % of Turnover Conventional % of Turnover
TO 125,143 99,703
of which connected activities 5,251 4 1,679 2
Current costs 36,856 29 37,708 38
Value added 88,288 71 61,994 62
Long-term costs 11,527 9 8,705 9
Labour and passive rents 24,364 19 15,595 16
Operating income 52,396 42 37,695 38
Net family income 60,910 49 41,066 41
Source: INEA, FADN data bank (2012)
Graph. 1 – Economic results by main production type, 2010
Source: INEA, FADN data bank (2012) 0 10.000 20.000 30.000 40.000 50.000 60.000 70.000 Arable crop s Permanent crops Herbivore s Mixed euro Org Conv
Net family income
Arable crop s Permanent crops Herbivore s Mixed % Org Conv Current costs/turnover 0 5 10 15 20 25 30 35 40 45 50
livestock units (21 LSU per farm, as against 18 on con-ventional farms), which plays an important role in re-storing the fertility of soils, as well as being a source of income. the larger physical size is also accompanied by an increased use of labour, registering an average of 2.3 annual work units, compared to 1.7 annual work units on conventional farms. Furthermore, in relation to the greater physical size of organic farms, there is an
av-erage land asset of about 625,000 euro compared to a value of 420,000 euro for conventional farms.
Another feature of organic farms in the sample is that they have lower production intensity than conventional farms, as evidenced by the greater availability of utilised agricultural area per unit of labour (23.9 hectares versus 10.4 hectares on conventional farms), and lower live-stock density in relation to livelive-stock units per work unit (9.2 LSU for organic compared to 10.5 for conventional). the lower value of land assets per hectare of agricul-tural land (11,404 euro for organic and 12,037 euro for conventional) is generally correlated with more exten-sive farming methods.
An examination of the economic performance of FADN organic farms revealed that the organic method may
represent a viable alternative to the conventional sys-tem. First, the total output is on average 125,143 euro, higher than the 99,703 euro recorded for conventional farms. It is also interesting to note that organic farm rev-enues from related activities (farm stays, subcontract-ing, rental income, etc.) contribute to 4% of tO, twice the value of the corresponding index for conventional farms, signalling greater propensity of the former to
differenti-ate their activity.
the value added of organic farms in FADN represents more than 70% of tO, compared with 62% for convention-al farms. the better result of organic farms is achieved thanks to containment of current costs (inputs, servic-es provided by third partiservic-es and other direct costs), the main item of farm expense. On organic farms, current costs make up less than 30% of tO (38% on conventional farms), indicating adoption of less intensive production processes, which use fewer means of production off the farm. On the contrary, organic farms record higher la-bour costs, determined by the greater lala-bour intensity required by production techniques, and for passive rents. Also in terms of profitability, organic farms produce bet-ter results than the conventional farms surveyed. Net in-Tab. 3 - Productivity and profitability of land and labour (euro), 2010
Organic Conventional % Change
TO / UAA 2,284 2,856 -25.0
TO / AWU 54,622 58,125 -6.4
Current costs / UAA 673 1,080 -60.5
Long-term costs / UAA 210 249 -18.5
Net family income / UAA 1,112 1,176 -5.8
Net family income / AWU 26,586 23,941 9.9
Net family income / TO 49 41 15.4
Source: INEA, FADN data bank.
come, meaning the remuneration of all factors brought to bear by the entrepreneur, is nearly 61,000 euro per farm, constituting almost half of the tO (49%), far higher than the approximately 41,000 euro obtained on conven-tional farms, representing only 41% of the tO. However, one should consider that income also includes Com-munity subsidies and, in particular, specific aid for the organic sector disbursed through the agri-environment measure. this aid affects the income of beneficiary farms by 15% compared to 11% for conventional farms. the results are, however, linked to production systems, and thus vary according to crops and livestock. In gen-eral, the comparison by production type between the two methods shows that organic farms get the best results. More specifically, the analysis by production type shows that organic farms produce the best performance for ar-able crops and the worst results, in terms of average net income, for organic livestock (herbivores) compared to conventionally raised livestock, a sign that the contain-ment of production costs is not sufficient to make the organic production method competitive in this category. the extensive nature of organic production technique is made clear from the analysis of indices of productiv-ity and profitabilproductiv-ity of land: both the value of production and income per unit area are significantly lower than the values of the same indices calculated for conventional farms. Lower values were also recorded for the produc-tivity of labour, but the profit performance per unit of la-bour remains favourable for organic farms.
Public support for FADN organic farms
public support plays an important role in farms’ eco-nomic results, representing a significant source of in-come for farmers, as is also shown by the information available from FADN. Reading the data, it is clear that the majority of farms in the two subsamples considered (organic and conventional) receive an entitlement from the Common Agricultural policy (CAp) which accounts on average for 45% of net income on organic farms and 40% on conventional ones. However, the share of aid
shows variability in relation to production types prac-ticed. thus, in both production systems, the share of CAp subsidies to net income is higher on farms growing arable crops (59% on organic and 65% on conventional farms), the largest eU support received by this produc-tion sector.
the observation of the data on the breakdown of subsi-dies shows that the support for CAp markets (pillar 1) for both production systems constitutes the bulk of total support, although it has a lower impact on organic farms (65% as opposed to 81% of the total amount of aid to con-ventional farms). the greater share of pillar 2 on organic farms compared to conventional is attributable to spe-cific support for the organic sector, and to the increasing trend of organic farms to diversify their activities, which gives them access to a wider range of rural development Graph. 2 – Farms that receive Community aid by type of subsidy received (%), 2010
Source: INEA, FADN data bank (2012).
CAP Subsidies
CAP Subsidies Pillar 1
CAP Subsidies Pillar 2 Agri-environmental sub sidies Organic Conventional 0 10 20 30 40 50 60 70 80 90 100
measures compared to conventional farms.
the percentage of farms that receive entitlements un-der pillar 1 is higher among organic farms (96% ver-sus 84% for conventional), though this contribution is a higher share of income on conventional farms (34% against 30.5% for organic). With regard to pillar 2, the number of farms that access payments for rural devel-opment is very prevalent in the organic subsample (62% versus 28% for conventional), a situation caused mainly by increased access to the agri-environment measure. Although this aid is an important support opportunity for farmers’ income, only 54% of organic farms consid-ered receive it. this is due both to the lack of financial resources available, which limits the number of appli-cations approved, and the daunting bureaucratic com-plexity for access to the support. the level of payments, moreover, is not always considered to be sufficiently attractive. this contribution, in fact, is not an adequate incentive for all farmers considering the greater effort required by the organic production method.
Graph. 3 - Share of Community subsidies to net farm income (%), 2010
Source: INEA, FADN data bank (2012).
CAP/NI Pillar 1/N I Pillar 2/NI Agri-environmental/NI Organic Conventional 0 5 10 15 20 25 30 35 40 45 50
Graph 4 - Breakdown of CAP subsidies between Pillar 1 and Pillar 2, 2010
Source: INEA, FADN data bank (2012).
0% 20% 40% 60% 80% 100% Arable crops Permanent crops Herbivores Mixed Italy
CAP Subsidies Pillar 1 CAP Subsidies Pillar 2
Organic farms Arable crops Permanent crops Herbivores Mixed Italy
CAP Subsidies Pillar 1 CAP Subsidies Pillar 2 Conventional farms
3. The market
In 2010, organic farming worldwide generated a turno-ver of 59.1 billion dollars (44.5 billion euro), an increase of 7.7% over 2009. 49% of this value occurs in North America, where the market continues to expand, with another 47% in europe, where there is a slowdown in growth. the remaining 4% on the other continents is gradually developing on domestic markets.
the United States shows the greatest share of organic turnover (45%), followed at a large distance by Germany and France. Our country, despite being more distanced with a share of 3%, has a more favourable trend in the organic market than countries such as Germany, the UK, the USA and Switzerland.
Graph. 1 - Major countries' share of the world organic market, 2010
(estimated total value 2010: 59.1 billion dollars)
Source: FIBL-IFOAM Report 2012.
Graph. 2 - Organic sales in the world (million euro), 2010
* for 2009.
Source: FIBL-IFOAM Report 2012. Usa 45% Germany 14% France 8% United Kingdom 4% Canada 4% Italy 3% Switzerland 3% Other Countries 19% 20,155 6,020 3,385 2,000 1,904 1,550 1,180 1,000 986 905 USA Germany France United Kingdom Canada Italy Switzerland Japan* Austria Spain
In europe, sales of organic products amounted to about 19.6 billion euro in 2010, an increase of around 8% over the previous year: this continent has seven of the top ten countries in the world for market value. Moreover, the high number of brands makes europe’s organic market one of the most competitive in the world. While Germany, France, the UK and Italy, respectively, recorded much of the turnover, the highest european organic consumers are the Scandinavian countries, Austria and Switzerland. Italy, with a modest per capita spending of 25 euro, is not in the top of world and european rankings, where Swit-zerland and Denmark excel. Note that, in the latter coun-try, the share of organic to total food sales reached 7%.
The market for organic products in
large-scale retail in Italy
the analysis of the sales of organic products in large-scale retail (GDO) for 2011 once again shows growth in purchases of packaged organic foods. therefore, the six-year period of good performance for the organic sec-tor continues.
According to data from the ISMeA/GFK-eurisko panel on families, in 2011 domestic purchases of packaged organic products in this channel grew 8.9%1 in
mone-tary terms, a significant increase in the course of a year marked by a worsening of the economic crisis.
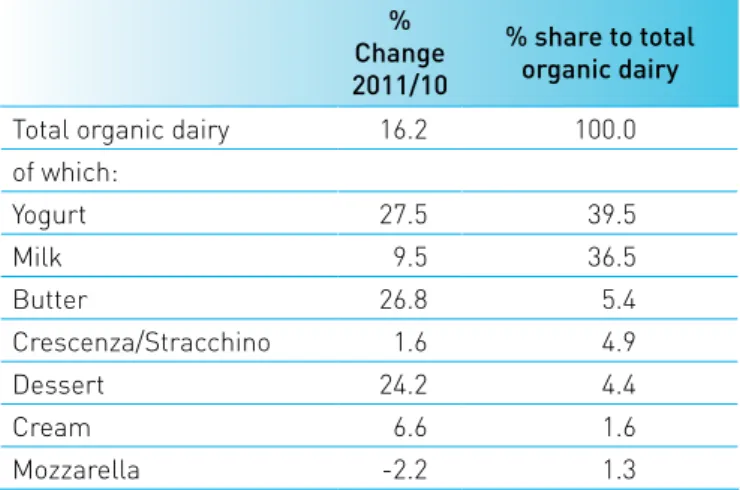
there has been strong growth, in particular, for dairy products (+16.2%, particularly yogurt and butter), eggs (+21.4%) and biscuits, sweets, snacks and soft drinks (+16%). Much smaller increases were shown for fresh and processed fruit and vegetables (+3.4%), which re-mains the largest category of consumption; among the vast number of products in this category, purchases of jams and marmalades increased by 8.6% between 2010 Graph. 3 - Trend in organic turnover for some countries
(% change from previous year)
Source: “The European Market for Organic Food” presentation by Helga Willer, FIBL at Biofach 2012, Nuremberg.
Graph. 4 - Top ten countries in the world for per capita organic spending (euro/year), 2010
Source: FIBL-IFOAM Report 2012. -15 -10 -5 0 5 10 15 20 25 Austria Belgiu m
Denmark Finland France Germany
Italy Netherlands Sweden Switzerland United Kingdom USA 2009 2010 153 142 127 118 100 86 74 65 52 52 Switzerland Denmark Luxembourg Austria Liechtenstein Sweden Germany USA France Canada
Graph. 5 - Trend in organic turnover on domestic markets in some European countries (million euro)
Source: “The European Market for Organic Food” presentation by Helga Willer, FIBL at Biofach 2012, Nuremberg.
0 1,000 2,000 3,000 4,000 5,000 6,000 7,000 2004 2005 2006 2007 2008 2009 2010
Germany France United Kingdom Italy Denmark
1 Note that figures are available for only 87-90% of the total value of packaged organic products and do not include honey, homogenized products, industrial bread and other products.
and 2011, while at the same time fruit juices showed a decrease of 11.4%. Finally, among fresh produce, lettuce exhibited a significant increase (+31.7%).
However, the category that includes pasta was down
(consistent with what occurred in the conventional sec-tor), along with brown rice and bread substitutes, with large declines for the first two and substantial stability for the latter product.
Declining significantly, but with a low share of the to-tal, are meat and prepared meats, oils and ready-to-eat pasta dishes, while sugar, coffee and tea dropped much less (-3.4%).
Analysis of expenditure on packaged organic products by geographic area shows domestic consumption con-tinues to be concentrated mainly in the northern regions of the country, similar to what was recorded in the past. Consumption showed an increase (in value) in all areas, with a particular increase in purchases in the North-West (+12.5%) and South (+19%). Although the South’s overall share of Italy’s total increased slightly in 2011, the imbalance between production sites and places of consumption remains, a typical feature of Italian organic. Most of the consumption of organic products is con-centrated in a few categories: the first four (fresh and
processed fruit and vegetables, dairy, eggs, pasta, rice and bread substitutes) cover more than three-quar-ters of the total. Strong concentration of purchases on a limited number of products, as well as of a few cat-Tab. 1 - Value of household purchases of packaged
organic products, 2011*
Organic category % Share to total 2011 2011/2010% Change
Fresh and processed fruit
and vegetables 30,3 3,4
of which:
Jams and marmalades 8.2 8.6
Fruit juices 2.7 -11.4
Lettuce 1.9 31.7
Milk and dairy 23.2 16.2
of which:
Yogurt 9.2 27.5
Milk and dairy 8.5 9.5
Butter 1.3 26.8
Eggs 13.6 21.4
Pasta, rice and bread substitutes 8.1 -3.2
of which:
Bread substitutes 5.2 0.3
Pasta 2.4 -11.4
Whole-grain rice 0.3 -34.7
Biscuits, sweets and snacks 7.9 16.1
Sugar, coffee and tea 5.9 -3.4
Soft drinks 3.8 16.0
Meats and prepared meats 2.1 -8.2
Oils 1.7 -18.6
Ready-to-eat first courses 0.5 -28.9
Other organic products 2.8 73.3
Total packaged organic products* 100.0 8.9
* Figures cover approximately 87-90% of total value of packaged organic products.
Source: ISMEA, GFK-Eurisko Panel on Families.
Tab. 2 – Value of household purchases of organic products by geographical area, 2011
% Share to
Italy's total 2011 % Change 2011/10
Total Italy 100.0 8.9 of which: North-West 38.5 12.5 North-east 32.9 2.4 Centre1 20.7 9.8 South2 7.9 19.2 1 Includes Sardinia. 2 Includes Sicily.
egories, continues: the top twenty products cover about 72% of the total household expenditure for packaged organic products and the top ten account for 57%. the most-consumed organic food in terms of expenditure is still eggs (+21.4%). Yogurt follows, with a share to total of more than 9% and an increase in purchase value of 27.5%. Milk, third in the ranking, makes up 8.5% of total organic sales, with an increase in consumption of 9.5%. In terms of products, there are not remarkable differenc-es in consumption among different parts of the country, except for soy beverages and extra-virgin olive oil, which are purchased more in the Northwest; instant powdered drinks, most appreciated in the Centre; breakfast cere-als, lettuce and broth cubes, mostly consumed in the North-east.
Other channels
ISMeA monitors data on domestic consumption in non-specialised channels, basically large-scale retail (GDO). In other channels, including the very important speci-ality stores, there are no statistics on sales trends, but some information is available from Bio Bank figures. According to Bio Bank, there were 1,212 specialised shops in Italy in 2011 (+4.2% compared to 2010). 65.3% of these shops are concentrated in the North, 22.3% in the Centre (including Sardinia) and 12.4% in the South (including Sicily).
Information from some of the largest distribution com-panies that exclusively supply the specialised channel indicates, for the same year, an increase of turnover Tab. 3 - Top ten organic products by purchase value,
2011
Organic products % Share to total % Change 11/10
Eggs 13.6 21.4
Yogurt 9.2 27.5
Milk 8.5 9.5
Jams and marmalades 8.2 8.6
Bread substitutes 5.2 0.3 Biscuits 3.1 13.0 Fruit juices 2.7 -11.4 Pasta 2.4 -11.4 Soy beverages 2.1 27.7 Instant beverages 2.0 -5.8
Total packaged organic
products* 100.0 8.9
* Figures cover approximately 87-90% of total value of packaged organic products purchased for household consumption. Source: ISMEA. GFK-Eurisko Panel on Families.
Graph. 6 - Progress in number of sales points in some organic channels (indexed figures, 2005=100)
Source: Processing of Biobank figures. 100 150 200 250 300 350 2005 2006 2007 2008 2009 2010 2011 Organic farms with direct sales
within the sector of between 10% and 20%.
Besides the important channel of specialist shops, many alternative forms of sales are on the rise. they still have a limited share of the market, but attract growing inter-est on the part of the consumer. these include direct sales, group purchasing organisations (GpO) and organic markets. For these types of sales we have only Biobank figures, which monitor the number of outlets. they show a steady increase, with annual growth rates higher for GpOs and direct sales than for farmers’ markets, which in 2011 also showed a slight decline in number.
Channels outside the home (organic school canteens, restaurants, farm stay sites) have also recorded strong increases in the number of units in recent years, partic-ularly in the case of farm stay sites and canteens, which grew by 28% in 2011.
Graph. 7 - Progress in number of sales points in some organic channels outside the home (indexed figures, 2005=100)
Source: processing of Bio Bank figures.
100,0 110,0 120,0 130,0 140,0 150,0 160,0 170,0 2005 2006 2007 2008 2009 2010 2011
4. Prices and value chain
Introduction
ISMeA market figures for organic products, though limited to large-scale retail, indicate that the wealth generated by this segment is also growing in Italy. this trend is even more significant when one considers that consumption in large-scale distribution is concentrated within a limited number of products and in a situation of rising prices for organic and a widening price gap with conventional agricul-ture products.
the prices of organic products have always intrigued both economists and operators in the sector. In addition to be-ing subject to the usual factors that influence market prices of consumer goods, the prices of organic products are af-fected by a peculiar structure at both primary production and market levels - reflected in a particular price dynamic. A summary indicator of these specific conditions is the so-called premium price, which is the positive differential in price between an organic product and its conventional counterpart. More generally, price levels of organic prod-ucts seem to be influenced by several factors relating to market structure, on both the supply and demand sides. From the point of view of supply, the factors that contribute to the premium price are threefold:
1. higher production costs, due to lower yields, the adop-tion of more expensive producadop-tion techniques and costs of certification;
2. a national production structure that, in the face of a sharp increase in the number of producers and sur-faces, does not show a similar proportional rise in the share of production actually marketed as organic; 3. processing and distribution characterised by “artisanal”
methods and a lack of logistics platforms to encourage economies of scale.
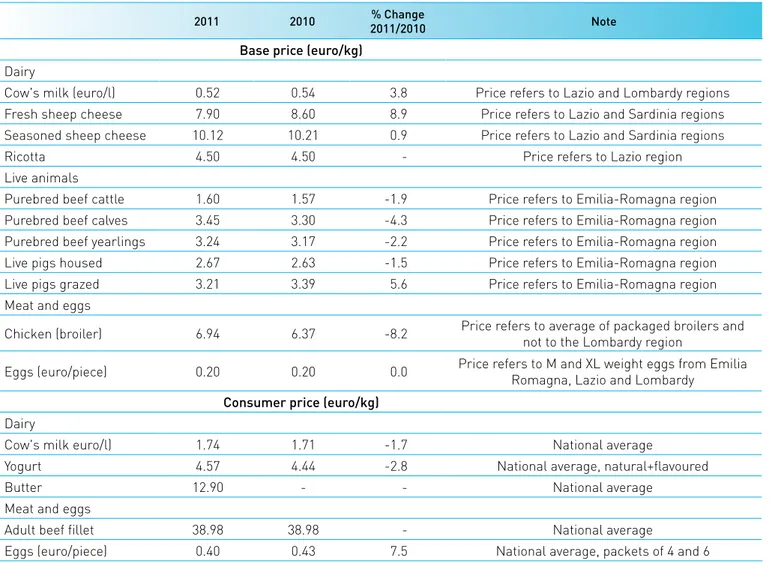
According to the ISMeA figures, of a group of products
rep-resentative of the different organic supply chains1, the
con-sumer prices of organic products were down 1% in 2010 compared with a decline of 4.3% for non-organic.
In the case of organic products, the reduction in consumer prices, although welcomed in view of expansion of con-sumption, is much less than the drop in producer prices, amounting to about 4% compared to 2009. the trend is different for conventional products, for which production prices have increased by 4%.
the different behaviour of prices of organic products com-pared with conventional ones can be ascribed to a different elasticity of demand. Demand for conventional products, in a phase of financial difficulty and a scenario of sustained prices in previous years, would lead to a more elastic de-mand, with a relative decrease in prices. Not so for organic products. In this case, the reduction in producer prices is not reflected in consumer behaviour: we can therefore as-sume that rigidity of demand and asymmetrical informa-tion are the main reasons for this behaviour.
The prices of the most-consumed fresh bulk and
packaged organic produce in Italy
Comparing the average prices of products consumed in Ita-ly for the first half of 2009 and 2011, consumer prices for or-ganic products examined rose by 11% as against a decline of 5% recorded for prices of similar non-organic products. the average value of the differentials comes from changes in prices of individual products in widely different catego-ries, but in general we can say that these variations depend on the availability of the products and the evolution of prices of conventional products.
First of all, packaged organic products show very differ-ent trends than fresh ones in bulk. Figures from the ISMeA panel on families showed aggregated mean trends for
or-1 Eggs, fresh milk, yogurt, honey, tomatoes, bread, pasta, rice and extra-virgin olive oil. Prices used for analysis are calculated as the average by share of consumer prices within the product group.
Graph. 1 - Consumer price trend for Org and Non-Org packaged products (2009=100) Source: ISMEA. 70 80 90 100 110 120 130 140 150 January Februar y March April Ma y June July August Septembe r O ctobe r N ovembe r Decembe r January Februar y March April Ma y June July August Septembe r O ctobe r N ovembe r Decembe r January Februar y March April 2009 2010 2011
Org Trend packaged Non-Org Trend packaged Linear (Org Trend packaged) Linear (Non-Org Trend packaged)
Tab.1 - Average prices for some organic and conventional products (euro)
Organic Non-organic changeabs. changeabs. Δ % Δ %
1st half 2009 1st half 2011 1st half 2009 1st half 2011 org non-org org non-org
Eggs 0.34 0.33 0.18 0.18 -0.004 -0.002 -1.1 -1.0
Milk 1.62 1.53 1.34 1.29 -0.089 -0.046 -5.5 -3.4
Bread 3.16 5.74 2.73 2.75 2.576 0.021 81.5 0.8
Extra-virgin olive oil 7.94 7.46 4.42 3.79 -0.483 -0.631 -6.1 -14.3
Tomatoes 2.06 2.11 1.95 2.02 0.045 0.073 2.2 3.8
Courgettes 2.00 1.97 1.86 1.75 -0.024 -0.104 -1.2 -5.6
Apples 1.33 1.35 1.28 1.29 0.018 0.018 1.3 1.4
Total 2.64 2.93 1.96 1.87 0.291 -0.096 11.1 -4.9
ganic and non-organic prices from 2009 to early 2011 for the top four packaged products (eggs, bread, milk, olive oil), and last three fresh products (tomatoes, courgettes, ap-ples).
trends in the prices of organic products show profound dif-ferences in the breakdown of the premium price in the two categories analysed, highlighting fluctuations and cycles of considerable importance, especially for fresh produce in bulk. the price differential between organic and non-organic tends to increase in both cases; in particular, in the former, it is attributable to a contained rise in organic prices and a simultaneous decrease in the price of non-organic, while in the latter, there was a favourable trend in prices for organic products.
to provide additional information useful for understand-ing the phenomenon of the increase in premium price, the price trends for packaged products and bulk fresh ones were observed individually. packaged products showed dif-ferent trends for the four products examined. eggs show a
stable trend, both for organic and non-organic, and similar oscillations with larger deviations for the prices of conven-tional compared to organic. Recent surveys show a coun-ter-trend which will be monitored in the future.
For bread, the situation is substantially different. An up-ward trend, strongly subjected to variations in the price of organic, corresponds to a stable, linear price for conven-tional and, consequently, a marked widening trend of the premium price.
the trend in consumer prices of fresh milk shows a still dif-ferent situation, with both prices falling and cyclical, more marked for organic, wiping out the benefit and, according to the latest surveys, causing a worrying inverse trend for producers of organic milk.
Also for extra-virgin olive oil, conventional product prices have fallen further. In this case, the decline in the case of non-organic, due particularly to the phenomena of com-petitiveness in the foreign market, is offset by a stable trend in organic price in the medium term, though with Graph. 2 - Consumer price trend for Org and Non-Org bulk products (2009=100)
Source: ISMEA. 70 80 90 100 110 120 130 140 150 160 170 180 2009 2010 2011
Org Trend bulk Non-Org Trend bulk Linear (Org Trend bulk) Linear (Non-Org Trend bulk)
January February Marc
h
April May June July
August
September
October
November December January February
Marc
h
April May June July
August
September
October
November December January February
Marc
h
Graph. 3 - Consumer price trend Org and Non-Org Eggs (2009=100)
Source: ISMEA.
Graph. 4 - Price trend for Org and Non-Org Bread (2009=100)
Source: ISMEA. 80 85 90 95 100 105 110 2009 2010 2011
Org eggs Non-Org eggs Linear (Org eggs) Linear (Non-Org eggs)
January February March
Apri
l
May June July
August Septembe r O ctober Novembe r D
ecember January February March
Apri
l
May June July
August Septembe r O ctober Novembe r D
ecember January February March
Apri l 0 50 100 150 200 250 2009 2010 2011
Org bread Non-Org bread Linear (Org bread) Linear (Non-Org bread)
January February March
Apri
l
May June July
August Septembe r O ctober Novembe r D
ecember January February March
Apri
l
May June July
August Septembe r O ctober Novembe r D
ecember January February March
Apri
Graph. 5 - Consumer price trend for Org and Non-Org fresh Milk (2009=100) Source: ISMEA. 80 85 90 95 100 105 110 2009 2010 2011
Org fresh milk Non-Org fresh milk Linear (Org fresh milk) Linear (Non-Org fresh milk)
January February March
Apri
l
May June July
August Septembe r O ctober Novembe r D
ecember January February March
Apri
l
May June July
August Septembe r O ctober Novembe r D
ecember January February March
Apri
l
Graph. 6 - Consumer price trend for Org and Non-Org Extra-virgin Olive Oil (2009=100)
Source: ISMEA. 60 80 100 120 140 160 180 2009 2010 2011
Org olive oil Non-Org olive oil Linear (Org olive oil) Linear (Non-Org olive oil)
January February March
Apri
l
May June July
August Septembe r October Novembe r D
ecember January February March
Apri
l
May June July
August Septembe r October Novembe r D
ecember January February March
Apri
wide annual fluctuations.
Also with regard to bulk fresh products, it is interesting to study the various trends and cycles that distinguish the three types considered here.
the prices of fresh organic and conventional tomatoes show cyclic variations, illustrating how prices react in a totally different way during periods of high production. In those periods, fresh organic tomatoes are positively affect-ed by the seasonality of production, and show a consider-able increase in the premium price, probably relying on the consumer’s image of a fresh product grown in the natural cycle.
Compared with tomatoes, organic courgettes do not tend to differ from conventional ones during periods of increased market presence, but always have a high premium price with a tendency to a progressive widening of the gap. In the case of apples, prices are highly correlated with each other, presenting a relatively limited variability and a slightly higher increase in the price of organic than non-organic. these data suggest that the shelf life of products is a key factor in equalising price trends of organic and non-organic over time.
the differentiations of trends in consumer prices of the products examined seem to confirm some of the charac-teristics of the prices of organic products. these, in spite of the gradual expansion of consumption, seem character-ised by cyclical demand, uncertainty, the tendency to main-tain or expand the premium price, and growth in absolute terms.
the behaviour of the products considered here is also very different in relation to a number of variables (merchandise
characteristics, degree of penetration in stores, the behav-iour of similar conventional products, etc.). For example, for milk, the downward trend may be due to competition from several new types of products that are perceived by consumers as a speciality. Similar behaviour is observed for fresh apples, where perhaps information on the safety of the product and its production methods purveyed by ma-jor industry leaders has effectively standardized consumer perception of a product considered healthy by its "nature". An opposite trend can be observed for bread, in which the latest organic product is still enjoying the effect of intro-duction as a new speciality. the same is true, albeit with a lower level of benefit, for olive oil, while eggs, now a well-established presence, have a constant low premium price. Among fresh products, organic tomatoes also behave as a specialty, in periods of greater market presence and low prices, while the premium price for courgettes is high.
The value chain
the final price of organic products is also due to the pecu-liar structure of the market for them, and these differences can be highlighted through the distribution of prices along the supply chain. the so-called "value chain" of organic products is in fact significantly different from that of con-ventional products.
the ISMeA survey system can record the prices of some products in three different phases of trade - production, wholesale and consumption - facilitating the analysis of the phenomenon of distribution of value between produc-ers, processors and sellers2.
2 The ratio of prices at different stages of exchange is then calculated based on the prices in the phases of production, wholesale and consumption of the organic sector:
1. The supply prices are the producer prices, ie prices in the first phase of the exchange between the farmer and commercial intermediary. These prices, not including VAT, are recognised directly by ISMEA’s survey Network of producer prices of agricultural products;;
2. Wholesale prices are the prices in the commercial intermediary phase, between commercial intermediaries and retailers. Prices of organic fruit and vegetables, not including VAT, are acquired from the Chamber of Commerce of Bologna;
3. Consumer prices are retail prices paid by consumers for the purchase of agri-food goods in the last phase of trade. These prices include VAT and are collected through a special survey among the major chains of large-scale retail.
For the correct interpretation of the analysis, it should be noted that the share of the producer price and the wholesale price only indicate how much of the retail price can be attributed to the individual phases of the supply chain, measurements that otherwise do not assess the degree of profitability of the various stages of the supply chain, and can only be obtained after taking into account all fixed and variable costs to be borne in each phase.
Graph. 7 - Consumer price trend for Org and Non-Org Tomatoes (2009=100) Source: ISMEA. 60 70 80 90 100 110 120 130 2009 2010 2011
Org tomatoes Non-Org tomatoes Linear (Org tomatoes) Linear (Non-Org tomatoes)
January February M arch Apri
l
May June July
August
September
October
November December January February
M
arch Apri
l
May June July
August
September
October
November December January February
M
arch Apri
l
Graph. 8 - Price trend for Org and Non-Org Courgettes (2009=100)
Source: ISMEA. 60 70 80 90 100 110 120 130 140 150 160
Org courgettes Non-Org courgettes
2009 2010 2011 January February M arch Apri l Ma y June July August September October
November December January February
M arch Apri l Ma y June July August September October
November December January February
M
arch Apri
price breakdown along the organic supply chain has been analysed for the following five fruits and vegetables, which were available for the whole of 2011, for prices for produc-tion, wholesale and consumption: oranges, pears, toma-toes, courgettes and aubergines.
Looking at the results, we note that it is mainly in the distri-bution stage that the market value of vegetables and fruits increases most. In fact, mark-ups charged by wholesalers appear more limited than those charged by retailers to the consumer.
In reference to the products examined, the production stage contributes an average of just over 17% in the
deter-mination of the price to the consumer, wholesale is 34.5% and retail is almost 48%. the structure of the value chain, albeit with reference to a few products, reflects the char-acteristics of the organic supply chain, in some cases quite fragmented, which penalises the producer.
Among products surveyed, pears give the producer the highest percentage (25.3%), while oranges give the most value to wholesalers (51.8%). this is probably because the chain is better organised for pears than for oranges. Aubergines, among other products tested, provide the low-est share for producers (9.7%) and the highlow-est for retailers (63.8%).
Graph. 9 - Consumer price trend for Org and Non-Org Apples (2009=100)
Source: ISMEA. 80 90 100 110 120 2009 2010 2011
Org apples Non-Org apples Linear (Org apples) Linear (Non-Org apples) January February March
Apri l Ma y June July August September October
November December January February
March Apri l Ma y June July August September October
November December January February
March Apri
Graph. 10 - The "value chain" for some organic fruit and vegetables, 2011
Source: ISMEA processing of CAAB market and ISMEA survey network figures. 0% 20% 40% 60% 80% 100% Oranges Pears Tomatoes Courgettes Aubergines Product average
Percentage share of final value
5. Inputs
Fertilisers
the products allowed for use in organic farming are limited to the lists of active ingredients considered compatible with the principles in reg. (eC) No 834/2007 and subsequent reg. (eC) No 889/2008 detailed in Annex I (Fertilisers and soil conditioners), implemented at national level by Legislative Decree No 75/2010 (Annex 13).
the statistics available from IStAt refer, however, not to final consumption of these products by organic farms but to their commercial distribution, and also include "organic" products used by conventional farms. It should be remem-bered, also, that in the organic sector own-production and consumption of natural fertiliser and organic matter are relevant, a factor that is not statistically surveyed.
In 2010, the fertilisers distributed, allowed in organic farm-ing, reached 11.8 million tonnes, confirming the upward trend of recent years. Soil amenders and correctives drive this growth, as the other types have generally declined over
Graph. 1 - Fertilisers by type
Source: ISTAT. Graph. 2 - Fertilisers distributed by region, 2010
Source: ISTAT. 0 2 4 6 8 10 12 14 2003 2004 2005 2006 2007 2008 2009 2010 Million quintals Mineral Organic
Organic-mineral Amenders and correctives
0 2.000.000 4.000.000 6.000.000 8.000.000 Piedmont Valle d'Aosta Lombardy Trentino-Alto Adige Veneto Friuli-Venezia Giulia Liguria Emilia-Romagna Tuscany Umbria Marche Lazio Abruzzo Molise Campania Puglia Basilicata Calabria Sicily Sardinia Not allowed Thousand quintals Allowed
the past two years, especially mineral fertilisers, which fell by 46%.
the percentage of products allowed in organic farming to the total of fertilisers distributed has increased steadily from 2003 to 2010 from 12% to 27%. this relative growth was favoured by the parallel decrease in the amount dis-tributed on the whole, down from 52 million tonnes in 2003 to 44 million tonnes in 2010, a decline that has reduced im-port flows.
Between 2009 and 2010, the national average increase in the amount distributed was 2%. the largest amounts were distributed respectively in Veneto, Lombardy, emilia-Ro-magna and Lazio; in relative terms, the highest use of fer-tilisers on the whole occurred in Lazio, trentino-Alto Adige and tuscany with shares of around 40%; Molise and Friuli Venezia Giulia show the lowest shares, less than 10%.
Seeds
Certified organic seeds represent on average 2% of the total seeds distributed. the highest shares are recorded in the southern regions, with Basilicata at 15%, while in the north the percentages are very low and exceed 1% only in emilia-Romagna.
the use of certified organic seeds has shown marked variability over the years in relation to both agricultural production trends and markets, and to margin of exemp-tion, which in the absence of seed or vegetative propagat-ing material obtained by organic production meth-ods, al-lows Member States to authorise the use of non-organic seeds, provided they are not treated with plant protection products, other than those authorised for the treatment of organic seeds, or GMOs (Art. 45 of Reg. (eC) No 889/2008). A survey carried out as part of the Organic Seed plan re-vealed a lack of varieties suited to environmental condi-tions and demands of farmers, who then resort to the instrument of ex-emption. this situation, which assumes controversial assessments according to the affected per-son (farmer or seed producer) undoubtedly has an impact on the statistical significance of the data discussed below, since the distribution of seed for organic farming is only
partly related to the performance of crops. As of the 2012 farm year, the requirement to use certified seeds for du-rum wheat will be reintroduced (dm 8139 of 10.08.2011), but organic farmers will be exempt. perhaps this is a sign of a more stringent regulation that will extend to other plant species and also to organic production in the future. Graph. 3 - Seeds distributed and organic and under conversion UAA
Source: ISTAT and SINAB.
Graph. 4 - Percentage breakdown of distributed seeds by plant type, 2010 Source: ISTAT. 900 950 1,000 1,050 1,100 1,150 1,200 80 85 90 95 100 105 110 115 120 125 2003 2004 2005 2006 2007 2008 2009 2010 Thousand hectares Thousand quintals
Seeds distributed UAA org + conv
Cereals 80% Vegetables 2% Industrial plants 1% Fodder 16% Potatoes 2%
Overall, the amount of organic seed decreased in 2010 by 24% compared to 2009, to just over 8.1 tonnes, the lowest level since 2003. the decline in distributed volume applies to most of the regions, more clearly affecting the south, where negative changes were almost all more than 30%. In contrast were some regions of the Centre-North, es-pecially the Veneto (+134%) and some southern regions such as Molise and Sardinia, where increased use is due both to lower absolute values to begin with and lesser ac-cess to the instrument of exemption.
Cereals account for 80% of organic seeds distributed in Italy in 2010, followed by fodder with 16%, while the other plant species have minimum percentages that rarely ex-ceed 1%. the use of seeds for cereals is higher in all re-gions of the Centre-South, with maximum levels in Cam-pania and Molise.
For fodder, Basilicata, emilia-Romagna and tuscany stand out, with values between 150 and 210 tonnes of seed dis-tributed; for vegetables, areas that use the largest quanti-ties of seeds are the central regions and emilia-Romagna.
Feedingstuffs
the food supply of organic livestock is mostly own-produc-tion or comes from other organic farms, but this phenome-non is not measured by statistics on the amounts distribut-ed, which are therefore lower than real farm consumption. In general, feedingstuffs allowed in organic farming consti-tute only 0.6% of total feed distributed, with peaks of 11.6% in Friuli-Venezia Giulia and 4.7% in Lazio.
In Italy, in 2010, the industry and farms produced almost 950 thousand tonnes of feed allowed in organic farming, between complete and complementary. Compared to last year there was an increase of 7% and a consequent de-cline in imports by 18%. However, note the significant in-crease in flow of imports of certain raw materials, includ-ing organic cereals (+85% in the 2009-2010 period, source SINAB), which may have entered the animal feed produc-tion system, limiting imports of the processed product. the feed distributed on the whole stood at a level slightly lower than production (938,000 tonnes), highlighting the Graph. 5 - Feedingstuffs distributed overall, 2010
Source: ISTAT. 0 50 100 150 200 250 300 350 400 450 500 Thousand quintals Production Distribution Piedmont Valle d'Aosta Lombardy Trentino-Alto Adige Veneto Friuli-Venezia Giulia Liguria Emilia-Romagna Tuscany Umbria Marche Lazio Abruzzo Molise Campania Puglia Basilicata Calabria Sicily Sardinia
high degree of self-sufficiency of the Italian economy, with regard to the finished product, if not for raw materials. the time trend shows a steady increase in the quantities pro-duced and distributed, while trade is highly variable but modest in absolute terms: in 2010, the ratio of exports to production was just over 1%.
Major regional production is concentrated in the Centre-North and in particular in emilia-Romagna and piedmont, while in the South, IStAt does not survey quantities
pro-duced but only those distributed, probably due to the low-er numblow-er of feed mills, located mainly whlow-ere thlow-ere is a greater concentration of industrial farming.
Changes in distribution of feed compared to 2009 indicate a national average growth of 20% for complete feed, while the amount of complementary feed declined by 10%. the regions of the Centre-North absorb the largest amounts of this input. emilia-Romagna and the Marches lead for complete feed, while complementary feedingstuffs are more distributed in the North, where grazing makes up a large share livestock food requirements.
Plant protection products
the use of plant protection products in organic farming is limited to a group of active ingredients allowed by law. In general, organic farms resort to natural practices and, in excep-tional cases, use the synthetic products allowed. the share of products allowed in organic farming, com-pared to the total of active ingredients distributed, is very high, 53% of the national average in 2010. this indicates that the products allowed in organic farming are also widely used on conventional farms, because of their low environmental impact. Sardinia and Valle d'Aosta are the regions with the highest share (78%), but also in Calabria, Sicily and Abruzzo, the percentage exceeds 70%. A more or less intense use of active ingredients allowed in organic Tab. 1 - Active ingredients distributed by type (t)
Fungicides and acaricidesInsecticides Organic Other Total
2003 43,076 9,610 47 43 52,777 2004 41,185 9,233 84 50 50,551 2005 41,892 8,050 135 71 50,149 2006 39,663 7,593 116 55 47,426 2007 39,031 7,071 119 61 46,283 2008 38,506 5,822 206 44 44,579 2009 35,834 5,371 342 59 41,606 2010 31,642 5,747 420 79 37,888 Source: ISTAT
Graph. 6 - Production, distribution and trade of feedingstuffs in Italy Source: ISTAT. 0 5 10 15 20 25 30 35 40 45 50 0 200 400 600 800 1,000 1,200 2003 2004 2005 2006 2007 2008 2009 2010 Thousand quintal s (im p/ ex p) Thousand hectares (p ro d. /d is t.)
where there are fewer alternatives to current commercial products. In these cases the increased risk or cost of cul-tivation could lead farmers to abandon more problematic organic production.
Fungicides represent the largest share of uses, which over the last eight years was al-ways higher than 80%, but de-creased slightly in 2010, as opposed to insecticides and acaricides, whose share of the total rose from 13% to 15%. there was a very small but growing share of active ingredi-ents of organic origin (1.1%).
At the regional level the largest amounts distributed in 2010 were in Sicily (95,000 tonnes), followed by piedmont (41,000) and puglia (39,000). Compared to last year, there was a 9% drop in the national average and only in a few re-gions, including puglia (+18%) and Abruzzo (+11), the signs were positive.
farming depends on the presence or absence of crops with special needs for defence against plant disease, such as vegetables, fruit and vines.
the consumption of plant protection products continues to decrease over time: the amount distributed dropped from almost 53,000 tonnes in 2003 to 38,000 tonnes in 2010. the phenomenon is related to greater care by farmers in us-ing these products but also to their greater effectiveness, meaning lower quantities can be used.
this situation is also favoured by the Community frame-work that urges greater sustain-ability of these products. In particular, the reg. (eU) No 1107/2009 introduced spe-cific criteria regarding exclusion or limitation of active sub-stances. the process of evaluation of crop protection prod-ucts, which will take several years for substances on the market, may also be a critical element for organic farming, Graph. 7 - Active ingredients distributed by region, 2010
Source: ISTAT. 0 30,000 60,000 90,000 120,000 150,000 Piedmont Valle d'Aosta Lombardy Trentino-Alto Adige Veneto Friuli-Venezia Giulia Liguria Emilia-Romagna Tuscany Umbria Marche Lazio Abruzzo Molise Campania Puglia Basilicata Calabria Sicily Sardinia Not allowed Allowed
Bibliographical References
IStAt (2003-2010), inputs, portal agri.istat.it
IStAt (2012), Distribution of fertilisers for agricultural use. Year 2010, Statistics Report.
IStAt (2011), the distribution of plant protection products for agricultural use. Year 2010, Statistics Report. SINAB (2012), imports of organic products from non-eU countries, Biostatistics.