ALMA MATER STUDIORUM
UNIVERSITA' DI BOLOGNA
SCUOLA DI SCIENZE
Corso di laurea magistrale in Biologia Marina
DNA BARCODING OF PLEURONECTIFORMES: IN SILICO
ANALYSIS AND DEVELOPMENT OF MARKERS
Tesi di laurea in Struttura e Connettività delle Popolazioni Marine
Relatore Presentata da
Prof. Fausto Tinti Melania Safina
Correlatore
Prof. Ismael Cross Pacheco
Universidad de Cadiz
DNA barcoding of
Pleuronectiformes:
in silico
analysis and development of
markers.
Index.
Abstract...4
I.Introduction...5
I.1.Pleuronectiformes...5
I.1.1.Description and distribution of Pleuronectiformes...5
I.1.2.Importance in the Europe economy...6
I.1.3.Taxonomy...7
I.1.4.Flatfish Genomics and Genetic...9
I.2.Importance of DNA genetic markers for species identification...10
I.2.1.Use of Cytochrome Oxidase I and 16S rDNA for the flatfish DNA barcoding...12
I.3.Barcoding and Metabarcoding concepts...13
I.3.1.Environmental DNA...15
I.4.Importance of good primers to amplify mtDNA sequences...16
II.Aims of this study...19
III.Materials and Methods...20
III.1.DNA barcoding...20
III.1.1.DNA sequences database...20
III.1.2.Nucleotide sequences alignment...20
III.1.3.Analysis of intraspecific and interspecific genetic distance...21
III.2.Primer design...22
III.3.PCR in silico...23
IV.Results and Discussion...25
IV.1.1.Current flatfish data of the COI and 16S rDNA genes...25
IV.1.2.Comparison of intra- and interspecific genetic distances (barcode gap analysis)...27 IV.1.3.Primer design...31 IV.1.4.PCR in silico...33 IV.2.Discussion...36 V.Conclusions...39 Acknowledgements...40 Bibliography...41 Appendix...47
Abstract.
DNA barcoding is a method used for the identification and discovery of animal species. It usually involved a 648 base pair fragment of the mitochondrial cytochrome c oxidase subunit I, known as COI. This work is focused on the study of the genetic identification in the families belonging to the order Pleuronectiformes, commonly known as flatfish, and the accuracy of the genetic marker most used for the study of their DNA barcodes. The results indicate possible existence of taxonomical mistakes because several families do not show a gap between maximum intraspecific distance - which is the maximum distance within a specie - and the minimum interspecific distance - which is the minimum distance between a species and its nearest neighbor (NN), meaning that the marker in use cannot reliably distinguish among those species. This study uses a bioinformatic approach to design new Pleuronectiformes barcodes and compares their coverage and resolving power with that of existing barcodes. The new primers, proposed by the program ecoPrimer, are based on two indices that estimate the resolution capacity of the barcodes and the taxonomic coverage of them, for the amplification. The performances of both barcoding regions already in use (COI and 16 rDNA genes), and the new primer pairs designed, were performed through a ‘in silico PCR’. The results show that the new primer pairs, located in a different regions of 16S rDNA gene compared to the universal barcode region used in fishes, present best resolution capacity and taxonomic coverage than the others already in use. This is an essential complement for future barcoding studies.
I. Introduction.
I.1. Pleuronectiformes.
I.1.1. Description and distribution.
Pleuronectiformes, (flatfish) is a ray-finned fish order (Actinopterygii) that comprises a large number of species distributed all over the world with a large economic interest. Flatfishes are instantly recognizable, with a unique asymmetric body form, developed as an adaptation to a bottom-living lifestyle. They all begin their life as pelagic, bilaterally symmetrical fishes, but during larval development undergo a spectacular metamorphosis where one eye migrates from one side of the head to the other (Brewester, 1987), right or left, depending upon the family and it could be genetically fixed. Basically, flatfishes are the only vertebrates that make so radical switch from a bilaterally symmetrical body plan. This extreme mutation of the head permits adults to rest on the seafloor on their blind side, blending with the sediment (Harrington et al., 2016). Afterwards they assume a benthic lifestyle, generally lying on the bottom on their blind side, on the top of the substratum or partially buried under a fine layer of sand with their eyes protruding outside. Some species appear to have preferences for particular substrata, while others can be found on many of that, like silt, mud, sand, rocky or pebbly bottoms (Gibson, 2005).
Pleuronectiformes represent a very specialized assemblage within ray-finned fish. Flatfish fossils date back to the Eocene (Verneau et al., 1994), but the origin of group remains still unknown (Chapleau, 1993). The oldest fossil found, known as
Eobothus minimus, indicate the presence of flatfishes as far back as the early
Tertiary, in the Eocene (approximately 53-57 million years ago; Schwarzhans, 1999).
It represents an advanced evolutionary line within the main suborder Pleuronectoidei. Others fossils are found from the Eocene with the structural features and diversity of the Order, indicating that the diversification occurred earlier than 45 million years ago, before Lutetian (Chanet 1997; Schwarzhans 1999). In addition, these fossils highlight the fact that all the anatomical specializations, such as cranial asymmetry and modifications of the caudal skeleton, occurred before. However ‘when’ is a question that recent molecular phylogenetic studies are trying to resolve. Harrington et al. (2016) claims that the flatfish asymmetry concerning the complete orbital migration is probably evolved over an interval of no more than 2.97 million years.
The life near the sea bottom allows flatfishes to live successfully and play the ecological roles as both benthic predator and prey (Gibson, 2005). Three-quarters of flatfishes show a tropical distribution, while one quarter is northerly and southerly distributed in temperate waters (Pardo et al., 2005). In tropical areas, flatfishes can be found in a variety of habitats including mangrove estuaries, nearby mud flats, seagrass bed and on mud bottoms. They can be generally found where substrata mostly consisted of sand with algae, around coral, and in lagoons associated with reefs. The majority of flatfishes (such as Bothidae, Samaridae, Poecilopsettidae), inhabiting the Indo-Pacific region, are small fishes without any commercial importance. The larger species (like Psettodidae and some Paralichthyidae and Soleidae) are captured, in the majority, in tropical fisheries, but also in temperate and subartic zones (Gibson, 2005).
I.1.2. Importance in the Europe economy.
Flatfish are sold in European markets in different ways, mostly as frozen fillets (Sotelo et al., 2001). The high-value species are sole (Solea solea), turbot (Scophthalmus maximus), European plaice (Pleuronectes platessa) and flounder (Platichtys flesus) (Cerdà et al., 2013). In the Northeast Atlantic, there are a total
of 11 relevant species for fisheries including representatives of Pleuronectidae (such as North Sea plaice Pleuronectes platessa, and the Atlantic halibut
Hippoglossus hippoglossus), Soleidae (such as the common sole Solea solea, and
Senegalese sole S. senegalensis), and Scophthalmidae (with the turbot
Scophthalmus maximus, the brill S. rhombus, and the megrim Lepidorhombus whiffiagonis). In Europe, the main flatfishes used in aquaculture are the common
sole, the Senegalese sole, that is especially commercialized in Southern Europe (Garcia-Cegarra et al., 2013), the turbot and the Atlantic halibut. Currently, the aquaculture of S. senegalensis in Spain and other European countries is seriously impaired because of difficulties in controlling reproduction in captivity and suboptimal larval nutrition (Cerdà et al., 2013).
I.1.3. Taxonomy.
According to Chapleau (1993), Pleuronectiformes can be divided in the suborders Psettodoidei and Pleuronectoidei and thirteen families (Fig. 1). The NCBI (National Center for Biotechnology Information) places the Order of Pleuronectiformes using this taxonomy:
Kingdom: Animalia → Phylum: Chordata → Subphylum: Vertebrata → Class: Actinopterygii → Infraclass: Teleostei → Order: Pleuronectiformes → Suborders:
1. Pleuronectoidei → Family: Achiridae, Bothidae, Citharidae, Cynoglossidae, Paralichthodidae, Paralichthyidae, Pleuronectidae, Poecilopsettidae, Rhombosoleidae, Samaridae, Scophthalmidae, Soleidae 2. Psettodoidei → Family: Psettodidae
Taxonomically, the best known flatfishes are those living in areas with large commercial fisheries of the northern hemisphere, such as both Atlantic and Pacific Oceans (Pleuronectidae, Scophthalmidae and some representatives of Soleidae and Paralichtyidae). In the Southern temperate regions like Australia-New Zealand and South America, commercial fisheries were also supported by Rhombosoleidae and Paralichthydae. In spite of the greatest species diversity of flatfish in the Indo-Pacific tropical areas, the taxonomy is still unclear because of taxonomy difficulties to the species identifications and the small size of species (Gibson, 2005). However, one of the major questions concerning flatfish phylogeny is the presumptive monophyly of the order, due to three synapomorphic characters:
1. Migration of one eye during ontogeny
2. Anterior position of the origin of the dorsal fin
3. Presence of a recessus orbitalis (accessory organ associated with eyes)
A recent phylogenetic study based on UCE (ultraconserved DNA element), with over 1,000 loci sampled from 45 carangimorph species, supports flatfish monophyly, assuming that Psettodes is a sister lineage to Pleuronectoidei, which contains all other flatfish species, and that they all belong to an unique branch within Carangimorpha (Harrington et al., 2016). On the contrary, previous studies claimed a polyphyletic origin, suggesting a multiple origin from different groups of symmetrical fishes (Pardo et al., 2005).
I.1.4. Flatfish Genomics and Genetics.
Fish aquaculture is one of the most sustainable source of food for humans, mostly because of its high content in proteins and lipids (Hibblen et al., 2006). In order to protect the consumer, the EU has strict regulations for seafood labelling, which most include the species name (EU Council Regulation No 104/2000, EU Commission Regulation No 2065/2001). It is extremely important to trace the products in order to avoid and to detect commercial fraud, but this is not so easy, because processed aquatic food is the most widely traded type of food since it lost all the morphological characters suitable for species identification during the conservation procedures (Benard-Capelle et al., 2015). The genetic identification of species can help to solve this problem (Kochzius et al., 2010).
The high demands in flatfishes, due their economic importance, increases fishing pressure with the serious consequence that wild stocks has reduced genetic diversity in plaice, with a shift towards earlier sexual maturation at smaller size in sole and plaice as well (Hoarau et al., 2005; Mollet et al., 2007; van Walraven
et al., 2010). As a consequence, the development of aquaculture has been
proposed for some of these species to supplement the demands for human consumption and reduce the pressure on natural populations. Identification and characterization of the genes, as well as genetic networks controlling traits like growth rates, reproduction, larval development and disease resistance, would
allow for a better optimization of production and management procedures in the industry. The lack of knowledge concerning pathologies and their prevention, the procedures associated with the control of reproduction in captivity, the proper amount of diet to reduce malformations and pigmentation anomalies, and, instead, to improve growth and disease resistance with all the physiological mechanism involved, are some of the major problems in flatfish aquaculture (Millàn et al., 2011; Agulleiro et al., 2006). In the last few years an important effort has been directed towards the use of functional genomics, metabolomics and proteomics to better characterize, as has already been mentioned, reproduction, development, nutrition, immunity and toxicology of flatfishes. The aim is to identify the critical genes and molecules that control physiological traits in order to improve current flatfish aquaculture structure, and several studies have proceeded on this way (Garcia-Cegarra et al., 2013; Portela-Bens et al., 2016). However, since flatfishes are non-model organisms, the genomic information for this Order has remained very limited. The usual techniques used for genome mapping studies, such as EST database or micro-arrays, are very limited because of high cost and time-consuming with a low analysis number, so the use of new sequences technologies that allow massive-scale DNA sequencing (Next Generation Sequencing) with a feasible and cost-effective way, is the newest approach (Cerdà et al., 2013).
I.2. Importance of DNA genetic markers for
species identification.
The genetic marker analysis is an important tool for identify populations with genetic or taxonomic uncertainty by comparing the genotypes at a number of polymorphic loci, in order to establish management units within species. It also provides useful tools for preventing illegal hunting and protecting endangered species (Arif et al., 2011). In the animal realm, huge number of studies, for
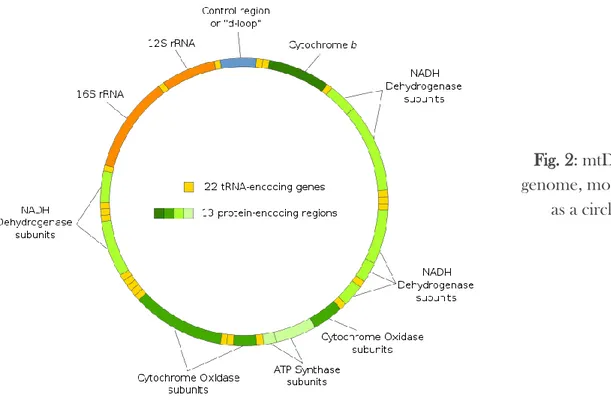
conservation genetics, are based on the sequence variation of the mitochondrial DNA (mtDNA) which consists of a haploid, maternally-inherited circular chromosome and, ordinarily contains 36 or 37 genes: 2 for rRNAs, 22 for tRNAs and 12 or 13 coding genes that translate subunits of multimeric proteins of the inner mitochondrial membrane (Fig. 2). This type of genetic marker has its own particularities such as histone-free, limited repair ability with a relatively high mutation fixation rate (5-10 times than nuclear DNA), and it’s a better target for analysis because of its lack of introns, its limited exposure to recombination and its haploid mode of inheritance (Saccone et al., 1999). Mitochondrial DNA has been evolved faster than nuclear genome, the rate of evolution is different across mtDNA genes, and it has been used for examine various phylogenetic relationship. Furthermore, most cells contain multiple copies of the mtDNA molecule so it can be obtained from very small amounts of cell tissue that contained degraded DNA. The mtDNA sequences were used in conservation genetics for resolving taxonomies, establishing interspecific hybridization, population structuring and the detection of illegal hunting and conservation of endangered animals (Arif et al., 2011). It is a tool for structural, evolutionary and population studies in several eukaryotic organisms because of the easy way in how sequence information can be obtained, by selective gene amplification with universally conserved primers (Tinti et al., 1999). However, mtDNA phylogeny represents only the genealogy of a gene that is almost only maternally transmitted, so for a more accurate interpretation of population biodiversity, genetics or phylogeny, additional markers targeting nuclear DNA need to be incorporated.
I.2.1. Use of Cytochrome Oxidase I and 16S rDNA for the flatfish DNA barcoding.
At the beginning, the resolution of the phylogenetic relationships within Pleuronectiformes was provided by using proteins as biochemical taxonomical markers, just in those cases where the product to be identified has not subjected to thermal treatment, because otherwise proteins become denatured and difficult to be analyzed. This treatment did not provide a solid species identification, because it also requires the use of authentic species protein extracts to be analyzed together with the unknown samples (Sotelo et al., 2001). DNA, instead, is now used as a biochemical, taxonomical marker in a high variety of process treatments, even when the product is heated, because is still possible the amplification of a short fragment containing species diagnostic value (Quintero et al., 1998). The partial DNA sequences of the cytochrome c oxidase subunit I (COI) and of the large RNA ribosomal subunit gene (16S rDNA), are the most used genetic markers for fish species identification, seafood control, fisheries control and
Fig. 2: mtDNA genome, modelled
species delineation (Kochzius et al., 2010). Several molecular studies addressing in the species identification of flatfishes with these mtDNA fragments (Tinti et
al., 2000; Tinti & Piccinetti 2000; Sotelo et al., 2001; Pardo et al., 2005).
I.3. Barcoding and Metabarcoding concepts.
DNA barcoding is a method specialized in species identification and a key tool for assessing biodiversity in both taxonomic and environmental studies. It is proposed to assign an unambiguous tag to each species in order to discriminate between taxa (Ficetola et al., 2010). It identifies biological diversity using standardized DNA regions, called marker, that must be as universal as possible and must contain enough information to discriminate between closely related species, and may also to discover new ones (Riaz et al., 2011). Therefore, DNA barcode is a small piece of the genome found in a large range of species and is usually located on the mitochondrial genome for animals or on the chloroplast genome for plants (Coissac et al., 2012). Barcoding has shown that DNA barcode can discriminate species across the whole animal kingdom (Tyagi et al., 2010) and in all kinds of animal groups such as mammals, fishes, birds, insects and others (Hebert et al., 2004; Hubert et al., 2008; Clare et al., 2011). Certain genes can be used because some regions of these are well conserved, so they show a very slow rate of evolution and very little change in their DNA sequence. One of the most used barcode in animals is the cytochrome c oxidase subunit I (COI), with 648 base pair fragment near the 5’ end, as a standard barcode for animal identification (Hebert et al., 2003).
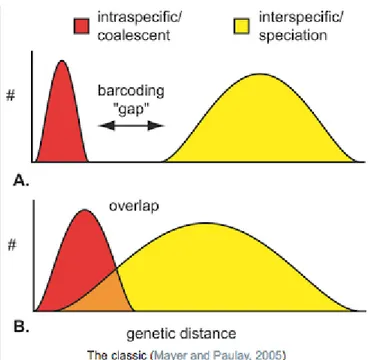
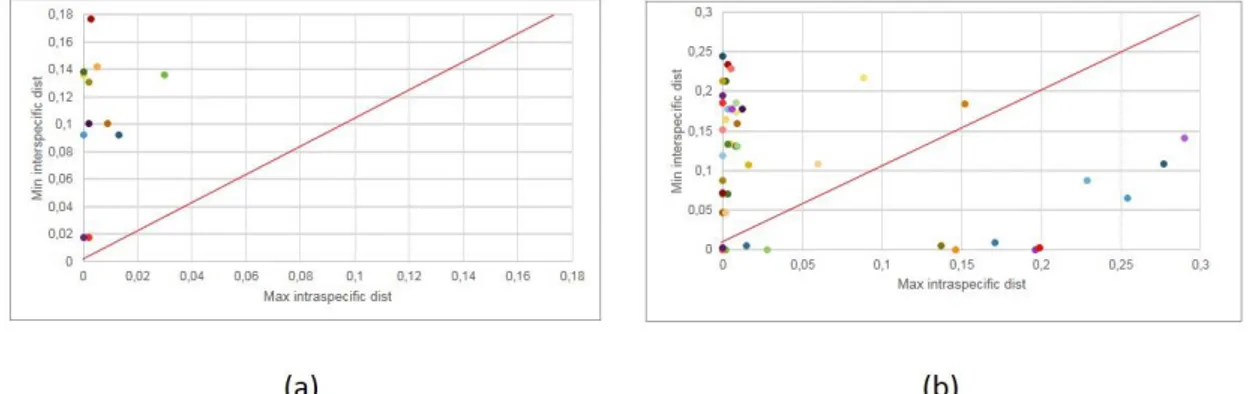
In this context, it is established that the gap between maximum intraspecific distance - which is the maximum distance within a species - and the minimum interspecific distance - which is the minimum distance between a species and its nearest neighbor (NN) – can be used for species delimitation (Fig. 3-A) (Ashfaq
et al., 2013). The extent and the separation between intraspecific variation and
interspecific divergence for the selected marker is extremely important in order to obtain the best accuracy in the taxonomic work. The much bigger is the overlap between genetic variation between species and the divergence that separate sister species (Fig. 3-B), the less effective barcoding will be (Meyer and Paulay, 2005).
When such overlap is real, it means that the marker used for the study cannot reliably distinguish among those species. Subsequently other portions of DNA have been proposed as barcodes, because the performances of different DNA regions may change in different taxa (Ficetola et al., 2010).
Many DNA barcoding resources have been developed since 2003 and the researchers from all over the globe have joined two major international initiatives in order to develop an efficient DNA barcoding based species identification system, universally applicable:
1. The iBOL (International Barcode of Life), activated in 2010 by the Biodiversity Institute of Ontario at the University of Guelph, Canada. They
Fig. 3: Schematic of the Inferred Barcoding Gap for two species. A good Barcoding need to have
no overlap to discriminate between species (A). Overlap
created the barcode reference library BOLD (Barcode of Life Data System) (http://boldsystems.org) which is a barcode database assembling a global network of taxonomist, biologists and geneticists, available to the public. 2. The CBoL (Consortium for the Barcoding of Life), activated in 2004 by the
grants from Alfred P. Sloan foundation (Bhargava and Sharma, 2013). Reflecting the rapid growth in barcode coverage (Jinbo et al., 2011), the Barcoding of Life Data Systems (BOLD; Ratnasingham & Hebert 2007), now includes records for more than 174K animal species with more than 5 million barcode sequences (Access in Nov 2016). The order Pleuronectiformes contains 4,548 specimens with barcodes collected from 46 countries (Access in Nov 2016). DNA barcoding can be divided into two main types depending on its application in different fields: DNA barcoding sensu stricto and DNA barcoding sensu lato (Valentini et al., 2009). The sensu stricto barcoding is the standard barcoding defined by CBoL and described above. On the other hand, the sensu lato corresponds to a DNA-based taxon identification using diverse techniques that lie outside the CBoL approach and it is known as DNA metabarcoding or environmental barcoding, which could be defined as the simultaneous identification of several species, even from environmental samples, using high throughput sequencing techniques (Clarke et al., 2014). Manipulation of such large datasets requires very specifically program, such as OBITOOLS package (http://metabarcoding.org/obitools) (Boyer et al., 2016).
I.3.1. Environmental DNA.
Advances in DNA sequencing technology and bioinformatics have significant potential to strengthen biological monitoring in the ocean. All living things contain DNA and through metabolic waste or sloughed cells, they generate waste that will persist in the environment for some period of time (Kelly et al.,
2014). This DNA obtained directly from environmental samples (sediments, soil, water, air) represents the Environmental DNA (eDNA), that could be used to detect individual animal species of interest even if they are present at very low abundances (rare or endangered species). In the beginning, it was a method to assess the diversity of macro-organism communities applied to ancient sediments, revealing the past of extinct and extant mammals, plants and birds (Willerslev et
al., 2003). Only recently the approach has successfully used on several samples,
including marine and terrestrial environments, to increase the accuracy of the distribution of vertebrate species, and decrease the cost of survey (Maruyama et
al., 2014). Obviously, eDNA monitoring cannot replace field observation by
experienced ecologists and taxonomists, but its integration it will be helpful to obtain basic data on distribution and abundance of species (Thomsen et al., 2012). As mentioned before, the amplification of barcode markers from eDNA with PCR, leads to a sequence that can became a proxy for the biodiversity present in the collected samples. Thus, one of the major challenges of metabarcoding is to find new primers pair, with their associated barcode regions, which are appropriate for particular environmental applications (Coissac et al., 2012).
I.4. Importance of good primers to amplify mtDNA
sequences.
Other than all the properties of an ideal DNA barcode, high taxonomic coverage and high resolution are essential for the application of barcodes to a number of taxa as large as possible, and it is necessary that the DNA barcode region should have sufficiently conserved flanking regions to design universal primers (Ficetola et al., 2010). These primers should be developed in order to amplify a specific number of regions of the mtDNA genome in a wide range of taxa (Arif et al., 2011). Robust primers enable the routine recovery of specific
segments of the mitochondrial genomes (Hebert et al., 2003). In literature there are various sequences utilized for flatfish DNA barcoding (Kochzius et al., 2010). However, the most used primer pair to resolve Pleuronectiformes genetic structure is that designed by Palumbi (1994), which amplify a 500-600 bp
fragment of the 16S rDNA. In the BOLD
(http://www.boldsystems.org/index.php/databases), it is also possible to find a comprehensive registry of primers created from the users, which can be used for identify closely related species, as well as higher taxa, in many animal phyla. All this indicates that exist a high number of available primers that will be helpful to achieve the same objective, but just recently, thanks to the new generation software tools that can handle large dimension data, in association with the enough information of the complete mitochondrial DNA available, it is possible to find and create the perfect primers pair for species identification.
This study propose an approach for comparing the performance of potential barcoding regions, through a ‘in silico PCR’ performed on the mitochondrial Pleuronectiformes dataset, and based on two indices that estimate the resolution capacity of the barcodes and the taxonomic coverage of the primers used for the amplification. The program used for this aim, was the ecoPrimers software that selects highly conserved primer pairs and evaluates the quality of these primer pairs using two evaluation indices (Fig. 4) as proposed by Ficetola (2013):
Bc → Barcode coverage → represents the proportion of amplified taxa for a specified taxonomic rank, among the total number of taxa of the same level, and estimates the amplification range of a primer pair.
Bs → Barcode specificity → represents the proportion of specifically identified taxa among amplified taxa and evaluates the discrimination capacity of the amplified marker.
After that, it is necessary to compare the resolution and specificity of different primer set on the same set of mitochondrial sequence data by performing an in
silico PCR with the program ecoPCR.
II. Objectives of the study.
1. Develop a report of the characteristics and current genetic knowledge of species and families belonging to the order Pleuronectiformes.
2. Describe the current state of both COI and 16S rDNA sequences of the order Pleuronectiformes included in the public database used for the achievement of the DNA barcoding studies.
3. Analyze the gaps between both maximum and avarage intraspecific distance with minimum interspecific distance of the target species of this study.
4. Design new primers using the bioinformatic software ecoPrimers, to improve the DNA barcoding of Pleuronectiformes, electing the most useful pair of primers in order to amplify and sequence mtDNA markers.
5. Compare and analyze, via PCR in silico, different DNA barcodes already used in previous studies of flatfish, along with the new primers obtained in the previous objective 4.
III. Materials and Methods.
III.1. DNA barcoding.
III.1.1. DNA sequences database.
For the purpose of this work, as well as for surveying the variation of the mitochondrial genes COI and 16S rDNA, all the 12 families of Pleuronectoidei, plus the Suborder Psettoidei itself, were targeted. Orthologous sequences of flatfish species were retrieved from the National Center for Biotechnology
Information (NCBI), which contains information provided from different sources,
such as GenBank, RefSeq, TPA y PDB. For each family, both COI and 16S rDNA species-specific sequences, were downloaded in a fasta format and, using the software Obigrep of the Obitools package for Linux (Boyer et al., 2016), they were cleaned from all the possible errors. The software Obigrep is specifically designed for filtering the sequences files, taking account of theirs taxonomic information and to simplify the manipulation of sequence files (https://git.metabarcoding.org/obitools/obitools/wikis/home). After cleaning, the sequence data are uploaded in the SpeciesIdentifier program (Meier et al., 2006) for performing the statistical description, using the information provided, like the species of each sequences, the accession number and the complete sequence.
III.1.2. Nucleotide sequences alignment.
Family-specific alignments were created from cleaned sequences using the program Multiple Alignment Using Fast Fourier Transform (MAFFT) (Katoh et
al., 2002) with the default parameters (Strategy: Auto). The sequences that
showed reverse strands marked by the blue line (instead the red line) were reported and appropriately converted into theirs reverse-complement sequences,
with the web program Reverse complement
III.1.3. Gap analysis: comparing the intraspecific and interspecific genetic distances.
With the aligned sequences obtained in MAFFT, the pairwise genetic distances among all the sequences from each family were estimated. For the study of gap between the maximum intraspecific and the minim interspecific distance, it is necessary to have all these genetic distance values between each pair of sequences, for each flatfish family. This will generate an enormous number of comparisons that it must be treated later to perform the barcode gap analysis, with the use of dedicated programs. To do that, for each family and from the alignments obtained, the genetic distance between each pair of sequences was calculated with the program Molecular Evolutionary Genetics Analysis (MEGA) using the evolutionary model Kimura-2-parameter (Kimura, 1980) with the pairwise-deletion option, to eliminate nucleotide gaps (Ashfaq et al., 2013). Thus, the maximum and the average intraspecific distance (among sequences from each species) and the minimum interspecific distance (the smallest value among all the comparisons made between sequences from all species) were obtained by ranking pairwise distance values according to taxonomy.
The data obtained in MEGA were sequentially reorganized and processed in Linux with the use of scripts realized for this aim, in order to get the values of maximum and the average distance between sequences inside a species, and the minimum distance with the other species, within every family analyzed.
All the files generated with this script were processed in Microsoft Excel for visualizing gaps i) between the maximum interspecific distance and the minimum interspecific distance and ii) and between the average intraspecific distance and minimum interspecific distance. In addition, the comparison of the maximum intraspecific distance with the number of the sequences for each species for each family of Pleuronectiformes was also represented. For the interpretation of the information that were obtained with the elaboration of these comparative graphs,
it is necessary to keep in mind the fact that a species is different from its Nearest Neighbor (NN) if its maximum intraspecific distance is less than the minimum genetic distance between them (Ashfaq et al., 2013). To better understand that, a red line was diagonally designed in the graphics, which represents the points where the maximum or average intraspecific distance value is equal to the minimum interspecific distance value and theirs ratio is 1.
III.2. Primer design.
The design of new barcoding primers for Pleuronectiformes is one of the most interesting goals of this work. This aim can be addressed using the mitochondrial genomes of the Pleuronectiformes, available in the NCBI database, and the ecoPrimers program (Riaz et al., 2011) from the Obitools package (Boyer
et al., 2016). The primer design was carried out firstly at the Order level, to obtain
a perfect primer pair for this taxonomic group. The ecoPrimer program was then used also for obtain primer pairs at the Family, as well as for any different taxonomic level. To use ecoPrimer program, the following steps must be done:
1. Available complete mitochondrial flatfish genomes were downloaded from GenBank (accessed in July 2016), representing 120 sequences of 11 Family of the Pleuronectiformes.
2. The ecoPrimer program designs the most efficient barcode primers and markers, based on the set of reference sequence records downloaded, and identifies highly conserved and useful sequences to use them as sites of primer annealing. It is an useful tool because it maximize the potential of the intervening sequence among these primers to discriminate between taxa and to amplify a variable DNA region. The ranking of the primer pairs is based on the two indexes Bc and Bs that assess the taxonomic range potentially amplified by a primer pair (Bc) and the discrimination capacity
of the amplified region (Riaz et al., 2011). The parameters used in the program were:
O = 20, as the primer length;
e = 2, as the maximum numbers of errors allowed per primer;
3 nucleotides on the ‘3 end of the primers that must have a strict match with their target sequences;
q = 0.7, as the proportion of the sequence records in which a strict match between the primers and their targets occurs;
s = 0.7, as the proportion of the example sequence records that must fulfill the specified parameters for designing the barcodes and the primers;
l = 10, as the minimum length of the barcode, excluding primers;
L = 300 – 800, as two different maximum length of the barcode;
c, because the sequences of the mtDNA are circular
III.3. PCR in silico
Using the results obtained with the ecoPrimers program, along with the combinations of primers already in use widely in the literature, it was realized the
in silico amplification of the different sequences of Pleuronectiformes for each
family. It was performed with the program ecoPCR (Clarke et al., 2014), included in the Obitools package, that uses a pattern-matching algorithm to identify sequences within a database that can be amplified with a given primer pair. It compares the degree of taxonomic coverage and the amplification of the sequences belonging to the different family of the order flatfish.
For the accomplishment of this bioinformatics study, a local dataset of complete Pleuronectiformes was used in order to test whether metabarcodes provided better taxonomic coverage. To verify the best coverage of every pair of primers, that join the end-regions of the DNA sequences, the PCR in silico was realized for
each family excluding Cytharidae and Paralichthididae because no data was available for the entire mtDNA. To carry out this goal, all the sequences, along with their Taxonomic information, were downloaded from NCBI nucleotide and taxonomy, respectively. Then they were converted into the local database with
ecoPCR by using the ecoPCRFormat.py script (script in Phyton of the Obitools
program). After that, the different primer pairs (Table 1) were tested separately on each family of the database using the same parameters:
e = 4, as the maximum number of errors allowed per primer;
the taxonomic group identified by its “taxid” specific for each family (R=accession number of the family);
c, because the sequences of the mtDNA are circular
The results obtained for each family and for each pairs of primer include: the length of the original sequences, the scientific name of the species, the length of the amplified fragment (excluding primers), the number of allowed mistakes, the temperature of denaturation (Tm), etc. From these data, a statistic summary is realized with the Bc value of each pair of primers using the ecotaxstat program of the Obitools package.
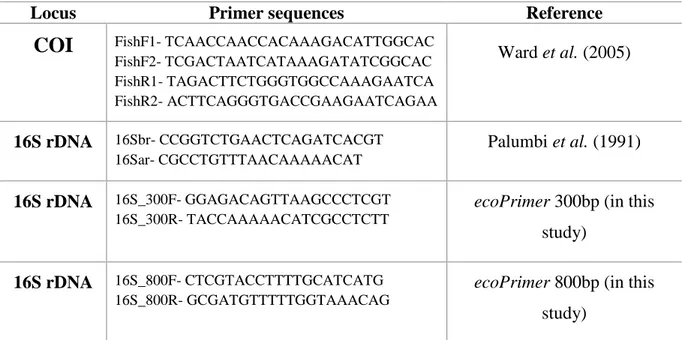
Table 1: Pairs of primers used for the PCR in silico.
Locus Primer sequences Reference
COI FishF1- TCAACCAACCACAAAGACATTGGCAC FishF2- TCGACTAATCATAAAGATATCGGCAC FishR1- TAGACTTCTGGGTGGCCAAAGAATCA FishR2- ACTTCAGGGTGACCGAAGAATCAGAA Ward et al. (2005) 16S rDNA 16Sbr- CCGGTCTGAACTCAGATCACGT 16Sar- CGCCTGTTTAACAAAAACAT Palumbi et al. (1991) 16S rDNA 16S_300F- GGAGACAGTTAAGCCCTCGT 16S_300R- TACCAAAAACATCGCCTCTT
ecoPrimer 300bp (in this
study)
16S rDNA 16S_800F- CTCGTACCTTTTGCATCATG 16S_800R- GCGATGTTTTTGGTAAACAG
ecoPrimer 800bp (in this
IV. Results and Discussion.
IV.1. Results.
IV.1.1. Current flatfish resources of the COI and 16S rDNA genes.
The taxonomical information of the NCBI Taxonomy and the bibliographical reference of Chapleau (1993) were used to describe the total number of species for each Family of Pleuronectiformes. The Paralichthodidae family contains one species, so it was excluded from the barcode gap analysis because it is not possible to perform pairwise intraspecific comparisons with only one species.
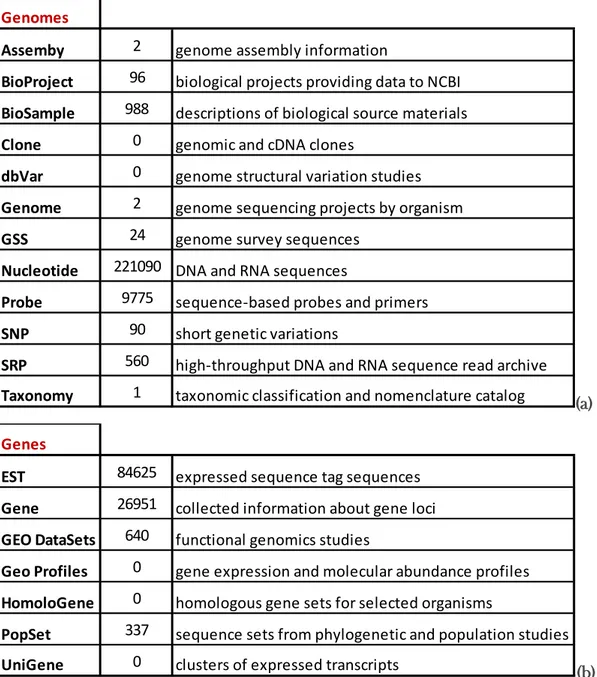
The genomic flatfish information available from NCBI (access in Nov 2016) indicates that there are 221,090 DNA and RNA sequences, more than 50,000 described proteins, 2 completely sequenced genomes and almost 27,000 gene loci collected (Table 2). In the BOLD database 474 species are reported, from which 446 present barcodes, and 1,470 primers are published in the Primer database section from BOLD (access Nov 2016).
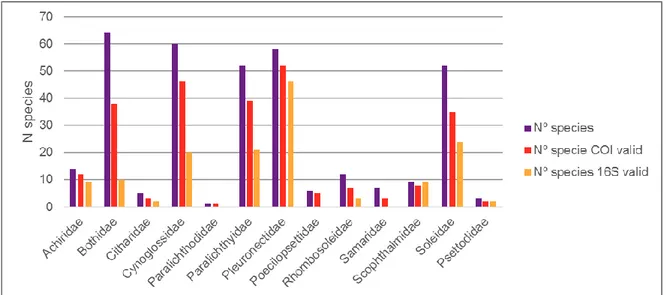
Fig. 5: Graphic representation of the total number of species of the Order Pleuronectiformes divided by Family and the total number of species that have COI and 16S valid sequences.
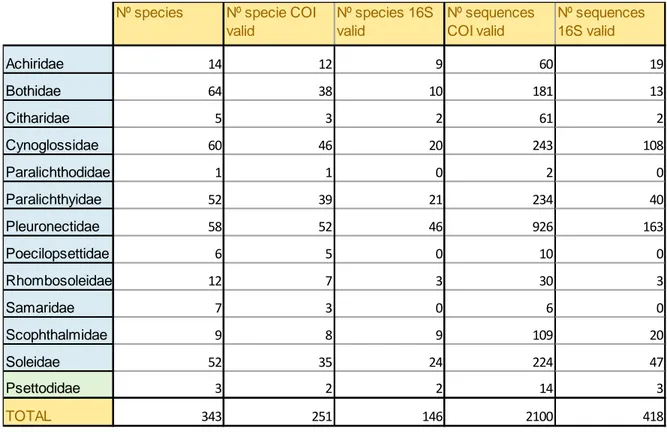
The number of barcoded species with the Cytochrome Oxidase I sequences are less than the total number for 11 families out of 12 (Table 3; Fig. 5), especially after the sequence cleaning of the all possible errors with the Obigrep software. The family with highest number of valid COI sequences is Pleuronectidae with 926, on a total of 2,100 COI valid sequences (Table 3). The number of species barcoded with the 16S rDNA sequences are definitely much less than those barcoded with the COI (Fig. 5), and there are five more families with no adequate
Table 2: Actual information available in NCBI database about Genes of the Pleuronectiformes (a) and Genomes (b).
(a)
(b)
Genomes
Assemby 2 genome assembly information
BioProject 96 biological projects providing data to NCBI
BioSample 988 descriptions of biological source materials
Clone 0 genomic and cDNA clones
dbVar 0 genome structural variation studies
Genome 2 genome sequencing projects by organism
GSS 24 genome survey sequences
Nucleotide 221090 DNA and RNA sequences
Probe 9775 sequence-based probes and primers
SNP 90 short genetic variations
SRP 560 high-throughput DNA and RNA sequence read archive
Taxonomy 1 taxonomic classification and nomenclature catalog
Genes
EST 84625 expressed sequence tag sequences
Gene 26951 collected information about gene loci
GEO DataSets 640 functional genomics studies
Geo Profiles 0 gene expression and molecular abundance profiles
HomoloGene 0 homologous gene sets for selected organisms
PopSet 337 sequence sets from phylogenetic and population studies
data to be used for this work: Citharidae, Poecilopsettidae, Rhombosoleidae, Samaridae and Psettodoidei.
IV.1.2. Comparison of intra- and interspecific genetic distances (barcode gap analysis).
A comparative analysis of the genetic interspecific distances (differences between sequences of different species) with both maximum and average genetic distances at the intraspecific level (differences between individual sequences attributed to the same species) was performed and illustrated for each Family of the Pleuronectiformes in order to analyze the barcode gap. For a better understanding it was used a red line representing the point where the ratio between maximum/average intraspecific distance and minimum interspecific distance is 1, i.e. the values are equal. The available data were not adequate for the barcoding
Table 3: Data of the total number of the species according to NCBI, the total number of species with COI sequences and 16S sequences, and the total number of the COI and 16S sequences used for this work.
Nº species Nº specie COI valid Nº species 16S valid Nº sequences COI valid Nº sequences 16S valid Achiridae 14 12 9 60 19 Bothidae 64 38 10 181 13 Citharidae 5 3 2 61 2 Cynoglossidae 60 46 20 243 108 Paralichthodidae 1 1 0 2 0 Paralichthyidae 52 39 21 234 40 Pleuronectidae 58 52 46 926 163 Poecilopsettidae 6 5 0 10 0 Rhombosoleidae 12 7 3 30 3 Samaridae 7 3 0 6 0 Scophthalmidae 9 8 9 109 20 Soleidae 52 35 24 224 47 Psettodidae 3 2 2 14 3 TOTAL 343 251 146 2100 418
gap analysis of Citharidae, Poecilopsettidae, Rhombosoleidae, Samaridae and Psettodoidei at 16S rDNA marker, and of Paralichthodidae both at the COI and 16S rDNA markers.
Two alternative scenarios were obtained:
- All the genetic distance values show a gap between intraspecific and interspecific distance because they are above the red line. As well, both the maximum and average distance to minimum, are higher than the respective intraspecific distances for all the species (Fig 6.a). The families showing this pattern are: Achiridae, Citharidae, Poecilopsettidae, Rhombosoleidae and Samaridae at COI, Bothidae and Paralichthyidae at 16S rDNA (Appendix, Fig. 1.1; 2.2; 3.1; 5.2; 7.1; 8.1; 9.1).
- One or several genetic distance values are below the red line, indicating that the maximum and/or the average intraspecific values are higher than the minimum distance within a species (Fig 6.b). The families showing this pattern are: Achiridae at 16S rDNA, Bothidae and Paralichthyidae at COI, Cynoglossidae, Pleuronectidae, Scophthalmidae and Soleidae at both COI and 16 rDNA. More specific:
Achiridae 16S rDNA → all species show the barcode gap between intraspecific and interspecific distance except 2: Trinecte paulistanus and Achirus lineautus (Appendix, Fig. 1.2);
Bothidae COI → all species show the barcode gap except Bothus
ocellatus, that shows the value under the red line in the comparison
between the maximum intraspecific and average intraspecific, and
Laeops nigromaculatus, which shows the average intraspecific/minimum interspecific plotted value under the red line (Appendix, Fig. 2.1);
Cynoglossidae COI → eleven species, such as Cynoglossus acaudatus,
Cynoglossus capensis, Cynoglossus macrostomus, Cynoglossus itinus, Paraplagusia japonica, Symphurus civitatium, do not exhibited the
barcode gap because they show the maximum and the average intraspecific values higher than the minimum interspecific distance (Appendix, Fig. 4.1);
Cynoglossidae 16S rDNA → all species show the barcode gap except
Symphurus plagusia, Symphurus plagiusa and Cynoglossus semilaevis,
which show the value under the red line indicating the absence of a gap (Appendix, Fig. 4.2);
Paralichthyidae COI → five species, such as for Pseudorhombus
natalensis, Pseudorhombus arsius, Syacium papillosum, Paralichthys isosceles, do not show the barcode gap because the maximum and the
average intraspecific values are higher than the minimum distance (Appendix, Fig. 5.1);
Pleuronectidae COI → twelve species, such as for Lepidopsetta
bilineata, Hippoglossoides dubius, Platichthys flesus, Kareius bicoloratus, do not show the barcode gap because the maximum and the
average intraspecific values are higher than the minimum distance (Appendix, Fig. 6.1);
Pleuronectidae 16S rDNA → five species do not show the barcode gap, such as for Glyptocephalus cynoglossus, Pleuronectes platessa because the maximum and the average intraspecific values are higher than the minimum distance (Appendix, Fig. 6.2);
Scophthalmidae COI → all species show the barcode gap between intraspecific and interspecific distances except for Psetta maxima, (Appendix, Fig. 10.1);
Scophthalmidae 16S rDNA → all species show the barcode gap except for Lepidorhombus whiffiagonis, which shows the value under the red line indicating the absence of a gap (Appendix, Fig. 10.2);
Soleidae COI → five species were plotted below the red line, such as for, Austroglossus pectoralis, Pegusa impar, Pardachirus pavoninus,
Pardachirus pavoninus, showing that the maximum and the average
intraspecific values are higher than the minimum distance (Appendix, Fig 11.1);
Soleidae 16S rDNA → all species show the barcode gap except for
Dicologlossa cuneata, which shows the value under the red line
indicating the absence of a gap (Appendix, Fig. 11.2);
Psettodoidei COI → Psettodes bennettii and Psettodes erumei are below the red line in the maximum intraspecific distance vs the minimum interspecific distance (Appendix, Fig. 12.1).
IV.1.3. Primer design.
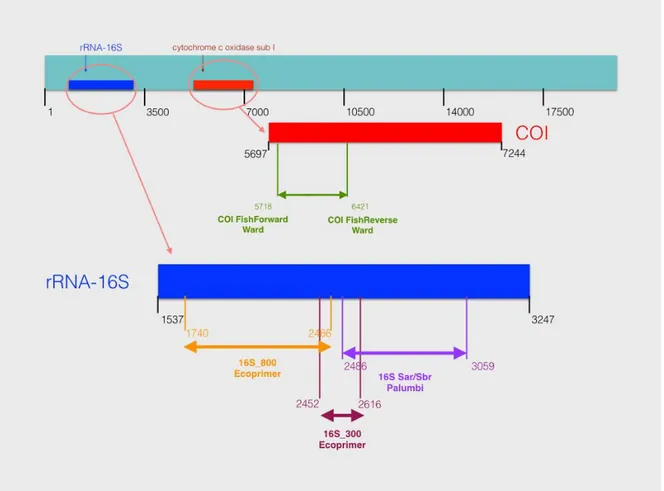
In order to realize an adequate worldwide DNA barcode study, new primers pair have been developed with the ecoPrimers program using two different maximum sequence length parameters for the barcode with theirs own characteristic (Table 4). The partial region of genes amplified by these two specific primer pairs turns out to be in the 16S rDNA gene (Fig. 7):
300 → 16S_300F- GGAGACAGTTAAGCCCTCGT
16S_300R- TACCAAAAACATCGCCTCTT
800 → 16S_800F- CTCGTACCTTTTGCATCATG 16S_800R- GCGATGTTTTTGGTAAACAG
Fig. 6: Chart showing two representative results of barcode gap analysis for flatfish obtained in this study. (a) Family with all species above diagonal (max. intraspecific distance lower than
distance to Nearest Neighbor); (b) family with some species below diagonal (max. intraspecific distance higher than distance to Nearest Neighbor).
In Fig. 7, it can be noted that these primer pairs amplified regions that are different respect to those amplified by the 16S primer pair developed by Palumbi et al. (1991).
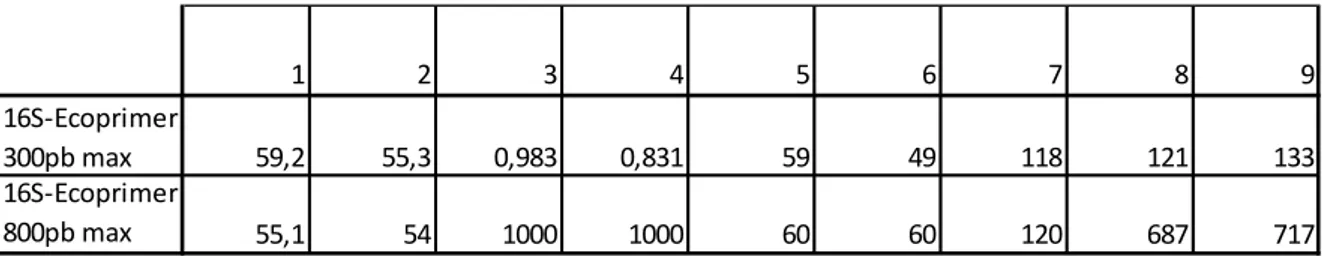
Table 4: The characteristics of each barcode and its associated primers designed, according to ecoPrimer:
1. Tm (melting temperature) of primer Forward, without mismatch 2. Tm of primer Reverse, without mismatch
3. Bc index 4. Bs index
5. Number of taxa of the example dataset properly amplified according to the specific parameters
6. Number of taxa of the example dataset that are properly identified
7. Number of sequence records of the example dataset that are properly amplified according to the specific parameters
8. Minimum length of the barcode in base pairs for the example sequence records (excluding primer)
9. Maximum length of the barcode in base pairs for the example sequence records (excluding primers) 1 2 3 4 5 6 7 8 9 16S-Ecoprimer 300pb max 59,2 55,3 0,983 0,831 59 49 118 121 133 16S-Ecoprimer 800pb max 55,1 54 1000 1000 60 60 120 687 717
IV.1.4. PCR in silico.
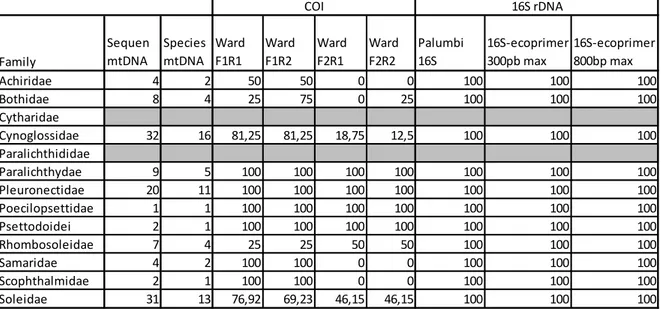
With the newly designed primer pairs, along with the primers already in use for fish barcoding, a PCR in silico has been realized with the program ecoPCR in order to obtain different amplification percentages for each family of the flatfish Order (Table 5).
COI - Ward et al. (2005) → there are four possible combinations for the four primers proposed by these authors, which give different percentage depending on the forward or reverse primers in use (Fig. 8). In Table 5 it is possible to see the various percentage for each family, where most of them
Fig. 7: Location on mtDNA of primers used in fish barcode analysis. A sequence (Acc. Number: NC_030367 sequence) from Lophonectes gallus species of Bothidae, was used to show both the universal primers described by Ward et al. (2005) and Palumbi (1991) as well
as the new primers designed in this study, using Nucleotide BLAST (https://blast.ncbi.nlm.nih.gov)
show a complete success of the amplification (Paralichthydae, Pleuronectidae, Poecilopsettidae, Psettodoidei) independently from the primer combination used. Other primer pairs showed a success of amplification similar to that obtained on the average with the F1R1 and F1R2 combinations, but show lower percentage on the other two F2R1 and F2R2 (Achiridae, Cynoglossidae, Soleidae); Samaridae and Scophthalmidae have 100% in F1R1 and F1R2 but 0% in the other two F2R1 and F2R2; Rhombosoleidae has lower percentage in F1R1 and F1R2 than in the other two F2R1 and F2R2; and Bothidae shows lower percentage in F1R1 and F2R2 than in F1R2 and 0% in F2R1.
16S - Palumbi et al. (1991) → all the families show a full 100% percentage for this pair of primer.
16S – 300L ecoPrimer → all the families show a full 100% percentage for this pair of primer.
16S – 800L ecoPrimer → all the families show a full 100% percentage for this pair of primer.
Table 5: Percentage amplification of the flatfish family for each primer pair proposed.
Family Sequen mtDNA Species mtDNA Ward F1R1 Ward F1R2 Ward F2R1 Ward F2R2 Palumbi 16S 16S-ecoprimer 300pb max 16S-ecoprimer 800bp max Achiridae 4 2 50 50 0 0 100 100 100 Bothidae 8 4 25 75 0 25 100 100 100 Cytharidae Cynoglossidae 32 16 81,25 81,25 18,75 12,5 100 100 100 Paralichthididae Paralichthydae 9 5 100 100 100 100 100 100 100 Pleuronectidae 20 11 100 100 100 100 100 100 100 Poecilopsettidae 1 1 100 100 100 100 100 100 100 Psettodoidei 2 1 100 100 100 100 100 100 100 Rhombosoleidae 7 4 25 25 50 50 100 100 100 Samaridae 4 2 100 100 0 0 100 100 100 Scophthalmidae 2 1 100 100 0 0 100 100 100 Soleidae 31 13 76,92 69,23 46,15 46,15 100 100 100 COI 16S rDNA
Fig. 8: Histogram representing the percentage amplification of the flatfish family for each primer pair proposed.
IV.2. Discussion.
This Thesis has laid the groundwork for an integrative study that consolidate the construction of a DNA barcode reference library, and the design of the most appropriate barcode primer that well discriminate between species. The flatfish taxonomic information described with the COI and 16S rDNA sequences, available in, and downloaded from NCBI, showed that there is a lack in the Pleuronectiformes resource data (Table 3). Presently, the existing marker sequences do not cover the totality of the species for each family, most for the 16S rDNA, lesser for the COI marker. Bothidae, which is the most numerous family including 64 species, has available COI sequences just for 38 species, and for the 16S rDNA they are merely 10. Other families, with high-commercial species, such as Soleidae (Tinti et al., 2000; Cerdà at al., 2008; Boukouvala et al., 2012; Garcia-Cegarra et al., 2013), and Scophthalmidae (Figueras et al., 2016), have, proportionally, more COI and 16S rDNA sequences than the others, indicating their particular economic interest. Generally, this paucity in the genetic information concerning this Order could be attributed to the fact that flatfish do not represent biological model for basic or biomedical research (Cerdà et al., 2013), which is in net contrast to their increasing importance of aquaculture, in order to strongly reduce the trawl demersal fishery (Cerdà et al., 2008).
The results from the barcode gap analysis with the comparisons between the genetic interspecific and intraspecific distances, in order to assume if that particular specie is well characterized (Meyer and Paulay, 2005), showed different scenarios for the various families (Appendix, Fig. 1.1-12.1). In the case where there were no data under the red line in both maximum and average intraspecific vs the minimum interspecific distance, like in Achiridae, Citharidae, Poecilopsettidae, Rhombosoleidae and Samaridae at the COI marker, and Bothidae and Paralichthyidae at the 16S rDNA marker, it does mean that the
marker (barcode) is well representative for those species of the family. As well, the minimum interspecific distance value, i.e. the minimum distance value between all the species belonging to that family, are higher than both average and maximum intraspecific distance value, i.e. distance value of the all sequences for that particular specie, which means that they are well ranked according to other similar studies (Tyagi et al., 2010; Ashfaq et al., 2013; Blagoev et al., 2013). Several families showed inadequate quantity of resource sequence data, like as the case of Achiridae, Cynoglossidae and Pleuronectidae at the 16S rDNA marker, and Bothidae and Paralichthyidae at the COI marker. Scophthalmidae and Soleidae showed this scarcity at both COI and 16 markers, which are under the red line, indicating that the maximum and the average intraspecific, are higher than the minimum interspecific, with the absence of a gap between that specific species from the others (Meyer and Paulay, 2005). The COI marker of Cynoglossidae and Pleuronectidae, which are respectively the second and the first in high number of valid COI sequences, indicate the most numerous data with the overlap between genetic variation in species and the divergence that separate sister species. This means that all these cases seems to be candidate for cryptic species (Blagoev et al., 2013), but this should not be the case, it could be that those specific barcode marker cannot reliably distinguish among those species (Meyer and Paulay, 2005).
The challenge for defining a barcode of good quality consists in finding a quite short enough variable DNA sequence with highly conserved regions (Ficetola et
al., 2010). The new primer pairs created by the ecoPrimers program, which in the
whole mtDNA sequences from Pleuronectiformes, finds the best region for barcode analysis according to Bs and Bc indices, amplify two different partial regions of the 16S rDNA genes. Certainly, they are not the same regions amplified by the primer pairs described by Palumbi (1991), but they show better values in both Bs and Bc indices than the generally used. The primer pair designed with the
300 length parameters have a proportion of taxa that are properly identified (Bs) at 0.831, and a proportion of taxa that are properly amplified according to the specified parameters (Bc) at 0.983, resulting very promising for the taxonomic resolution in a future DNA barcode study. The primer pair designed with the 800 length parameters is much longer and have both Bs and Bc at 1.000, which means 100% of taxa properly amplified (Boyer et al., 2016). The resolution of the barcode markers associated with their PCR primer pairs, tested through a PCR in
silico, in conjunction with the pair of primers already in use, show different
taxonomic coverage. It is demonstrated by the differences observed in the amplification results of the flatfish families (Table 5) between those carried out with the universal marker for animal, the COI (Hebert et al., 2003) and those obtained by each of the 16S rDNA primer pairs. The 16S rDNA primer pairs developed by Palumbi et al. (1991), and the two new primer combinations designed in this work, exhibited a full 100% PCR amplification in silico, proving that for animals mitochondrial rDNA genes provide taxonomic resolution power similar to that of COI, but will allow the design of more conserved primers (Deagle et al., 2014). Previous studies demonstrated that COI metabarcodes provided lower taxonomic coverage than the 16S rDNA metabarcodes of similar length (Tang et al., 2012; Clarke et al., 2014) or than other different mitochondrial regions (van Steenkiste et al., 2014). In silico PCRs consist in selecting within a database the sequences that exhibit similarity with two PCR primers, and the regions that have this match should be localized on the selected sequence in order to allow PCR amplification to force the relative orientation of the matches and the distance between them (Ficetola et al., 2010). Results of the in silico and in vitro PCRs can differ somewhat: ecoPCR is a useful tool for predicting taxonomic amplification and improving the performance of a study, and it could successfully predicted many taxa that would not be amplified by the COI marker (Clarke et
al., 2014). An in vitro analysis could be integrated in the future to validate the
V. Conclusions.
1. The analysis of the mtDNA sequences available for the Pleuronectiformes revealed an overall low coverage of information for the Families of low economic interest, more for the 16S rDNA marker, than for the COI, emphasizing that they do not characterize totally the current state of this Order of ray-finned fish.
2. The analysis of the barcode gaps existing between the intraspecific and interspecific distance in flatfishes in both COI and 16S rDNA regions, showed the existence of several problems in the taxonomical identification of some families, such as Bothidae, Cynoglossidae, Pleuronectidae, Scophtalmidae and Soleidae, in which the intraspecific distance values are higher than the genetic distances between species (interspecific). This pattern denotes possible occurrence of taxonomic uncertainties or errors, which can derive from faults at the moment of a taxonomical classification, based just on morphological analysis of the species. It is important to emphasize the need of tools that will complement their taxonomical classification.
3. The new primer pairs designed, through the ecoPrimer bioinformatic software, elected on the basis of the two indices Bs and Bc, showed greater taxonomic coverage than the COI universal primers, but similar to that of the 16S universal primers decribed by Palumbi (1991). This is an essential complement for future metabarcoding studies.
Acknowledgements.
For the accomplishment of this Thesis, I would like to start by thanking the University of Bologna for giving me the opportunity to have taken part of the Erasmus plus program, without which I would never have been able to live this extraordinary foreign formative experience. Even more I would thank professor Elena Fabbri for supporting and suggesting the life experience that spawned this work. A special gratefulness goes to my thesis relator, professor Fausto Tinti, who supported me in the realization of this study. I would especially like to thank the “Laboratorio de Genética de La Facultad de Ciencias del Mar y Ambientales” of the University of Cadiz, with its manager Laureana Rebordinos Gonzàles, who have welcomed me so kindly.
Most of all, thanks to the professor that have been the creator of this work, who followed and teach me for seven months, Ismael Cross, I’m so grateful to have made his acquaintance.
Thanks to my mom, who always support me, no matter what, representing the most important person in my life; and to my dad, even though he is not always by my side, it is kind of like he did. Thanks to my sister, which is my little cutie who always come running when I need her. Thanks to my friends, Federica, Annalisa, Carmen, Rosanna, Bianca, Fava, Alessio, who make my life so wonderful and full of happiness, and finally, thanks to my love, Andre, because you always cross the sea, to be near to me.
“Happiness can be found in the darkest of times, if one only remembers to turn on the light.” – J.K.Rowling
Bibliography.
Agulleiro MJ, Anguis V, Canavate JP, Martinez-Rodriguez G, Mylonas CC, Cerdà J (2006) Induction of spawning of captive-reared Senegal sole (Solea senegalensis) using different delivery system for gonadotropin-releasing hormone agonist. Aquaculture, 257, 1-4, 511-524
Arif IA, Haseeb AK, Bahkali AH, Homaidan AA, Farhan AH, Sadoon MA, Shobrak M (2011) DNA marker technology for wildlife conservation. Saudi Journal of Biological Sciences 18, 219-225
Ashfaq M, Akhtar S, Khan AM, Adamowicz SJ, Hebert PDN (2013) DNA barcode analysis of butterfly species from Pakistan points towards regional endemism. Molecular Ecology Resources, 13: 832-843
Benard-Capelle J, Guillonneau V, Nouvian C, Fournier N, Le Loet K, Dettai A (2015) Fish mislabeling in France: substitution rates and retail types. Peerj, 2, e714
Bhargava M, Sharma A (2013) DNA barcoding in plants: Evolution and applications of in silico approaches and resources. Molecular Phylogenetics and Evolution, 67, 631-641
Blagoev GA, Nikolova NI, Sobel CN, Hebert PDN, Adamowicz SJ (2013) Spiders (Aranea) of Churchill, Manitoba: DNA barcodes and morphology reveal high species diversity and new Canadian records. BMC Ecology, 13, 44
Boukouvala E, Cariani A, Maes G, Sevilla RG, Verrez-Bagnis V, Jerome M, Guarniero I, Monios G, Tinti F, Volckaert FAM, Bautista JM, Krey G (2012) Restriction Fragment Length Analysis of the Cytochrome b Gene and Muscle Fatty Acid Composition Differentiate the Cryptic Flatfish Species Solea solea and Solea aegyptiaca. Agric. Food Chem., 60, 7941-7948
Boyer F, Mercier C, Bonin A, Le Bras Y, Taberlet P, Coissac E (2016) Obitools: a UNIX-inspired software package for DNA metabarcoding. Molecular Ecology Resources, 16, 176-182
Cerdà J, Mercadé J, Lozano JJ, Manchado M, Tingaud-Sequeira AT, Astola A, Infante C, Halm S, Vinas J, Castellana B, Asensio E, Canavate P, Martinez-Rodriguez G, Piferrer F, Planas JV, Prat F, Yufera M, Durany O, Subirada F, Rosell E, Maes T (2008) Genomic resources for a commercial flatfish, the Senegalese sole (Solea senegalensis): EST sequencing, oligo microarray design, and development of the Soleamold bioinformatics platform. BMC Genomics, 9, 508
Cerdà J, Manchado M (2013) Advances in genomic for flatfish aquaculture. Genes and Nutrition, 8, 5-17
Chanet B (1997) A cladistic reappraisal of the fossil flatfishes record consequences on the phylogeny of the Pleuronectiformes (Osteichthyes: Teleostei). Ann Sci Nat Zooll, 18, 105-117
Chapleau F (1993) Pleuronectiform relationships: a cladistic reassessment. Bulletin of Marine Science, 52, 516-540.
Clare EL, Lim BK, Fenton MB, Hebert PDN (2011) Neotropical bats: estimating species diversity with DNA barcodes. PLoS ONE, 6, e22648
Clarke LJ, Soubrier J, Weyrich LS, Cooper A (2014) Environmental metabarcodes for insects: in silico PCR reveals potential for taxonomic bias. Molecular Ecology Resources, 14, 1160-1170
Coissac E, Riaz T, Puillandre N (2012) Bioinformatic challenges for DNA metabarcoding of plants and animals. Molecular Ecology, 21, 1834-1847
Deagle BE, Jarman SN, Coissac E, Pompanon F, Taberlet P (2014) DNA metabarcoding and the cytochrome c oxidase subunit I marker: not a perfect match. Biol. Lett., 10, 20140562
Ficetola GF, Coissac E, Zundel S, Riaz T, Shehzad W, Bessiere J, Taberlet P, Pompanon F (2010) An In silico approach for the evaluation of DNA barcodes. BMC Genomics, 11, 434
Figueras A, Robledo D, Corvelo A, Hermida M, Pereiro P, Rubiolo JA, Gomez-Garrido J, Carrete L, Bello X, Gut M, Gut IG, Marcet-Houben M, Forn-Cuni G, Galan B, Garcia JL et al. (2016) Whole Genome Sequencing of Turbot (Scophthalmus maximus; Pleuronectiformes): A Fish Adapted to Demersal Life. DNA Research, 1-12
Garcia-Cegarra A, Merlo MA, Ponce M, Portela-Bens S, Cross I, Manchado M, Rebordinos L (2013) A preliminary Genetic Map in Solea senegalensis (Pleuronectiformes, Soleidae) Using BAC-FISH and Next-Generation Sequencing. Cytogenet Genome Res, 141, 227-240
Gibson RN (2005) Flatfishes Biology and Exploitation. Fish and Acquatic Resources Series 9. Blackwell Publishing Company. Iowa, USA.
Harrington RC, Faircloth BC, Eytan RI, Smith WL, Near TJ, Alfaro ME, Friedman M. (2016) Phylogenomic analysis of carangimorph fishes reveals flatfish asymmetry arose in a blink of the evolutionary eye. BMC Evolutionary Biology, 16, 224
Hebert PDN, Cywinska A, Ball SL, DeWaard JR (2003) Biological identifications through DNA barcodes. Proc R Soc B, 270, 313-321
Hebert PDN, Stoeckle MY, Zemlak TS, Francis CM (2004) Identification of birds through DNA barcodes. PLoS Biology, 2, 1657-1663
Hibblen JR, Nieminem LRG, Blasbalg TL, Riggs JA, Lands WEM (2006) Healthy intakes of n-3 and n-6 fatty acids: estimations considering worldwide diversity. Am J Clin Nutr, 83(6), 1483S-1493S
Hoarau G, Boon E, Jongma DN, Ferber S, Palsson J, Van der Veer HW, Rijnsdorp AD, Stam WT, Olsen JT (2005) Low effective population size and evidence for inbreeding in an overexploited flatfish, plaice (Pleuronectes platessa L.) Proc R Soc B, 272, 497-503
Hubert N, Hanner R, Holm E et al. (2008) Identifying Canadian fresh water fishes through DNA barcodes. PLoS ONE, 3, e2490
Jinbo U, Kato T, Ito M (2011) Current progress in DNA barcoding and future implications for entomology. Entomology Science, 14, 107-124
Katoh K, Misawa K, Kuma KL, Miyata T (2002) MAFFT: a novel method for rapid multiple sequence alignment based on fast Fourier transform. Nucleid Acids Research, 30, 3059-3066.71
Kelly RP, Port JA, Yamahara KM, Crowder LB (2014) Using Environmental DNA to Census Marine Fishes in a Large Mesocosm. PLoS ONE, 9, 1, e86175
Kimura M (1980) A simple method for estimating evolutionary rate of base substitutions through comparative studies of nucleotide sequences. Journal of Molecular Evolution, 16, 111-120
Kochzius M, Seidel C, Antoniou A, Botla SK, Campo D, Cariani A, Vazquez EG, Hauschild J, Hervet C, Hjorleifsdottir S, Hreggvidsson G, Kappel K, Landi M, Magoulas A, Marteinsson V, Nolte M, Planes S, Tinti F, Turan C, Venugopal MN, Weber H, Blohm D (2010) Identifying Fishes through DNA Barcodes and Microarrays. PLoS ONE, 5, 9, e12620
Maruyama A, Nakamura K, Yamanaka H, Kondoh M, Minamoto T (2014) The Release Rate of Environmental DNA from Juvenile and Adult Fish. PLoS ONE, 10.1371
Meier R, Kwong S, Vaidya G, KL Ng Peter (2006) DNA Barcoding and Taxonomy in Diptera: A Tale of High Intraspecific Variability and Low Identification Success. Systematic Biology, 55, 715-728
Meyer CP, Paulay G (2005) DNA Barcoding: Error Rates Based on Comprehensive Sampling. PLoS Biology, 3, 12, e422
Millàn A, Gomez-Tato A, Fernandez C, Pardo BG, Bouza C, Vera M, Alvarez-Dios JA, Cabaleiro S, Lamas J, Lemos ML, Martinez P (2011) Gene expression profiles of the spleen, liver, and head kidney in turbot (Scophthalmus maximus) along the infection process with Aeromonas salmonicida using an immune-enriched oligo-microarray. Mar Biotechnol, 13, 6, 1099-1114
Mollet FM, Kraak SBM, Rijnsdorp AD (2007) Fisheries-induced evolutionary changes in maturation reaction norms in North Sea sole Solea solea. Mar Ecol Prog Ser, 351, 189-199
Palumbi S, Martin A, Romano S, McMillan WO, Stice L, Grabowski G (1991) The simple Fool’s Guide to PCR. University of Hawaii, Honolulu, H.I.
Pardo BG, Machordom A, Foresti F, Porto-Foresti F, Azevedo MFC, Banon R, Sanchez L, Martinez P (2005) Phylogenetic analysis of flatfish (Order Pleuronectiformes) based on mitochondrial 16s rDNA sequences. Scientia Marina, 69, 4, 531-543
Portela-Bens S, Merlo MA, Rodriguez ME, Cross I, Manchado M, Kosyakova N, Liehr T, Rebordinos L (2016) Integrated gene mapping and synteny studies give insights into the evolution of a sex proto-chromosome in Solea senegalensis. Chromosoma, 10, 1007
Quintero J, Sotelo C, Rehbein H, Pryde SE, Medina I, Perez-Martin RI, Rey-Mendez M, Mackie IM (1998) Use of mtDNA direct polymerase chain reaction (PCR) sequencing and PCR-restriction fragment length polymorphism methodologies in species identification of canned tuna. J. Agric. Food Chem., 46, 1662-1669
Ratnasingham S, Hebert PDN (2007) BOLD: the Barcode of Life Data System (www.barcodinglife.org) Molecular Ecology Notes, 7, 355-364
Riaz T, Shehzad, Viari A, Pompanon F, Taberlet P, Coissac E (2011) ecoPrimers: inference of new DNA barcode markers from whole genome sequence analysis. Nucleic Acids Research, 39, e145.
Saccone C, DeCarla G, Gissi C, Pesole G, Reynes A (1999) Evolutionary genomics in the Metazoa: the mitochondrial DNA as a model system. Gene 238, 195-210
Schwarzhans W. (1999) A comparative morphological treatise of recent and fossil otoliths of the order Pleuronectiformes. Verlag Dr Friedrich Pfeil, München. Piscium Catalogus: Part Otolithi piscium. Vol 2