POLITECNICO DI MILANO
Scuola di Ingegneria Industriale e dell’Informazione
Corso di Laurea Magistrale in Management Engineering
A PERFORMANCE MANAGEMENT SYSTEM FOR
EDUCATION:
An Action Research Project in Private School
Supervisor: Prof. Tommaso AGASISTI
MSc Dissertation by:
Andrea NORIS Matr. 884711
Acknowledgements
It is to my family, professors and friends that I dedicate this work. Your constant support and your unconditional love have driven me here.
I wish to thank Professor Tommaso Agasisti for the opportunity of working side by side with him. In these months together, your support and your advices have been crucial for my learning and the writing of this thesis.
My gratitude goes to the two schools where I worked for their collaboration and the opportunities of growth I had with them.
Last but not least, my greatest ‘THANK YOU!’ goes to all those people who pushed me to begin this journey. To Francesca and Antonio, who were by my side on the first day of school and never left me. To my three beautiful sisters, I always tried my best to open your way. To Alberto and Gigliola, for all the dinners together. To Franca and Pino, for the beauty of these walls. To my big big family and to all my dearest friends. And, finally, to my soulmate Martina.
Abstract
Performance measurement and management has been researched for decades in the business sector, while there are many potentials for improvement in nonprofit organizations and in particular in schools. Schools are facing an increasing competitivity, which affects their capability of raising funds, so they are moving to a more business-like approach to management.
To improve performances, they usually take models from companies and adapt them to the case of schools. The main problem is that a school has its peculiarities and models for private companies don’t prove always perfectly adaptable to this context.
The aim of this work is to identify the perspectives that affect a school success and that have to be measured. To identify them, the way in which a nonprofit organization creates value and the frameworks used to measure value creation by nonprofits and schools have been analyzed. Furthermore, it is presented the definition of a performance management system in two private schools with an Action Research methodology. The introduction of a PMS requires a process of customization of the framework to the strategy of the school.
The first result of the work is the development of a comprehensive framework that consider five significant perspectives (i.e. strategy and context, resources, activities and projects, results and stakeholders’ satisfaction). In each of this perspective, some families of indicators which it is appropriate to measure in a school have been identified.
A second result involves the introduction of a performance management system in two private schools. The customization of the model strictly depends on the strategy of the school in which it is introduced. The spread knowledge across the organization of what the organization’s strategic objectives are and how each worker can contribute to their achievement are important if it is used a bottom-up approach. Independently from the approach used, the last word has to be of the top management that has a clear view of the big picture. These are the key features for the effective introduction of a performance management system in school.
Keywords: nonprofit organization, school, performance measurement, performance management
Executive Summary
Performance management systems are tools that allow to measure the performances of an organization and ensure the achievement of organizational strategic objectives. Their main aim is to align the efforts of the organization towards improvement and learning in some significant areas. To ensure the achievement of this goal, it is important to make a step from performance measurement to performance management. In performance management, measurement is the beginning of a process that leads to performance assessment and the introduction of corrective actions when needed.
Nonprofit organizations, like most private schools, are facing an increasing pressure to survival that push them to increase their efficiency and effectiveness. The causes of this increasing pressure are the growth of competition, in particular toward the scarce financial resources and an environment that it is changing at an increasingly rapid pace. This is why a business-like approach to nonprofit organizations management is more and more necessary. With this in mind, performance management is of particular importance because it allows continuous improvement and it allows to communicate to the environment the value that a school is delivering in the educational process. In this context, many nonprofit organizations started using tools taken from the business world and adapted to their needs. At the same time, some schools started using performance management systems specifically developed for education, which focused only on educational perspective missing a more comprehensive view on the school performances.
In this work, we have researched the performance management systems used in school to understand which are the relevant perspectives that allow a better school self-assessment. Furthermore, we performed an action research project with two private schools operating in the Milan area. The project is aimed at the definition of a performance management system customized to the objectives of each of the two schools. The comparison of the experiences in the two different organizations allowed the emergence of some best practices for the process that could be replicated in future projects.
In chapter one, the reasons for the research are presented. This work is originated by an increasingly competitive context, which is rapidly changing and from an institutional pressure for the use of quantitative data for the assessment of school performances. The research questions of our work are aimed at the development of a performance management system for schools and its introduction in two real organizations. Moreover, in this chapter are presented the characteristics
deliver its value for the satisfaction of multiple stakeholders. As described above, management is playing an increasingly important role in the nonprofit sectors, by introducing business-like approach in nonprofits. At the end of the chapter, the specificities of the Italian educational sector are described. In particular, the structure of primary and secondary education and the national assessment system (SNV) are introduced. The national assessment system is a project that is stimulating the attention of schools towards the use of data in the assessment of their performances.
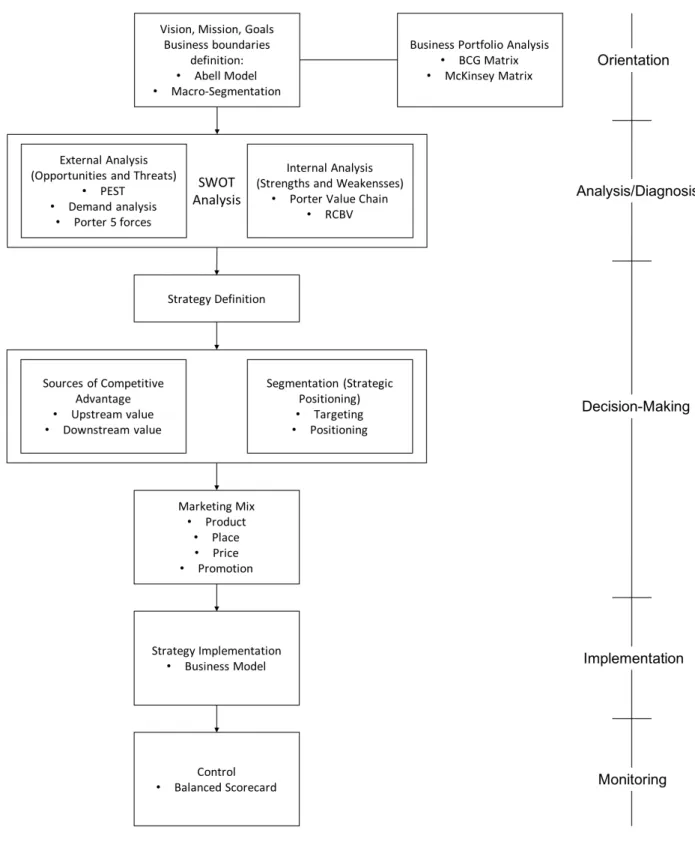
In chapter two, it has been reviewed the literature about the meaning of performance, the performance management systems used in nonprofit organizations and those used in school. After a brief explanation of the methodology used to perform literature review, it is introduced the meaning of performance and how it is created both in business and nonprofit organizations. In particular, an organization’s performance is the result of the strategy plan and its operational development. It is important that an organization measures its performances to understand whether corrective actions have to be implemented and when a discontinuity has emerged, and strategy should be revised. Budgeting is a tool used to deploy the strategy in everyday actions and as a first measurement and assessment of performance.
After an explanation of the main types of indicator (i.e. value-based, accounting, value drivers), some performance management systems are presented and compared in their customization for nonprofit organizations. In particular they are Balanced Scorecard, Performance Prism, European Framework for Quality Measurement and Baldrige National Quality Program.
Some other frameworks and some lists of indicators developed or customized for school are presented and compared later on. They are multiple measures of data, MIUR indicators’ map, Balanced Scorecard for school, European Framework for Quality Measurement for school, School Quality model and School Effectiveness model.
Chapter three presents the theoretical framework developed in answer to the first research question. To answer it, the first three models are used to understand which are the main perspectives to consider for a nonprofit organization: strategy and context, resources, activities and projects, results and stakeholders’ satisfaction. The Baldrige National Quality Program is used to verify the comprehensiveness of the framework and the relevance of the perspectives for school. Also the six models introduced or customized for school are used to verify the relevance and comprehensiveness of the model. Furthermore, they are used to identify families of indicators that
schools should always measure (e.g. a school should always measure the satisfaction four groups of stakeholders: students, families, staff and the whole society).
In chapter four, we present the organizations in which we are introducing our model to answer to the second research question. Organization A is a private school with about 2000 students and 270 educators, while organization B has slightly more than 1000 students and almost 140 educators. The missions, visions and strategies of the two organizations are shown and compared here. Chapter five begins with an explication of what Action Research is. It is a practical way of doing research based on action to satisfy a specific need. It is performed in collaboration with the people who have the need and it generates solutions for them, but only a contextual contribute to theory, which is hardly generalizable. An Action Research is characterized by four phases: plan, act, observe and reflect. In the plan phase, the action researchers and the two organizations had the opportunity to meet to understand the strategy of each organization, identify its needs and program the collaboration. In the act phase, the planned actions were introduced, which means the introduction of the performance management system and the actions needed to operationalize its use (e.g. writing the procedures manual for collection and data entry). In the observe phase, the action taken are observed with a retrospective approach and they are evaluated.
In chapter six, there is the answer to the second research question. In fact, the results of the introduction of a performance management system in two different schools have been analyzed here. In particular the focus goes on the eventual necessity to customize the framework to better fit an organization’s strategy. Furthermore, the list of indicators identified as relevant is shown, analyzed and compared to the families of indicators that should be present in each performance management system for school. Finally, part of the procedure manual is shown, and it is highlighted the development of some questionnaire as tools of measurement for stakeholders’ perception and satisfaction. At the end of the chapter, it is presented a comparison between the performance management systems of the two organizations.
Chapter seven is the final one. First of all, it introduces the last phase of Action Research (reflect), which allows to identify the main achievements of the project and the limitations it has. In particular, this phase has shown two lessons learned: on the one hand, the flexibility of the model developed which can be used for any private school, but it is also applicable for other nonprofit organizations, on the other hand, the path to successfully introduce a performance management system in a private school.
Besides enriching the existing literature, the knowledge created through the action research enables to ease any future applications of this tool to schools.
Executive Summary - ITA
I sistemi di misurazione delle prestazioni sono strumenti che permettono di misurare le performance di un’organizzazione e assicurano il raggiungimento degli obiettivi strategici dell’organizzazione. Il loro obiettivo principale è l’allineamento degli sforzi organizzativi per migliorare ed imparare in aree ritenute rilevanti. Per raggiungere questo obiettivo è importante compiere il passo tra misurazione e gestione delle prestazioni. Nella gestione, la misura è il prerequisito che permette di valutare le performance e introdurre azioni correttive quando opportuno.
Le organizzazioni no-profit, di cui fanno parte le scuole private, stanno affrontando una crescente turbolenza che le spinge a migliorare la propria efficacia ed efficienza per sopravvivere. Le cause di questa turbolenza sono una sempre maggiore competizione, che si orienta in particolare sulle risorse finanziarie e un’ambiente che cambia sempre più rapidamente. Queste sono le ragioni che spingono questo tipo di organizzazioni ad utilizzare approcci simili a quelli delle aziende private. In particolare, la gestione delle prestazioni aziendali è particolarmente importante perché permette il continuo miglioramento e la comunicazione delle performance scolastiche al pubblico esterno. In questo contesto, le no-profit hanno iniziato a usare strumenti delle aziende adattandoli ai loro bisogni. In altri casi, le scuole hanno iniziato ad utilizzare sistemi di misurazione delle performance sviluppati per le scuole, ma che non sono completi nell’analisi delle prestazioni scolastiche.
In questo lavoro, abbiamo fatto una ricerca bibliografica dei sistemi usati nelle scuole per capire quali siano le prospettive rilevanti per una migliore valutazione delle scuole.
Inoltre, abbiamo svolto un progetto di Action Research con due scuole private operative nell’area di Milano. Il progetto ha l’obiettivo di creare ed introdurre un sistema di misurazione delle prestazioni specifico per gli obiettivi di ciascuna scuola. Il paragone delle due esperienze ci ha permesso di estrarre alcune best practices che potranno essere replicate in futuro.
Nel capitolo uno vengono presentate le motivazioni della ricerca. Questo lavoro trova origine nella crescente competitività, nella velocità del cambiamento e nella pressione delle istituzioni per un’analisi quantitativa delle prestazioni scolastiche. Le domande di ricerca riguardano lo sviluppo di un modello di gestione delle performance per le scuole e la sua successiva introduzione all’interno di due scuole reali. Inoltre, in questo capitolo vengono descritte le organizzazioni no-profit, che hanno la particolarità di non ridistribuire i propri profitti, ma devono soddisfare le esigenze di diversi stakeholders. Come descritto precedentemente, la gestione professionale ha un ruolo sempre più
educativo italiano. In particolare, vengono descritti la struttura dell’istruzione primaria e secondaria e il Sistema Nazionale di Valutazione (SNV). Quest’ultimo sta stimolando l’attenzione delle scuole verso una misurazione quantitativa delle performances.
Nel secondo capitolo, è stata analizzata sistematicamente la letteratura esistente sul significato di performance, sui sistemi di gestione delle prestazioni nelle aziende no-profit e nelle scuole. In seguito ad una breve spiegazione della metodologia usata per la revisione della letteratura, vengono spiegati il concetto di prestazioni e come possano essere generate sia in aziende a fini di lucro che in no-profit. Le prestazioni sono infatti il risultato della pianificazione strategica e delle scelte tattiche. È importante che un’azienda misuri le proprie performances per capire se sia necessario attuare azioni correttive e se sia necessario ripianificare la strategia, quando l’ambiente esterno cambia. Il processo di budgeting è uno dei primi strumenti per tradurre la strategia in tattica e per valutare i propri risultati.
Dopo una spiegazione delle principali tipologie di indicatori, vengono presentati e comparati i sistemi di misurazione delle performance per le aziende no-profit. I modelli presentati sono la Balanced Scorecard, il Performance Prism, l’European Framework for Quality Measurement il Baldrige National Quality Program.
In seguito, vengono presentati e confrontati alcuni insiemi di indicatori sviluppati o adattati per le scuole. In particolare, vengono mostrati multiple measures of data, la mappa degli indicatori del MIUR, la Balanced Scorecard per le scuole, l’European Framework for Quality Measurement per le scuole, il modello di School Quality e il modello di School Effectiveness.
Il terzo capitolo presenta il modello teorico sviluppato in risposta alla prima domanda di ricerca. Per rispondere, i primi tre modelli sono usati per capire quali siano le prospettive più importanti di cui tener conto in un’organizzazione no-profit: mission e contesto, risorse, attività e progetti, risultati e soddisfazione degli stakeholders. Il Baldrige National Quality Program viene usato per verificare la completezza del modello e la rilevanza delle sue prospettive per le scuole. Anche i sei modelli introdotti per le scuole vengono usati per verificare completezza del modello e rilevanza delle sue prospettive d’analisi. Inoltre, questi sei vengono usati per trovare le famiglie di indicatori che una scuola dovrebbe sempre misurare (ad esempio una scuola dovrebbe sempre considerare quattro gruppi di stakeholders: gli studenti, lo staff, le famiglie degli studenti e l’intera società).
Nel quarto capitolo vengono presentate le scuole in cui verrà definito il modello per rispondere alla seconda domanda di ricerca. L’organizzazione A è una scuola privata con circa 2000 studenti e 270
docenti, mentre l’organizzazione B ha poco più di 1000 studenti e quasi 140 professori. In questo capitolo vengono presentate e comparate le loro vision, mission e strategie.
Il capitolo cinque si apre con una spiegazione di cosa sia l’Action Research. È un modo pratico di far ricerca, basato sulle azioni necessarie per soddisfare un certo bisogno. Viene svolta in collaborazione con le persone che hanno quel bisogno e le soluzioni vengono sviluppate per loro, ma sono strettamente legate al contesto e difficilmente possono contribuire alla teoria generale. Una Action Research è caratterizzata da quattro fasi: pianificazione, azione, osservazione e riflessione. Nella prima, i ricercatori hanno incontrato le scuole per comprenderne obiettivi strategici e necessità e per programmare la collaborazione. Nella seconda fase, le azioni pianificate vengono introdotte. Nella fase di osservazione, le azioni intraprese vengono osservate con occhio retrospettivo e valutate, raggruppandone i punti importanti.
Nel sesto capitolo viene data risposta alla seconda domanda di ricerca. Infatti, sono stati analizzati i risultati della definizione di un sistema di gestione delle performance nelle due scuole. In particolare, viene rivolta l’attenzione alla necessità di adattare ulteriormente il modello alle necessità della singola scuola. Inoltre, viene mostrata la lista degli indicatori da misurare, che viene comparata con le famiglie di indicatori che dovrebbero essere presenti in ogni scuola. In conclusione, vengono mostrati il manuale delle procedure di misurazione e i questionari sviluppati per misurare la percezione e la soddisfazione di alcuni stakeholders. Alla fine del capitolo, i sistemi delle due organizzazioni vengono confrontati.
Il settimo capitolo conclude il lavoro e introduce la fase di riflessione dell’Action Research, la quale permette l’identificazione dei risultati e delle limitazioni del progetto. In particolare, questa fase ha mostrato due punti emergenti dal nostro lavoro: da un lato la flessibilità del modello sviluppato che è adattabile a qualsiasi scuola privata, ma anche ad organizzazioni no-profit di altri settori, dall’altro, il percorso per introdurre con successo un sistema di misurazione delle performance in una scuola privata.
Oltre a contribuire alla letteratura esistente, la conoscenza generata con questa Action Research permette di facilitare qualsiasi futura applicazione di questo modello nelle scuole.
Table of Contents
A PERFORMANCE MANAGEMENT SYSTEM FOR EDUCATION: An Action Research Project in
Private School ... I Acknowledgements ... V Abstract ... VII Executive Summary ... IX Executive Summary - ITA ... XIII Table of Contents ...XVII List of Figures ... XXI List of Tables ... XXV
1. Introduction, Context and Background ... 2
1.1 Research Motivation... 2
1.2 Research Questions ... 4
1.3 Institutional Background ... 4
1.3.1 Nonprofit organizations and their role in society ... 4
1.3.1.1 Organizations in different sectors ... 5
1.3.1.2 Nonprofit Organization roles ... 7
1.3.1.3 Nonprofit Organization models... 8
1.3.1.4 Nonprofit Organization stakeholders ... 12
1.3.1.5 Nonprofit Organization bottom lines ... 15
1.3.2 Management in Nonprofit Organizations ... 17
1.3.2.1 Strategic Planning in Nonprofit Organization ... 19
1.3.3 Nonprofit Organizations in the Educational System ... 21
1.3.3.1 Educational System in Italy ... 21
1.3.3.2 National Assessment System (SNV) ... 23
1.4 Main Takeaways ... 25
2 Literature Review... 26
2.1 Literature Review Methodology ... 26
2.2 Meaning of Performance for NPOs ... 28
2.2.1 Strategic Decisions ... 28
2.2.1.1 Strategy Formulation Process ... 30
2.2.1.2 Business Boundaries Definition ... 32
2.2.1.3 Business Portfolio Analysis ... 33
2.2.1.4 SWOT Analysis... 37
2.2.1.5 Competitive Advantage ... 38
2.2.1.6 Segmentation, Targeting and Positioning ... 40
2.2.1.7 Marketing Mix ... 43
3.2.1.8 Business Model ... 44
2.2.2 Tactic Decisions ... 46
2.2.2.1 Integrated Approach ... 47
2.2.3.2 Revisiting Business Strategy under Discontinuities ... 56
2.3 Building Performance Management Systems for Nonprofit Organization ... 59
2.3.1 Indicators for Performance Measurement ... 59
2.3.1.1 Value-Based Indicators ... 60
2.3.1.2 Accounting-Based Measures ... 64
2.3.1.3 Value Drivers ... 68
2.3.1.4 Indicators Comparison ... 74
2.3.2 Performance Management Systems ... 74
2.3.2.1 Balanced Scorecard ... 78
2.3.2.2 Performance Prism ... 85
2.3.2.3 European Foundation for Quality Management ... 90
2.3.2.4 Baldrige National Quality Program ... 95
2.3.2.4 Model Comparison ... 101
2.4 Building Performance Management Systems for School ... 102
2.4.1 Multiple Measures of Data ... 103
2.4.2 EFQM Applied to School ... 113
2.4.3 BSC Applied to School ... 114
2.4.4 School Effectiveness and Performance Management... 117
2.4.5 Indicators of School Quality... 120
2.4.6 MIUR Indicators Map ... 122
2.4.7 Model synthesis ... 127
2.5 Main Takeaways ... 130
3 Theoretical Framework ... 132
3.1 Performance Management System for Nonprofit Organizations ... 132
3.1.1 Indicators... 132
3.1.2 Perspective Selection ... 134
3.1.3 Relevance of the Perspectives and Comprehensiveness of the Model ... 140
3.1.4 The Model ... 147
3.2 Performance Management System Customized for Education ... 148
3.2.1 Relevance of the Perspectives and Comprehensiveness of the Model for Education ... 148
3.2.2 Traditional Performance Management Systems for School ... 150
3.2.3 Relevant Families of Indicators ... 156
3.2.4 Performance Management System in School... 163
3.3 Main Takeaways ... 164
4. Context of Research ... 168
4.1 Organization A ... 168
4.1.1 Mission and Vision ... 168
4.1.2 Strategy ... 169
4.1.3 Project with MIP – Politecnico of Milan ... 169
4.2 Organization B ... 170
4.2.1 Mission and Vision ... 170
4.2.2 Strategy ... 171
4.2.3 Project with MIP – Politecnico of Milan ... 171
5. Methodological Approach ... 174
5.1 Action Research ... 174
5.1.1 Comparison between Positivist Science and Action Research ... 176
5.1.2 Action Research Process ... 178
5.2.1.1 Plan phase ... 182 5.2.1.2 Act Phase ... 186 5.2.1.3 Observe Phase... 193 5.2.2 Organization B Experience ... 196 5.2.2.1 Plan Phase ... 196 5.2.2.2 Act Phase ... 198 5.2.2.3 Observe Phase... 200
5.2.3 Action Research Quality Assessment ... 203
5.3 Main Takeaways ... 205
6. Results ... 206
6.1 Performance Management System in Organization A ... 206
6.1.1 The Framework ... 206
6.1.2 The Indicators ... 207
6.1.3 Benefits and Weaknesses of Organization A Model ... 217
6.2 Performance Management System in Organization B ... 219
6.2.1 The Framework ... 219
6.2.2 The Indicators ... 220
6.2.3 Benefits and Weaknesses of Organization B Model ... 228
6.3 Comparison between the two Performance Management Systems ... 229
6.4 Main Takeaways ... 235
7. Managerial Implications ... 238
7.1 Reflect Phase ... 238
7.2 Project Sustainability and Next Steps ... 241
7.3 Conclusions and Limitations ... 242
Bibliography ... 246 Sitography ... 254 Exhibit A ... 256 Exhibit B ... 266 Exhibit C... 276 Exhibit D ... 284 Exhibit E ... 302 Exhibit F ... 306
List of Figures
Figure 1. Motivation of Research ... 4
Figure 2. Internal and External Stakeholders ... 13
Figure 3. School in Italy ... 21
Figure 4. National Assessment System ... 23
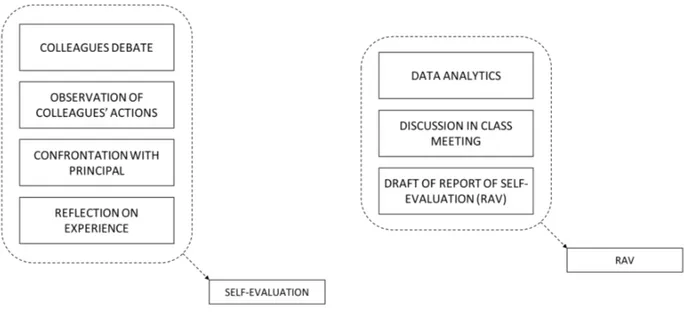
Figure 5. Self-Evaluation ... 24
Figure 6. Relevant Area ... 24
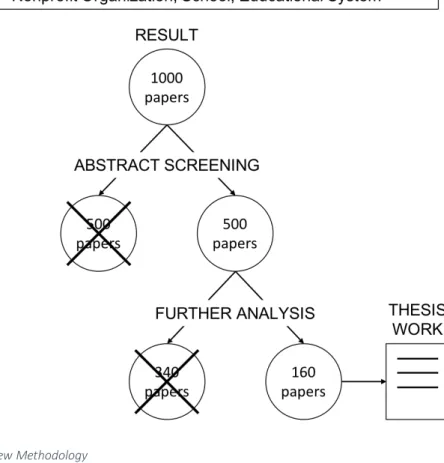
Figure 7. Online Literature Review Methodology ... 27
Figure 8. The 4 Success Factors ... 28
Figure 9. Strategy as a Link between Firm and Environment ... 28
Figure 10. Traditional Strategy Development Process ... 31
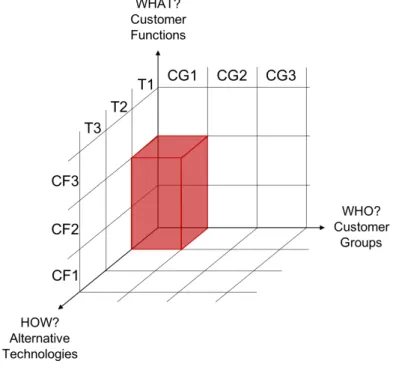
Figure 11. Abell Model ... 32
Figure 12. BCG Matrix ... 35
Figure 13. Nonprofit Portfolio Analysis ... 36
Figure 14. SWOT analysis ... 38
Figure 15. Marketing Mix ... 43
Figure 16. Business Model Canvas ... 44
Figure 17. Adaptive Approach ... 53
Figure 18. Double-Loop Learning... 55
Figure 19. Discontinuity Management... 56
Figure 20. Business Strategic Planning under discontinuity ... 58
Figure 21. Maslow Hierarchy of Needs ... 76
Figure 22. First Generation Balanced Scorecard ... 78
Figure 23. Four Processes ... 80
Figure 24. Example of Strategy Map ... 82
Figure 25. Performance Prism ... 87
Figure 26. EFQM Model ... 92
Figure 27. EFQM Weights ... 94
Figure 30. BNQP Weights ... 99 Figure 31. Multiple Measures of Data ... 104 Figure 32. EFQM in School ... 113 Figure 33. Strategy Map in School ... 114 Figure 34. Integrated Model of School Effectiveness ... 118 Figure 35. BSC in Model ... 136 Figure 36. Performance Prism in Model ... 138 Figure 37. European Foundation for Quality Management in Model ... 140 Figure 38. Baldrige National Quality Program in model ... 141 Figure 39. The Model ... 147 Figure 40. Strategy and Context Families of Indicators ... 157 Figure 41. Resources Families of Indicators ... 158 Figure 42. A&P Families of Indicators ... 160 Figure 43. Results Families of Indicators ... 161 Figure 44. Stakeholders’ Satisfaction Families of Indicators ... 162 Figure 45. The Final Model ... 163 Figure 46. Model Process ... 164 Figure 47. Lewin Action Research cycle ... 179 Figure 48. Phases of the project ... 183 Figure 49. Organization A Project Timeline... 183 Figure 50. Organization A Training plan ... 184 Figure 51. Organization A Workshop Steps... 184 Figure 52. Organization A Workshop Plan ... 185 Figure 53. Organization A Model Definition Plan ... 185 Figure 54. Organization A Actual Workshop Process ... 187 Figure 55. Organization A Model Definition Timeline ... 188 Figure 56. Observations on Seminars ... 194 Figure 57. Observations on Workshops ... 195 Figure 58. Observation on Model Definition ... 196 Figure 59. Organization B Project Timeline ... 197 Figure 60. Organization B Training plan ... 197
Figure 62. Organization B Actual Workshop Process ... 199 Figure 63. Organization B Observations ... 201 Figure 64. . Organization A model ... 206 Figure 65. Example 1 of Indicator Description and Procedure ... 214 Figure 66. Example 2 of Indicator Description and Procedure ... 215 Figure 67. Example 3 of Indicator Description and Procedure ... 216
List of Tables
Table 1. NPO characteristics ... 5 Table 2. Sectors' Comparison ... 6 Table 3. NPO Roles ... 8 Table 4. NPO models ... 11 Table 5. Differences between Philantropic and Corporate Models ... 18 Table 6. BMC building blocks ... 45 Table 7. Budgeted Cash Flow Statement Indirect Approach ... 50 Table 8. Detailed Cash Budget Direct Approach - Inflows Scheme ... 51 Table 9. Detailed Cash Budget Direct Approach - Outflows Scheme ... 51 Table 10. Detailed Cash Budget Direct Approach - Synthesis Scheme ... 51 Table 11. Budgeted P&L ... 52 Table 12. Budgeted Balance Sheet ... 52 Table 13. Flexibility Dimensions ... 70 Table 14. Indicators Comparison ... 74 Table 15. Business-Educational Results Comparison... 100 Table 16. Model Comparison ... 101 Table 17. Demographic Indicators ... 107 Table 18. PROs and CONs of standardized tests ... 109 Table 19. PROs and CONs of performance assessments ... 110 Table 20. PROs and CONs of teacher grading ... 111 Table 21. Staff Results ... 113 Table 22. BSC in School ... 117 Table 23. School Effectiveness Indicators ... 120 Table 24. Indicators of School Quality ... 121 Table 25. MIUR Indicators Map ... 127 Table 26. Model Comparison ... 128 Table 27. Indicators Comparison ... 132 Table 28. Model Comprehensiveness ... 144
Table 30. Bernhardt Families of Indicators ... 151 Table 31. EFQM Families of Indicators... 152 Table 32. BSC Families of Indicators ... 153 Table 33. School Effectiveness Families of Indicators ... 154 Table 34. School Quality Families of Indicators ... 154 Table 35. MIUR Families of Indicators ... 155 Table 36. Strategy and Context Families of Indicators ... 156 Table 37. Resources Families of Indicators ... 157 Table 38. Activities and Projects Families of Indicators ... 159 Table 39. Results Families of Indicators ... 160 Table 40. Stakeholders’ Satisfaction Families of Indicators ... 162 Table 41. Relevant Families of Indicators ... 166 Table 42. Comparison between Positivist Science and Action Research ... 177 Table 43. Comparison between Positivist Science and Action Research ... 178 Table 44. Lewin model phases... 179 Table 45. Choicepoints for quality ... 180 Table 46. Action Research pillars ... 181 Table 47. Indicators' Characteristics ... 186 Table 48. Organization A Example of Questionnaire ... 192 Table 49. Quality Assessment of Action Research ... 203 Table 50. Organization A Indicators ... 208 Table 51. Match of Indicators’ Ranking and PMS for Organization A ... 209 Table 52. Organization A Indicators ... 210 Table 53. Indicators’ Families in Organization A PMS ... 211 Table 54. Indicators’ Metrics ... 213 Table 55. Area of Interest of the Questionnaires ... 217 Table 56. Organization A Results’ Strengths and Weaknesses ... 218 Table 57. Organization B Model ... 220 Table 58. Workshop Indicators for organization B ... 221 Table 59. Indicators’ Families in Organization B mid-management PMS ... 223 Table 60. Organization B Indicators for parents in 0-6 year pre-school ... 224
Table 62. Indicators’ Families in Organization B final PMS ... 227 Table 63. Organization B Results’ Strengths and Weaknesses ... 228 Table 64. Measurement of Staff Satisfaction ... 233 Table 65. Alternative Measurement ... 233 Table 66. Themes Emerged in the Comparison of the two Models ... 234
1.
Introduction, Context and Background
1.1
Research Motivation
A relevant trend of our days is the “greater environmental turbulence and complexity in terms of funding and cross-sectorial partnership arrangements” that is the root cause for the research of higher efficiency and effectiveness in the nonprofit sector (Toepler & Anheier, 2004). To increase them, nonprofit organizations are introducing tools and methodology belonging to the business world.
A second trend concerns the increasing availability of new and better technologies. The evolution of IT is part of the aforementioned trend and it takes form of (Vercellis, 2009):
- An increase in storage and computing capacity of IT. With a subsequent decrease of the cost of computer storage and power
- The development and diffusion of the Internet, which allows to access a wide variety of open data about the environment
For the author, these elements are the base for the growth of business intelligence, which he defines as a set of models and methodologies useful to generate organizational information and knowledge from data.
Bernhardt (2004) synthetizes these trends showing that organizations that gather, analyze and use information about internal and external environments, are better at decision-making and implementing change. Thanks to information gathered, they better define the needs they want to satisfy and, when they change, they stay more focused on the core aspects of the project during its implementation.
Data about value creation are collected to inform the stakeholders of the organization. In particular, data can be used by internal stakeholders to improve their decision-making and by external stakeholders to evaluate the organizational results.
There are many different actors who have a stake in an NPO (e.g. local government, volunteers, customers). A nonprofit has a complex objective function, because it is aiming at their satisfaction and each of them identify different sources of value. How can the organization ensure that it is delivering value to all its stakeholders? Measuring its performance in multiple dimensions, which have to be coherent with the interests of the stakeholders.
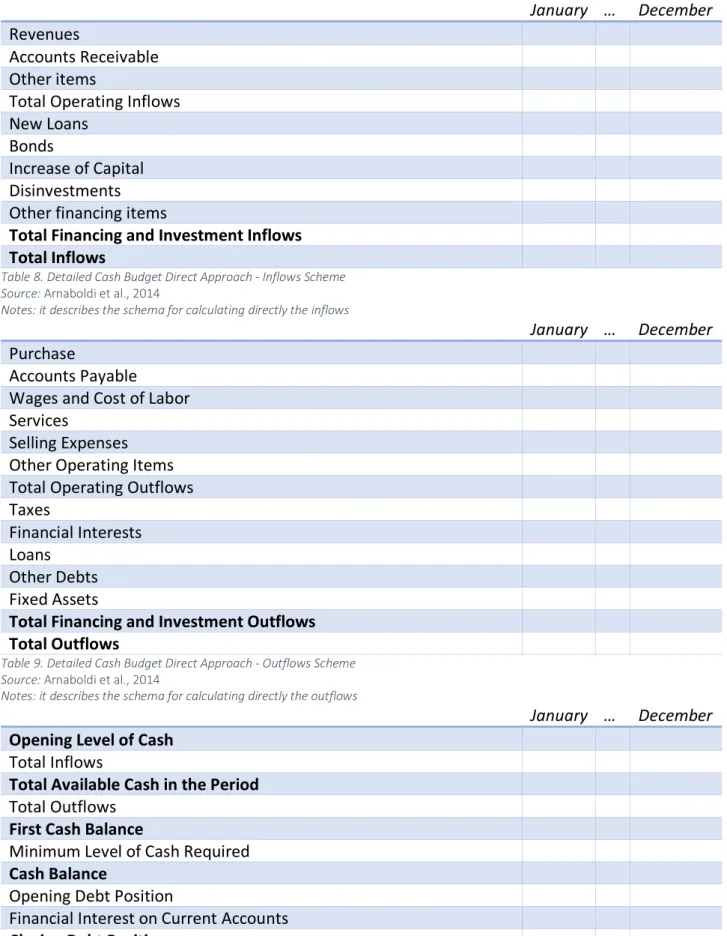
In literature (Arnaboldi, Azzone, & Giorgino, 2014) three families of indicators are identified for an organization to measure its value:
- Value-based indicators are complex measures of the future value of actual organizational tangible and intangible assets
- Accounting indicators are measures based on the financial statements of the organization - Value drivers are operational measures (e.g. number of satisfied beneficiaries) that allow to
forecast future value
Accounting indicators can be calculated after the generation of financial statements, while value drivers can be calculated very often. At the same time value drivers are very narrowly focused on a specific performance, while accounting indicators evaluate value for the whole organization (or at least a function). Measuring both of them allows to exploit the strengths of the ones to mitigate the weaknesses of the others.
The empirical results of these brief considerations show that organizations measure value with a combination of different measures for at least two rationales:
- The accountability to multiple internal and external stakeholders of the organization - The different characteristics of each kind of indicators, which compensate each other A performance management system is the perfect solution for the collection and monitoring of data of different nature in a systematic way. What is a PMS? It is a system that allows to generate a plan, set targets, quantify needed resources and identify risks (planning phase), monitor and measure the performance of an organization (measurement phase), analyze gaps between targets and performances (variance analysis) and introduce corrective actions.
On the one hand, a PMS helps the organization’s stakeholders in the evaluation of results and in decision-making, on the other hand it incentives them to make some specific actions, which are aligned with organization strategic goals.
Bernhardt (2004) observes that data are used by businesses to determine customers’ needs and those businesses that don’t exploit the available data are less likely to be successful. Those who work in the business of education are not so used to the managerial use of educational data. These data, says the author, present clear benefits in the fact that they can be used for previsions that allow to prevent undesirable outcomes and to focus efforts toward the achievement of the goals of the organization.
increasingly using business practices adapted to the specific needs of the organization. Performance management systems are increasingly relevant in school, because of the growing necessity of information to manage the organization and to show to external stakeholder the results achieved. The absence of performance management systems for schools customized to their needs and considering all the relevant perspectives, was the starting point of this research.
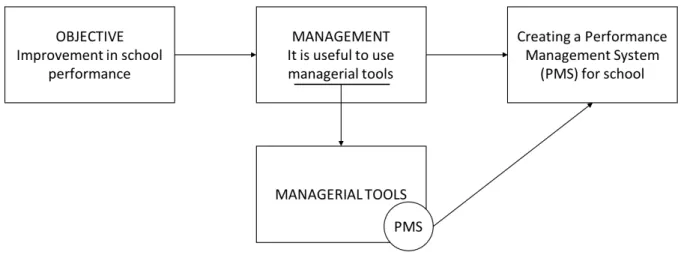
Figure 1. Motivation of Research Source: own figure
Notes: it describes the ojective and the focus of the research project. For improving the performances of a school it is possible to use different managerial tools, this work will focus on PMS
1.2
Research Questions
Q1: What are the key characteristics and dimensions of analysis that a Performance Management System (PMS) should consider in an educational context?
Q2: What are the key implications of the application of the PMS developed at the previous point in two private school in the Milan area?
1.3
Institutional Background
1.3.1
Nonprofit organizations and their role in society
The difference between a private and a nonprofit organization lies in their purpose, in fact the former aims to generate profit while the latter to service delivery (Robert N. Anthony & Herzlinger, 1980). An NPO is subject to the so-called non-distribution constraint, meaning that the profit generated by the organization can’t be entitled to its founders (H. Hansmann, 1987).
organized private entities that manage their own activities without distributing the profits generated. Part of the input of the organization is offered on a voluntary basis.
Characteristic Description
Organized They have an institutional structure that separates them from informal entities
Private They are sperated from the government, hence they are not part of the public sector
Non-profit-distributing They don’t return to owners or equivalent the profit generated in the period
Self-governing They are built to manage and control their own activities
Voluntary They have a non-compulsory nature and a part of the input comes in voluntary form
Table 1. NPO characteristics Source: Salamon & Anheier, 1997
Notes: it describes the main characteristics of an NPO
1.3.1.1 Organizations in different sectors
To better understand the characteristics of an NPO, it is interesting to analyze the differences between nonprofits and organizations belonging to different sectors. In the following table it is presented a comparison between the private, the public and the nonprofit sectors.
To better understand the table, it might be useful to describe the differences between the two kinds of NPO identified by Toepler & Anheier (2004):
- Member-Serving NPO: members are characterized by the voluntary participation to the NPO that delivers club goods based on a solidarity principle. They lack a clear bottom-line and the mission tends to be broad and vague, and members may join and support the organization for diverse set of reasons. The source of financial resources is two-folded, in fact both members and funders provide them.
- Public-Serving NPO: this kind of organizations aim to deliver public value for the benefit of specific groups through the delivery of collective and private goods. They lack a clear bottom-line and the mission tends to be broad and vague, but the absence of heterogeneous members’ needs allows to define clear goals and achieve it through formal structures and hierarchical decision-making. The participation is voluntary (volunteers) or quasi-voluntary (staff).
Business Firm Government Agency
Member-Serving NPO Public-Serving NPO
Objective Profit Social welfare Member
benefits Client group benefits Outputs Private goods Public/Collective
goods Club goods
Collective and Private goods
Distribution
Criteria Exchange Equity Solidarity Solidarity
External orientation External and Indiscriminate (customers) External and Indiscriminate (public and citizens)
Internal and Discriminate (members) External and Discriminate (targeted clients good) Goals Specific and
Clear
Complex and Ambiguous
Complex and
Diffuse Complex and Clear
Structure Formal Formal Informal Formal
Accountability & Control
Owners and Shareholders
Voters through
Elected officials Members Board Decision-making Hierarchical Indirect: democratic Direct: hierarchical Democratic Hierarchical Participants
Quasi-voluntary Automatic/Coercive Voluntary
Voluntary/Quasi-voluntary Motivation Material Purposive Solidaristic Solidaristic/Purposive Resourcing Commercial Coercive (Taxation) Donative Donative/Commercial
Size Large Large Small Medium
Table 2. Sectors' Comparison Source: Toepler and Anheier, 2004
Notes: it describes the differences between the two families of NPOs and private and public sectors. This comparison helps the characterization of an NPO
1.3.1.2 Nonprofit Organization roles
To further analyze the nonprofit sector, Kramer (1981) introduces the four roles that are unique of nonprofit organizations: vanguard, value guardian, advocacy and service provider.
Vanguard
NPOs innovate by experimenting with pioneering approaches, processes or programs in service delivery. In their fields, they therefore serve as change agents. If innovations prove successful after being developed and tested by nonprofits, other service providers, particularly government agencies with broader reach, may adopt them.
Value Guardian
Governmental agencies are frequently constrained – either on constitutional grounds or by majority will – to foster and help express diverse values that various parts of the electorate may hold. Businesses similarly do not pursue the expression of values, since this is rarely profitable. NPOs are thus the primary mechanism to promote and guard particularistic values and allow societal groups to express and promulgate religious, ideological, political, cultural, social and other views, preferences and interests. The resulting expressive diversity in society in turn contributes to pluralism and democratization.
Advocacy
In the political process that determines the design and contours of policies, the needs of underrepresented or discriminated groups are not always considered. NPOs thus fill in to give voice to the minorities and particularistic interests and values they represent. They serve as critics and watchdogs of government with the aim of affecting change or improvements in social and other policies.
Service Provider
Since government programs are typically large-scale and uniform, nonprofit organizations perform various important functions in the delivery of collective goods and services. They can be the primary service providers, where neither government nor the business sector is either willing or able to act. They can provide services that complement the service delivery of other sectors but differ
qualitatively from it. Or they can supplement essentially similar services, where the provision by government or the market is insufficient in scope or not easily affordable.
The following tables synthesizes the main concepts emerged in the previous descriptions and allow to compare the different roles.
Role Description
Vanguard They are the change agents who introduce an innovation, which can be adopted at a broader scale if proved effective
Value Guardian
Government follows majority voting, businesses follow the market, while NPOs can promote and guard particularistic value and allow groups to express and promulgate their preferences and interests
Advocacy NPOs defend minorities’ interests and values when they are underrepresented and discriminated
Service Provider
NPOs deliver services when public and private sectors are not able to do it. They provide services to complement those of other sectors and they substitute government or markets when their provision is insufficient
Table 3. NPO Roles Source: own table
Notes: it describes the roles that an NPO can accomplish in the society
An individual nonprofit organization is rarely able (or willing) to perform all four roles at the same time. The simultaneous research of multiple functions may lead to organizational tensions. To balance it, the managers should focus their efforts toward a primary role.
1.3.1.3 Nonprofit Organization models
From the previous definitions, it emerges that in nonprofit organizations there can be no incentive in pursuing profits as the final organizational objective. The objective of an NPO is thus different from the goal of private companies and it can aim at:
- Intervening to “take up the slack in the system left by the departure of public organizations or services” (Bryson, 1988) or more in general by the absence of the government in delivery of public services or goods
- Creating public value, which is seen as a social mission (Nah & Saxton, 2013)
models show that the government can relate in three different ways with the organization (supplementary, complementary and adversarial) as a consequence of the role that the organization itself wants to undertake in the society (e.g. the government realizes the importance of delivering a service thanks to the action of an NPO – adversarial model – and decide to pay the organization to ensure continuous service delivery – complementary model).
Supplementary Model
The supplementary model explains those situations where a need left unsatisfied by the government is satisfied by an NPO. The provision through private means is inversely proportional to the public expense.
Weisbrod (1977) introduced the concept of nonprofit organizations providing collective goods on a voluntary base. Young (2000) explains the emergence of the voluntary provision of public goods as the emergence of the gap between the individual preferences and the government policy-making. The latter should be an expression of the average individual preference, which, if preferences are not homogeneous between the citizens, will left some of them unsatisfied. Unsatisfied citizens can be either paying and receiving more (or different) public goods than they desire or paying and receiving less. In this latter category individuals are willing to provide additional resources for the creation of public goods through the nonprofit sector.
Voluntary NPO is not the only solution to heterogenous public preferences, in fact there could be substitutes in the private market (Weisbrod, 1977) or it is possible to move to communities with tax levels and public goods provision more in line with the individual preferences (Tiebout, De Schweinitz, Eisner, Strotz, & Bailey, 1956). The problem is that private markets provide imperfect substitutes and mobility is costly. Hence there is room for NPOs to emerge.
Complementary Model
The complementary model includes all those situations in which nonprofits are partners to the government in the delivery of public goods. In this case the relationship between the expenses of the government and those of the NPOs are directly proportional.
L. Salamon (1996) has been the main advocate of this view based on a partnership or contract relationship in which the government pays for public services and the NPO delivers them. Olson (1971) highlights the problem of freeriding when public goods are both nonrival and nonexcludable.
consuming it when provided by other people, creating an inefficiency in the provision of this kind of public goods. A solution can be achieved through social pressure, incentive and coercion. In such a situation the government should decide to finance the public goods.
Coase (1988) analyzes whether an organization (the government in this case) should carry out a further transaction internally or through the market. A part of his explanation is based on the fact that, as the organization grows, the administrative costs will increase until a point where it is cheaper to perform an additional transaction through an outside contract, rather than internally. This explanation seems to fit government provision of public goods, in fact the complaints about costs and inefficiencies of bureaucratic delivery are quite common.
This analysis doesn’t distinguish between private and nonprofit provision. For Young (2000) the government doesn’t contract out only because it is cheaper, but also because it is unable to customize its services, meanwhile nonprofit organizations are well aware of the communities in which they are based, thus the government can use this information asymmetry to improve public good delivery. The second reason identified by Ferris (1993) is about the different incentives for nonprofits that aim to provide a service of quality, while private organizations have a pressure toward reducing costs. Thus, the government will have lower costs for monitoring and contract enforcement. This concept is supported by Steinberg (2003) who says that nonprofit organizations deserve a preferential channel in bidding because they can provide benefits that couldn’t be written into a contract.
Adversarial Model
The adversarial model is realized when nonprofits stimulate the attention of the government to change public policies and to maintain accountability to the public. There is no clear relationship between the resources of the entities, but it is clear that the government tries to influence the behavior of the NPO by both regulating its services to better satisfy the requests and responding to the initiatives of the nonprofit.
Weisbrod (1977) explains that in heterogeneous communities, minorities organize themselves collectively not only to provide public goods, but also to stimulate the attention of the government on their interests. In the author’s basic model, this shouldn’t happen, because the government has no incentives as it simply follows the preferences of the majority of the voters. However, a further analysis of public choice performed by Tullock & Buchanan (1962) shows that organized minorities
can be effective in having their public policy concerns addressed and become important component of the government-nonprofit relationship.
The Weisbrod (1977) model is useful to explain how new public services can be introduced through advocacy: a proposal from a minority will not be immediately adopted by the government, hence the minority will promote the proposal through advocacy with voluntary contributions. The promotional efforts may be effective and ensure pilot funding from the government, which may prove helpful in the concept testing and receive the approval of the majority.
Sometimes it is the government that act in adversarial terms to the nonprofits. Hansmann (1980) explains that NPOs are an efficient solution for the contract failure due to information asymmetry. In information asymmetry, NPOs could exploit consumers unawareness to realize higher profits. So, when should the government intervene? There are two reasons coming directly from the contract failure theory: (1) the government should ensure the enforcement of the non-distribution constraint and (2) NPOs are not a perfect instrument to solve contract failures, as they could violate some of the oversight mechanism that the government use to control private organizations.
Supplementary Complementary Adversarial
Aim
Satisfy a need left unsatisfied by the government
Partnership with government in service delivery
Stimulate the government for needed change
Public Expense Inverse proportion Direct proportion Not specified Raison d’être Gap between citizens’
needs and policy making
Better capacity of delivery of the NPO
Claim for needs of minorities
Why it emerges?
Because some citizens pay less than they would, and they are receiving less than they need
To deliver nonrival and nonexcludable public goods when it is better to outsource the provision for the government
To introduce new public services fostered by minorities
Role Vanguard, Value Guardian and Service Provider
Service Provider Advocacy and Service Provider
Table 4. NPO models Source: own table
1.3.1.4 Nonprofit Organization stakeholders
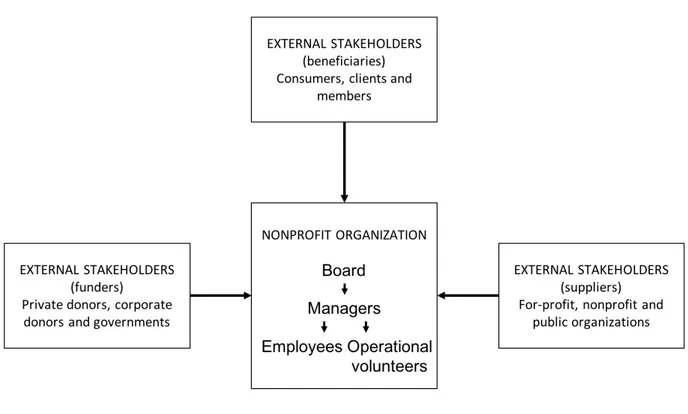
In achieving its objective, performing its role and creating value, nonprofit organizations have to relate with people and organizations who have different roles and own different stake in the company. It is important to deepen the discussion about these actors. In the analysis of the nonprofit sector van Puyvelde, Caers, du Bois, & Jegers (2012) highlight the necessity to include some categories of stakeholders that are specific or perform different roles in NPO:
- Board is the instrument of governance of the nonprofit organization. It represents the company outside its boundaries and it makes sure that the organization fulfills its mission (Anheier & List, 2005).
- Operational volunteers are those individuals for whom the benefits of a volunteering activity are greater than the costs incurred. Benefits can be both private (𝐵") and social (𝐵#), while
the cost incurred is assumed to be only private (van Puyvelde et al., 2012)
𝐵"+ 𝐵# > 𝐶
In particular they are defined operational, because they are involved in the provision of goods and services offered by the organization.
- Funders are those individuals or organizations that give money to the NPO to allow its financial stability and the continuity of its operations.
- Beneficiaries are the clients or member of the nonprofit organization. They are those who consume the goods or services produced.
It is interesting to analyze the relationships that is built between the different stakeholders and the organization. At a macro level it is possible to divide between external and internal relationships between the stakeholders. In the following figure are presented and further analyzed the external and internal relationships with organization’s stakeholders (van Puyvelde et al., 2012).
Figure 2. Internal and External Stakeholders Source: van Puyvelde et al., 2012
Notes: it describes the different internal and external stakeholders of the organization and the relations between them
The external relationships between stakeholders and the company are:
- Funders through their donations become principals who delegate decision-making authority to the organization. In this relationship, accounting costs are usually seen as bonding costs (M Jegers, Frisco, & Style, 2008), but on the other hand Kitching (2009) highlights that higher quality accounting with high-quality auditing increase the funder willingness to donate. A stewardship-based approach assumes that NPOs are motivated to act in the interests of their donors. Kelly (2001) proposes four stewardship strategies to improve the fundraising relationship: reciprocity (demonstrating gratitude), responsibility (acting in a socially responsible way), reporting (informing donors on the destination of their money) and nurturing (continuous relationship building).
- Beneficiaries are principals, for the contract failures due to information asymmetry. A good solution to disincentive to exploit these advantages and act opportunistically for an NPO is to see beneficiaries as principals. H. Hansmann (1986) states that beneficiaries are not moved only by the quality and price of the services and goods, but they have four kinds of incentives: material (private and tangible rewards), solidary (emotional attachment to NPO), purposive (associated with ideology, mission and objectives) and informative (possibility to
obtain information). It is crucial to understand members preferences, since their retention is critical for the NPO survival.
- Other organizations are agents, since NPOs need goods or services provided by other organizations. Tate (2007) highlights how the price of the service impacts on the decision of the NPO to switch the provider of a service. At the same time, managers choose providers that can impact positively on their reputation. van Puyvelde et al. (2012) identify that usually an NPO pays less for a service than a private company because a lower price can be signal of lower quality for the private sector, agents can be altruistic and committed to the mission of the organization and similar goods and services can have different characteristics if provided to an NPO.
The internal relationships between stakeholders analyzed are:
- Board and managers are in a principal-agents relationship. Fama & Jensen (1983) state that NPOs don’t have an efficient board that is incentivized to hold managers accountable and to claim for residual profits. In addition, the objective function of an NPO is complex and the output is difficult to measure (Brown, 2005). van Puyvelde et al. (2012) state that significant agency problems within NPOs can emerge because of the combination of the previously mentioned factors, that could result in an obstacle to the performance measurement and management. The managers of NPOs have different preferences with respect to those of private sector. In fact, they value more their ideals than their financial earnings. This is in line with stewardship theory that requires low control from the board, since managers have a personal incentive to act in the interest of the NPO. From an agency perspective the role of the board is hindered by the managerial power. Ostrower & Stone (2006) identify three categories of variables that affect the balance of power: individual (personal characteristics of board members and managers), organizational (e.g. size and age of organization) and environmental (e.g. governmental funding, external stability). To align the objectives, it is possible to use pay-for-performance systems and implement a selection policy for potential managers.
- Managers-employees are principals-agents, since employees, from an agency perspective, can have direct and indirect influence on managers (Glaeser, 2002). From a stewardship perspective, Preston (1989) shows that NPO’s employees accept lower wages in exchange of the possibility of generating positive social externalities through their work.
- Managers-volunteers are principals-agents, as already explained volunteers have an incentive to work with a company, which is not financial, hence, from a stewardship perspective, their goals are aligned with those of the NPO. At the same time, volunteers need to be controlled by managers to avoid agency problems.
These stakeholders and their relationships have to be analyzed by an NPO to define what value they want to create, how they want to create it and how they want to measure it.
Nonprofit organizations usually have no shareholders, because there is no equity and no ownership, since there is not a profit to be redistributed at the end of the year. van Puyvelde et al. (2012) highlight the fact that it is difficult to identify a principal in nonprofit organization, but there are some key stakeholders that have to be placed at the top of the scorecard for nonprofit organizations (Speckbacher, 2003). They are identified by Soysa, Jayamaha, & Grigg (2013) and Speckbacher (2003) as the volunteers and the customers of the company, but for the authors this latter term includes a wider category in the nonprofit sector, including those who consume the services and goods and those who donate their money to allow the continuity of the organization. In this light, it seems a fair the proposal that of Saxton & Guo (2011) to use new technology to increase downward accountability especially towards customers.
1.3.1.5 Nonprofit Organization bottom lines
As discussed above, nonprofit organization are not interested in creation of profit, hence they can’t use this indicator as a measure of the capacity of the organization to generate value. The way used to measure value has to be coherent with the objectives of the organization, the roles it is trying to accomplish and the stakeholders it is trying to satisfy.
R. N. Anthony & Young (2003) state that all the organizations use resources to produce goods and services (inputs to produce outputs). In private enterprises, profit is a synthesis of both efficiency and effectiveness, while in NPOs it is impossible to find such a synthetic indicator for the management control systems.
The same authors identify multiple characteristics of profit that explain why it is so relevant in the private sector:
1. Synthetic: in a private company the profit shows immediately the difference among the different alternatives for the company itself. In NPOs there is no clear objective-function that allows to find a single measurement with the same characteristic.
2. Quantitative: the easiest evaluations allow a quick and quantitative comparison between costs and benefits. This is possible only when there is a well-defined objective function and the final objective is the profit (not the case of NPOs). In NPOs it is almost impossible to quantitatively analyze the impact of a choice using one single measurement. Each choice implies trade-offs that are difficult to compare and to measure.
3. Aggregative: a good manager is not one who can do best in sales, HR management, resources management, cost savings or fixed capital use. He is the person who is able to conjunctly maximize the management of these features and profit is a synthesis of this capacity of mutual maximization. An NPO will have problem in measuring its overall efficiency and effectiveness with only one indicator.
4. Empowerment: since the final goal in a for-profit company is clear, it is quite easy to break-up this goal to set the goal for each middle manager and so on down the hierarchy. The multiplicity of objectives of an NPO make it difficult to split the objectives, allowing the empowerment of the management, allowing them to reach the objective with the preferred actions.
5. Benchmarking: profit is measured in the same way all across the private sector. This allows the management to compare the company’s performance with the market. In the NPO sector, the definition of the indicators used to measure performance limit the comparability to very few (or none) organizations that decide to disclose their results. In this area, it is relevant the growing interest and regulation toward social reporting.
Drucker (1990) suggests that for the lack of this single bottom line, nonprofit organizations need to be better managed than private organizations, where performance measurement and management is easier. Williamson (1973) suggests prices as a substitute to profit, since they are regulated by the market, the basic medium in transaction costs economics and the economic explanation for the existence of an organization in response to market failures. Anheier (2000) states that it can’t be used, since NPOs are typically price takers, because prices are set by external organizations (i.e. government).
It is not possible to identify a single bottom line for NPOs with the same characteristics of profit. Hence, an NPO will have multiple bottom lines that have to keep into account several factors:
- The dual management structure of many NPOs composed by executive officers in charge of the management and the board in charge of the governance.
- The complex organizational environment in which converge the goals of external stakeholders and the evolution trends of the environment itself (e.g. technological change, new beneficiaries’ groups, government change).
- The interests and needs of beneficiaries that are not always able to reveal their preferences (e.g. people with disabilities, children and older people) and may be unable to pay prices that cover the costs of the organization.
- The importance of agreement on the key values between board, management, staff, volunteers, beneficiaries and other stakeholders.
Anheier (2000) highlights the key importance of NPOs to be professionally managed adapting the management style to the different situations deriving by the various bottom lines.
Furthermore, Toepler & Anheier (2004) disclose the arguments in favor of the measurement and hence management not only of outputs and efficiency, but also of outcomes and effectiveness, moving the focus to the medium/long term perspective and impacts of the NPO actions. This is an additional source of complexity.
1.3.2
Management in Nonprofit Organizations
Many of the reasons for the introduction of business-like management of the organization have already been discussed. Furthermore, the end of the traditional welfare state and the economic recession of the Western states in the 70s moved the focus to more market-oriented approaches in the production and delivery of collective service from the early 80s, while in the East a similar trend was spotted at the end of the socialism in the late 80s. These facts resulted in “greater environmental turbulence and complexity in terms of funding and cross-sectorial partnership arrangements, for example, raised awareness for the need of a more professionalized approach to nonprofit management” (Toepler & Anheier, 2004). Clearly this trend has contributed to the “rapid rise in the number of nonprofits seeking a piece of the limited amount of charitable contributions that has increased competition within the sector and made it harder for many of these organizations to achieve long term financial stability” (H. B. Hansmann, 1980). “As the organization have come under more intense financial and competitive pressures, there have been increasing calls for the adoption of management and governance practices of the private, for-profit sector” (Jeffrey A. Alexander & Weiner, 1998). Robert N. Anthony & Herzlinger (1980) argue that it is not possible to simply borrow control systems from the private sector. In fact, “nonprofit organizations lack the
profit organizations to assess their performance” (Kaplan, 2001). It is also difficult to develop substitutive synthetic measures of performance, because they “have goals that are amorphous and offer services that are intangible” (Forbes, 1998). Herzlinger (1996) argues that nonprofit organizations should disclose nonfinancial quantitative measures of the quantity and quality of services provided, using a collection of indicators, because a single or few indicators wouldn’t be able to resume the capacity of the companies to produce value for the whole society.
In the past, with lower pressure to competitiveness and efficiency, a philanthropic model was adopted, while the change in environment incentivized the development of more business-oriented governance, defined by the corporate model for NPO management. The main differences among the two models are shown in the following table.
Philanthropic Model Corporate Model
Large board size Small board size
Wide range of perspectives/backgrounds More focused perspectives/backgrounds Small number of inside directors Large number of inside directors
Separation of governance and management Active participation of management in board Informal management accountability to the
board Formal management accountability to the board
No limits to consecutive terms for board
members Limited consecutive terms for board members
No compensation for board service Compensation for board service
Emphasis on asset and mission preservation Emphasis on strategic and entrepreneurial activity
Table 5. Differences between Philantropic and Corporate Models Source: J A Alexander, Morlock, & Gifford, 1988
Notes: it describes the characteristics of the corporate model in comparison with philanthropic one
It is not easy to completely shift to a corporate model from a philanthropic, because to fully exploit the advantages many different changes have to happen simultaneously. A hybrid configuration would be possible, but it wouldn’t create significant improvement, so the nonprofits usually go through a systemic governance change.
It is now clear that only part of nonprofit will decide to shift to a corporate model. Jeffrey A. Alexander & Weiner (1998) stress different reasons for this: (1) coordinated changes require both resource commitments and organizational support, (2) government bodies tend to be conservative