Politecnico di Milano
Scuola di Ingegneria Industriale e dell’Informazione
Corso di Laurea Magistrale in Ingegneria Informatica Dipartimento di Elettronica, Informazione e BioingegneriaA framework for comparing open source
sentiment analysis APIs
Relatore: Prof.ssa Letizia TANCA Correlatori: Prof.ssa Maristella MATERA
Ing. Riccardo MEDANA
Tesi di laurea di:
Milica JOVANOVI ´C Matr. 835953 Mirjam ˇSKARICA Matr. 836505
We would like to express our sincere appreciation to our supervisors and our families for all their support. We would also like to extend a special thank you to Prof.ssa Maristella Matera for her time, guidance and understanding.
Abstract
With the rise of social media the way business and customers interact has drasti-cally changed. Business are expected to have a web presence and to produce content in order to engage with their user base on a daily base. In return, the users don’t shy away from leaving feedback, and they leave a lot of it.
Having that in mind, it is easy to see how having an automated way to tell if the user-generated content was negative or positive would provide a lot of value for a businesses. Coincidentally, in recent years a lot of research and advances have been made in the field of sentiment analysis and the efforts yielded a number of tools for predicting sentiment of textual content. This is why we were interested in examining the landscape of open source APIs that provide that functionality.
In this thesis we have built a framework for assessing the performance of some open source APIs for sentiment analysis. The APIs were tested against a dataset of social media content generated by real fashion brands and their user base. Because of the global nature of the fashion industry the APIs were appraised on how well they perform in predicting sentiment of data in original language as well as their English translations. Finally, the framework improved the accuracy of procured sentiment predictions by taking into account the sentimental value of emojis and emoticons found in the data.
Sommario
Con l’avvento dei social media, il modo in cui le aziende interagiscono con i propri clienti `e drasticamente cambiato. Da un lato, le aziende devono necessariamente avere una presenza sul Web e produrre contenuti su base giornaliera in grado di coinvolgere i propri clienti e attrarne di nuovi. Dall’altro i clienti non hanno timore a rilasciare numerosi commenti sul Web e soprattutto nei social media.
In questo scenario, `e semplice intravedere del valore aggiunto per le aziende nei metodi automatici in grado di individuare se i contenuti generati dagli utenti hanno un’attitudine negativa o positiva. Infatti negli ultimi anni molte attivit`a di ricerca sono state dedicate alla analisi del ”sentiment” e hanno portato alla definizione di diversi strumenti automatici per predire il sentiment dei contenuti testuali rilasciati dagli utenti nel Web. Questo scenario ci ha spinto a esaminare con il nostro lavoro di tesi alcune API open source per la sentiment analysis. In particolare, la tesi riguarda la costruzione di un tool per valutare e confrontare API diverse.
Il tool sviluppato ha permesso di applicare le API su un data set di commenti generati da aziende che realmente operano nel settore della moda e da utenti di so-cial media (Facebook, Twitter) che fanno parte della fan base delle aziende. Vista la natura globale dell’industria della moda, le API sono state applicate sia ai post nel loro linguaggio originale, sia alla loro traduzione in Inglese. Infine, tramite il frame-work definito, abbiamo provato come l’accuratezza dell’analisi del sentiment possa migliorare se si tiene conto del significato degli emojis e degli emoticons presenti nei contenuti analizzati.
Contents
1 Introduction 1
1.1 Structure . . . 1
2 State of the art 3 2.1 Need for sentiment analysis . . . 3
2.2 Application of sentiment analysis in various companies and non-profit organizations . . . 4
2.3 Some tools for sentiment analysis . . . 5
3 Sentiment analysis workflow 9 3.1 Sentiment prediction workflow . . . 10
3.2 Determining real sentiment workflow . . . 14
3.3 Evaluation workflow . . . 14
4 Framework 15 4.1 Design . . . 15
4.2 Implementation . . . 16
4.2.1 Database overview . . . 16
4.2.2 Sentiment analysis APIs . . . 23
4.2.3 Sentiment analysis scripts . . . 26
4.2.4 Web server . . . 30
4.3 User interface . . . 32
4.3.1 Web Application UI . . . 32
4.3.2 JSON REST API UI . . . 35
5 Results of APIs comparison 37 5.1 Experimental setting . . . 37
5.2 Results and discussion . . . 39
6 Conclusion 45 6.1 Connecting to mining approaches – Applying clustering in sentiment analysis . . . 46
Contents
6.2 Spam detection . . . 47 6.3 Out of the black box – Training a model . . . 48
Bibliography 50
List of figures 51
Chapter 1
Introduction
Sentiment analysis is the process of computationally identifying and categorizing opinions expressed in a piece of text, especially in order to determine whether the writer’s attitude towards a particular topic, product, etc. is positive, negative, or neutral [Oxford dictionary definition]. How could we in future depend on it? With growth of applying marketing through social media gives us opportunity to seize information about products spread around the media. By analyzing customer’s input about a certain campaign, product or brand’s strategy a company could predict future trends, decrease costs and increase profit.
Within the described context, this project aims to give statistical comparison of open source APIs used to determine sentiment on small dataset consisting of so-cial media posts and related comments in the field of fashion. Given the increasing number of Sentiment Analysis APIs available online, our framework is meant to help developers of new applications, which need to leverage on sentiment services, to compare different resources and choose the one(s) that best fits the application requirements. Four different API endpoints were chosen to be compared on the grounds of them being free, openly available and easily programmatically accessi-ble. However, given its extensibility, the framework can be a useful mean for the comparison in general of sentiment analysis resources – not only the ones that we exploited in the experimental part of our work.
1.1
Structure
• In chapter 2 we will present the reasons for doing sentiment analysis within a company or a non-profit organization, today’s successful solutions and their consequences. We will mention about some of the used commercial solutions, their strengths and weaknesses. Afterwards we will list some open source libraries.
1. Introduction
all the steps of the process from collecting the data, analyzing it with different APIs, determining real sentiment, and finally calculating the APIs accuracy. • In chapter 4 we will give an overview of the Framework we have built with all
its components. We describe the high level architecture of the system and go down to explaining the role of each component. We will finish the chapter by giving a sketch of the user interface.
• Chapter 5 is the part where the project results are supported with interpre-tations. We will present all the statistical results we have obtained after com-paring different APIs.
• Chapter 6 will finalize the purpose of the project and conclude our findings. Also we will mention about future improvements such as doing clustering in sentiment analysis, finding a better spam detection solution and eventually training a model that would accommodate our domain problem.
Chapter 2
State of the art
This chapter describes state of the art of sentiment analysis in social media. Chapter consists of three sections, each of them trying to bring closer the need for sentiment analysis in current market:
1. Need for sentiment analysis
2. Application of sentiment analysis in various companies and non-profit organi-zations
3. Some tools for sentiment analysis
2.1
Need for sentiment analysis
With growth of people’s interaction and company’s advertisements through so-cial media, we have come to the point of realizing that people sharing opinions could help us ”predict” stock market and as well follow current trends by guiding the mar-ket according to the customers input. Customers nowadays have endless ways to interact with brands which could help increasing brand’s awareness, but if not prop-erly analyzed could also lead to obtaining not quite accurate view of customer’s satisfaction. The idea of analyzing customer opinion has driven companies to search for an automated way of understanding content that are customers sharing online. The main network for spreading opinions is social media. Almost every tweet, com-ment, re-share or review gives an information that could guide a company towards better planning, optimizing production and better stock managing. Reason for find-ing an automated way of analyzfind-ing customer’s opinion comes from a problem of big data being generated each day which makes impractical to do manually analysis of each user input. Leaving the big data problem aside, brings us to another issue; being able to beat natural language processing challenge. Reason for making the task harder is that user input might be informal, ”slang like” content with emojis
2. State of the art
, hashtags, full with sarcastic sentences which would lead to unreliable results of analysis.
2.2
Application of sentiment analysis in various
compa-nies and non-profit organizations
Customers engagement through social media can be a valuable asset for com-panies to understand level of acceptability of their products. By finding a way to analyze raw text data and catch the key context from it could potentially result in decrease of stock planning cost and in increase of profit. Over the years many com-panies and nonprofit organizations have started applying some kind of data analysis for this purpose. One of current expanding areas of data analysis is the sentiment analysis, this emerging technique has been applied in various spheres. We will give an insight to few representive examples of successful solutions and their conse-quences. Cathay Pacific as one of leading airline companies started using one of the commercial solutions for sentiment analysis. They have used Brandwatch platform in order to monitor how their campaign hashtag has been mentioned across social media. Specifically, in which connotation the hashtag has been used, what people talk about when putting it in their posts, which has been show in Cathay Pacific Case Study: Using Social Data to Inform a Global Business [1] Aside the sentiment sensing, they are using the platform to identify trends, such as what are people talking about when traveling and where are they traveling to. This kind of data can help them create new ideas for future developments. Nonprofit organizations like American Cancer Society are using sentiment analysis in order to obtain feedback on organized fund raising event. The difference between this kind of sentiment analysis and the one used by Cathay Pacific is that for ACS a model needs to be trained because words used have another connotation for them. For example, words such as “kill” and “cancer” in case of ACM should have positive sentiment. Sensing on social media has shown that ACM had spikes in user engagement every time there was a big fund-raising event. In order to raise more funds, by data analysis they have realized that doing more announcements before, during and after the event could help them to raise people’s awareness about the problem they are fighting against. The ACS also used sentiment analysis to find out what it should be tweeting and posting. For instance, October is Breast Cancer Awareness month and pink ribbons are everywhere. Some NFL teams even wore pink shoes and gloves to raise aware-ness cited in How Starbucks And Other Companies Use Complex Math Algorithms To Read Your Feelings Online[2].
2.3. Some tools for sentiment analysis
2.3
Some tools for sentiment analysis
Commercial solutionsAs every commercial product, basic goal is user satisfaction. Commercial solu-tions provide user with rich customizable, easy to use interfaces for a not so fair price. By paying for the service users, usually medium to large scale companies, receive a platform which contains algorithms for data analysis used as a black box and detailed colorful visualization tools for representing results of the analysis. One of important issues that users wouldn’t deal with, as they would if building their own solutions, is that such platforms usually come with needed infrastructure to support such data intense analysis. Here we will mention few most widely used commercial tools.
Google Analytics
Google Analytics helps you know your audience, find your best content, and opti-mize ad inventory. Providing you with real-time reports of what is happening on your site right now so you can make adjustments fast. Engagement metrics help you see what is working, while integrations with Google and publisher tools like AdSense, DoubleClick AdExchange, and DoubleClick for Publishers (Analytics 360 only) make it easy to package and sell your ad inventory. Google has developed a solution which enables the user to gather data, preprocess it, and train a model using Google Prediction API like a black box.
Sales Force Marketing Cloud solution - Radian6
Most certainly that human sentiment analysis is the most accurate method even if you think how much human differ in their interpretation. Radian6 has introduced an automated sentiment analysis tool which has flexibility to allow users to change the perspective of analysis. If you do real sentiment evaluation manually, you will obtain more accurate results than any other automated tool could give you. Given a simple example, if a user compares different beverage brands, most likely he would rate better the beverage he prefers based on the prevailing taste of it. Radian6 solution will enable the user to do deeper analysis into specific topics via different types of ad hoc analysis Radian6 has given various solutions to fill the gap between marketing and customer satisfaction by using social insights to drive marketing campaigns. By listening, engaging and analyzing data on social media, users are able to create sales plans which could lead to better stock planning.
Brandwatch
Brandwatch Analytics is a web-based platform with monthly subscription basis with different range of packages meeting needs of various company sizes. They search and store date based on users queries on the market. Quite accurately guarantees spam free and duplicate free data. With the gathered data they assure you of optimizing marketing in social media. The platform offers various customizations that could
2. State of the art
accommodate to the needs of the user. By acquiring data every day and providing users with tools to analyze and visualize them, they have convinced a lot of famous brands that Brandwatch is a good tool to help them make data-driven market deci-sions such as Cisco, British Airways and Dell. Good thing about Brandwatch as a commercial solution is that it provides coverage of various data sources, independent of language barrier or data quality. Besides of the coverage advantage, it provides stable analytic tools, as well as visualization tools. It is mostly used by large com-panies that could afford the platform.
Open source solutions
Main benefits of adopting an open source solution are lower costs, in this case using an open source library is free, as well as trend of keeping an open source solution always available because it is usually maintained by a community. For a commercial solution, it could happen that a vendor shuts down his business and with it taking its software out of market. Another major advantages of using an open source solution is that often there is a collaboration between libraries and as well as variety of available solutions. Open source solutions are not bind to changes and up-dates to releases; instead they can be developed collaboratively when functionality is needed. Of course using an open source library can have its down sides, a library or an API call can be limited by number of usages by day or by accepted amount of data it can receive. Thus implicates that these kind of solutions are not setting up an infrastructure that could handle data-intensive analysis and are usually used for educational purposes.
Natural Language Toolkit
Natural Language Toolkit is an open source platform for building programs which work with textual data. It is equipped with various libraries for text processing which provide tokenization, tagging, stemming and handy wrappers around NLP libraries. NLTK has a very detailed documentation which can guide a developer in building an application that suits his needs. Highly recommended for people that feel free working in Python.
Stanford’s CoreNLP
Provide set of tools written in Java for purpose of natural language processing. Initially was built to work only with English language, but latest releases support languages such as Arabic, Chinese, French, German and Spanish. It is an integrated framework easy to use for language manipulation on raw inputted text. The result it gives after initial analysis is a good starting point for building application with domain-specific problems. Besides low level natural language processing, it contains as well some traces of deep learning algorithms.
2.3. Some tools for sentiment analysis
The text-processing is an open source API which returns simple JSON over HTTP web service for text mining and natural language processing. It is an API which supports speech tagging, chunking, sentiment analysis, phrase extraction and named entity recognition. As an open source solution it has its limitations, such as 1000 calls per day per IP. To get the sentiment of a text, users should do an HTTP re-quest with form encoded data containing text to analyze. As a response, users will receive a JSON object with a label marking the sentiment (can be pos as positive, neg as negative or neutral) and a probability for each label.
Searching around Internet about sentiment analysis has shown us that each of the available solutions has it’s strengths and weaknesses. Seeing that APIs behave differently depending on the data or domain applied on, we came to an idea to build a framework that gives an overview of the open source APIs, concluding their advantages and disadvantages, as well as representing comparison between them. Building a framework that is able to invoke different APIs and show sentiment results with statistical representation of accuracy has been a good indicator of choosing an appropriate solution for a specific problem domain.
Chapter 3
Sentiment analysis workflow
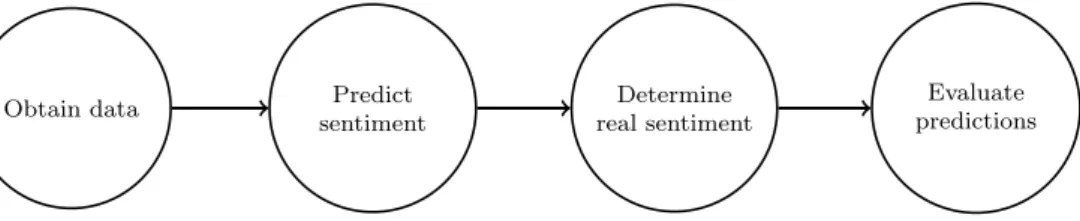
This chapter describes the workflow used to analyze the sentiment of social media comments and their corresponding posts. In order to outline the workflow, a top down approach was taken where each subsequent section provides an ever more detailed insight into a particular step of the workflow. The big picture is shown in Figure 3.1 and consists of four parts:
1. Obtaining data
2. Sentiment prediction using an API 3. Determining real sentiment of data 4. Evaluation of that API’s performance
The first part is the simplest one and as such doesn’t merit a more detailed recounting other than mentioning that we were provided with a small sample dataset which, most relevantly, contained about 6000 comments.
In the sections that follow, each of the three remaining parts are broken down into conceptual steps describing the methodology used whilst not cluttering it with too many implementation details. Additionally, it is interesting to note that the first and third steps are performed only once. This means that, for each new API we want to use, the workflow for sentiment analysis effectively consists of only steps 2 and 4, namely sentiment prediction and performance evaluation.
Obtain data Predict
sentiment
Determine real sentiment
Evaluate predictions
3. Sentiment analysis workflow
3.1
Sentiment prediction workflow
Let’s assume we have access to an API for sentiment prediction. By having access we mean being able to programmatically call the API with a text payload and have it return a prediction in some data format. The end goal is to analyze sentiment of all the comments in our sample dataset and aggregate the obtained data on a per-post basis in order to infer whether it was positively or negatively received, or even if it had no emotional impact whatsoever. And we want this to be done automatically, practically with a push of a proverbial button. By automatizing the process, it is easy to see how it can derive value for possible future ventures that extend far beyond our modest 6000 comment database.
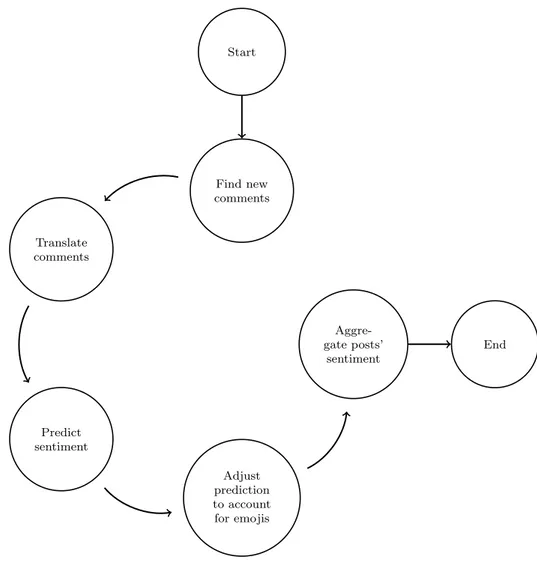
Find new comments Translate comments Predict sentiment Adjust prediction to account for emojis Aggre-gate posts’ sentiment Start End
Figure 3.2: Sentiment prediction workflow
Figure 3.2 shows the main concepts that build up the workflow of our sentiment analysis. Since the term workflow can be a bit ambiguous, let us clarify exactly what we mean by it. In our case it is simply a python script named automated
3.1. Sentiment prediction workflow
sentiment analysis.py that can be run manually, or scheduled to run on a server at desired times/intervals. Sections that follow will explain each step in more detail and will also provide motivation for some, perhaps not so obvious, choices.
Find new comments
This part is quite straight forward. Once run, the script scans the database looking for comments that don’t have a sentiment record attached to it and inserts one. The inserted rows’ sentiment columns default to a json shown in Listing 3.1. The reason for this particular choice of json and for using the json format in the first place is discussed at length in Section 4.1. Also, notice the use of the plural form-sentiment columns. This way we are able to store form-sentiment predictions from each API we planned on using in their own columns.
{ " s e n t i m e n t _ l a b e l " : " ", " s e n t i m e n t _ s t a t s " : { " p o s i t i v e " : 0, " n e g a t i v e " : 0 " n e u t r a l " : 0 } }
Listing 3.1: Default sentiment json
Translate comments
To reiterate, our dataset consists of real comments to posts published by actual fashion brands. Since fashion truly is a global industry, the posted comments are in a myriad of different languages. In our case the number of different languages is somewhere above of 70. This provided us with a challenge because most sentiment analysis related APIs handle (well) only content written in English. And the very few that offer support for other languages do so just for a handful of them. This is especially true for the open source variety of APIs that were used for the purposes of this thesis.
Even thought the rationale for using comments’ English translations seems to hold, we wanted numbers to back up our claims. In other words, we wanted to quantify just how much worse the APIs would perform if we fed them comments in their original language as opposed to English. So for two out of four APIs used, we analyzed both, the content in original language and the English language. The results are examined in Chapter 5, but in short, they are in accordance to what we expected.
3. Sentiment analysis workflow
This brings us to another caveat. We’ve just coupled the quality of sentiment predictions with the quality of the translations. After all, the prediction can only be as good as the translation. Since we were trying to evaluate performance across mul-tiple open source APIs, we wanted the best translations possible to try to mitigate this problem. Hence we opted for what we felt was the current industry standard, Google’s Translate API1. It is worth noting that this is the only step we hadn’t taken the open source option but used a free trial period instead to do a one-off translation of our entire dataset.
Predict sentiment
For each unanalyzed comment a we call a specific API requesting a sentiment prediction of the comment’s translated content2. If no API is specified the script sequentially makes requests to all defined. Since each API’s response is in a slightly different format, the response is parsed to adhere to the json definition shown in Listing 3.1. After which, the API’s sentiment column for that particular comment is updated with the received (and parsed) values.
Adjust prediction to account for emojis
In this day and age everybody uses emojis and emoticons, and a lot of it. To disambiguate the two terms, here are the definitions offered by the Oxford dictionary:
emoji / I"m@UdZi /
origin (1990s) Japanese, from e=picture + moji=letter, character noun a small digital image or icon used to express an idea or emotion
emoticon / I"m@UtIk6n /
origin (1990s) blend of words emotion + icon
noun a representation of a facial expression such as a smile or frown, formed by various combinations of keyboard characters and used to convey the writer’s feelings or intended tone
To put it simpler, the difference is between symbols and <3. The former being an emoji and the latter being an emoticon. But we digress, the point was to emphasize the very emotional nature and motivation behind using these symbols in a text, comment or post. Having an emoji or an emoticon mixed with text can drastically change our perception of the sentiment behind it. Take these three simple comments:
1
https://cloud.google.com/translate/v2/translating-text-with-rest
2As mentioned in the previous section, there are two API’s for which we requested sentiment
3.1. Sentiment prediction workflow
I read that book I read that book <3 I read that book
Unless we happen to know the person that wrote the the first comment, its content in plain text doesn’t really codify enough information for us to make a judgment call weather or not this person liked or disliked that book. On the other hand, the other two comments are quite unambiguously positive. That one little symbol made all the difference in how we perceive the text that preceded it. Unfortunately, all APIs that we tested would ignore these descriptive symbols, so we decided to write up a very simple algorithm based on the Emoji Sentiment Ranking3 which came to be as a part of the Sentiment of emojis study[3]. The algorithm will be described in more detail in Section 4.2. But in short, the algorithm tweaks the sentiment of comments which contain emojis or emoticons. Then it stores the recalculated result in a separate database table so it doesn’t clobber the original data. This allows us to both fine tune our algorithm and to compare the predictions that took the sentimental value of emojis into account to those that didn’t.
Aggregate posts’ sentiment
Everything leading up to and including this point was done automatically by running the automated sentiment analysis.py script. Finally, all that is left for the script to do is to aggregate the sentiment data for each post. This boils down to counting how many sentimentally negative, neutral or positive comments does a post have. The results of this data aggregation are stored in a json format as shown in Listing 3.2. Perhaps the most informative field there is the sentiment label. It is essentially one API’s appraisal of how well (or badly) had the public received a published post. Of course, this aggregation is done for each post and API separately. So, for example, according to one API a post might have been overall positively received, while data coming from another API might yield a different conclusion. Sections 3.2 and 3.3lay out workflows for assessing API’s reliability.
{ " s e n t i m e n t _ l a b e l " : " p o s i t i v e ", " s e n t i m e n t _ s t a t s " : { " p o s i t i v e " : 38, " n e g a t i v e " : 2, " n e u t r a l " : 9, " t o t a l " : 49 } }
Listing 3.2: Example of a post sentiment json
3
3. Sentiment analysis workflow
3.2
Determining real sentiment workflow
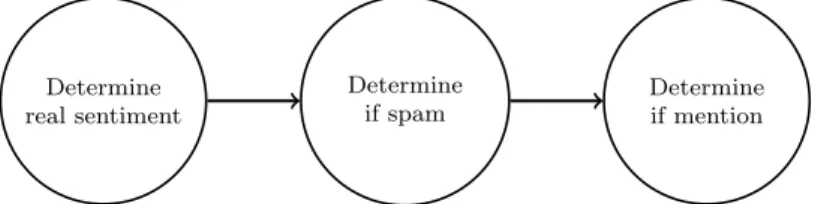
In order to answer the question weather or not the obtained sentiment predic-tions are any good and to determine if any one API outperforms all others- we need sentiment data that we hold true and we need it for each comment. That way we have a real (true) sentiment record to compare against. Since the only state of the art sentiment analyzing machines at our disposal were the two humans writing this thesis, we decided to read all the comments one by one and input our sentiment predictions by hand. Thus, from this point on, when ever we refer to real sentiment we mean our own judgment of the sentiment behind the comment. To make this manual process a bit easier for ourselves, we’ve made it possible to input or modify sentiment for each comment in multiple ways. It can by done via the command line, e.g by doing a curl call to the framework’s REST API or via its the graphical user interface. But easiest and most efficient way is to run the update real sentiment.py script. The script allows you to specify a range of comments which you want to analyze using command line arguments. The script then sequentially fetches speci-fied comments, prints out their ids, content and English translations and asks for 3 pieces of information as shown in Figure 3.3. It requests a sentiment prediction to be input, weather or not one assesses this comment to be spam and if there was a mention of another user in the comment in question. We were interested to have the two last pieces of intelligence mainly out of curiosity to see how API’s would have performed if the dataset was clean from these types of comments, however, they are also a good basis for future extensions of our work.
Determine real sentiment Determine if spam Determine if mention
Figure 3.3: Determine real sentiment workflow
3.3
Evaluation workflow
Now that we have the real sentiment of each comment as well as sentiment predictions, we can evaluate the performance of each individual API. Running the evaluate api performance.py will calculate accuracy, precision and recall for each API unless a specific one is specified as an argument.
Chapter 4
Framework
4.1
Design
The most prevalent web development paradigm in the recent years has to be designing software components as APIs. The term API is short for Application Programming Interface and is essentially an interface to retrieve and manipulate data. But unlike a graphical user interface (from now on GUI) whose end users are people, API’s users are other applications. Having a single point of entry which abstracts and manages resources in a consistent manner provides lot of benefits in terms of maintainability, automation and future development.
That is why we took the API-first approach when structuring our sentiment analysis framework. The idea was to build a RESTful API on top of the provided sample database and use it for multiple purposes, namely, a web app, API’s GUI or any scripts and third party applications that might need to access database records. However, during one development iteration the requirements somewhat changed. It became clear that the collection of scripts used for sentiment analysis (see Section 3.1) would provide more value if their data requests didn’t go through an API but by making calls directly to the database. Even though this decision might seem to counter all previously listed benefits, it was important to realize that our efforts weren’t an independent endeavor but a possible extension of our university’s existing framework for managing social media accounts. Considering the redefined context in which we were developing, it made sense to design the collection of server-side scripts so that they depend only on the specifics of the provided database schema. This way, should our attempts yield satisfactory results, the collection of scripts could easily be deployed and reused in the university’s existing framework. Our goal then became twofold, first designing an API-independent script bundle and second designing an API-dependent web application and its GUI. The purpose of the two latter services was mainly to aid development and to have results presented in an intuitive manner. Finally, a high level design of the system is shown in Figure4.1.
4. Framework Database Sentiment Analysis Scripts Google Translate API Sentiment APIs Business Logic API RESTful API GUI Web Application Third Party Applications web server
Figure 4.1: Sentiment analysis framework
4.2
Implementation
The break-down in Section 4.1 can be implemented in any number of ways. This section focuses on its implementation details and is divided into four parts following the organization presented in Figure 4.1: database overview, sentiment analysis APIs and script collection and web server overview. Since choices made in either of those parts regarding structure and technology are mutually dependent, here we’ll define the technologies used in order to make the sections which follow more intelligible:
DBMS: MySQL 5.5.3+ Web framework: Django 1.9
Sentiment analysis scripts: python 2.7.+
4.2.1 Database overview
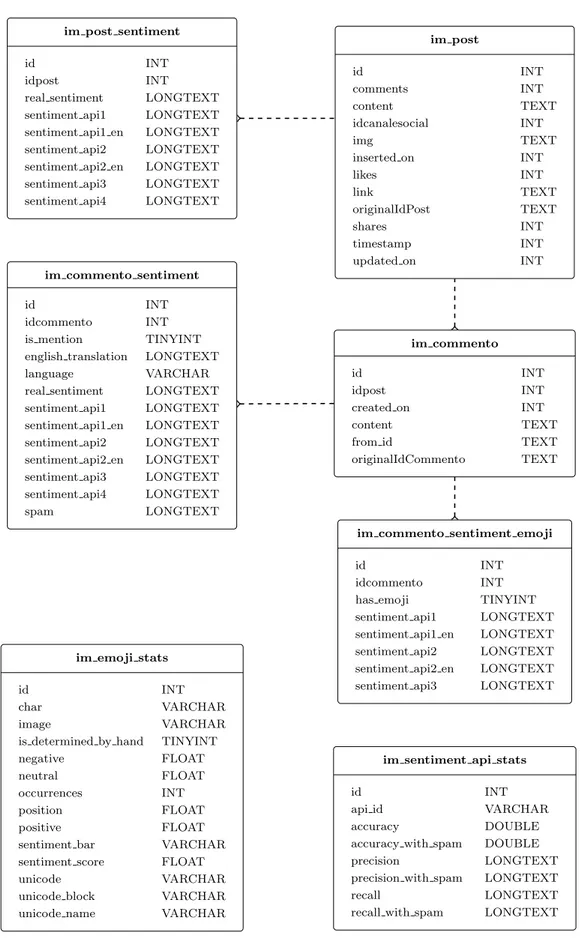
All the data acquired or generated is stored in a single relational database called sentiment db. The logical view of the database is shown in Figure 4.2. In favor of clarity, parts considered inconsequential to sentiment analysis processes are not disclosed. Those include, but are not limited to: django sessions, brands etc.
4.2. Implementation im post id INT comments INT content TEXT idcanalesocial INT img TEXT inserted on INT likes INT link TEXT originalIdPost TEXT shares INT timestamp INT updated on INT im post sentiment id INT idpost INT
real sentiment LONGTEXT sentiment api1 LONGTEXT sentiment api1 en LONGTEXT sentiment api2 LONGTEXT sentiment api2 en LONGTEXT sentiment api3 LONGTEXT sentiment api4 LONGTEXT
im commento id INT idpost INT created on INT content TEXT from id TEXT originalIdCommento TEXT im commento sentiment id INT idcommento INT is mention TINYINT
english translation LONGTEXT
language VARCHAR
real sentiment LONGTEXT sentiment api1 LONGTEXT sentiment api1 en LONGTEXT sentiment api2 LONGTEXT sentiment api2 en LONGTEXT sentiment api3 LONGTEXT sentiment api4 LONGTEXT
spam LONGTEXT
im commento sentiment emoji
id INT
idcommento INT
has emoji TINYINT
sentiment api1 LONGTEXT sentiment api1 en LONGTEXT sentiment api2 LONGTEXT sentiment api2 en LONGTEXT sentiment api3 LONGTEXT
im sentiment api stats
id INT
api id VARCHAR
accuracy DOUBLE
accuracy with spam DOUBLE
precision LONGTEXT
precision with spam LONGTEXT
recall LONGTEXT
recall with spam LONGTEXT im emoji stats
id INT
char VARCHAR
image VARCHAR
is determined by hand TINYINT
negative FLOAT
neutral FLOAT
occurrences INT
position FLOAT
positive FLOAT
sentiment bar VARCHAR
sentiment score FLOAT
unicode VARCHAR
unicode block VARCHAR
unicode name VARCHAR
4. Framework
As previously stated, we have extended and built our framework on top of a pre-existing relational MySQL database schema which came with a set of specifications that were adopted and applied to sentiment db. Using a version of MySQL greater or equal to 5.5.3 was a hard constraint because in that release MySQL introduced support for uft8mb4 encoding. As opposed to uft8’s three bytes per character maximum, uft8mb4 uses a maximum of four bytes per character making it fully compatible with uft8 and, most importantly, able to correctly encode and store emojis. It is worth mentioning that only two data tables that were a part of the original database were used in analysis and those are im commento and im post.
For the sake of completeness, following tables contain details and field descrip-tions of used data tables.
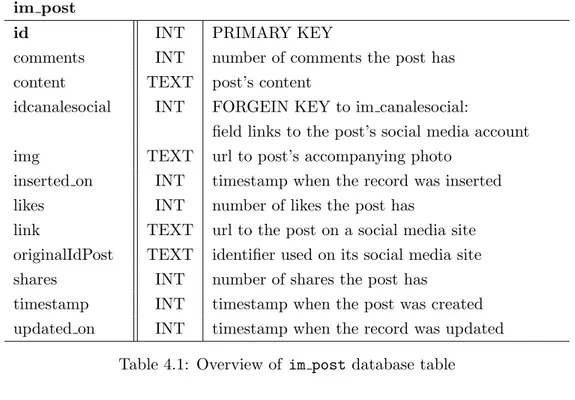
im post
id INT PRIMARY KEY
comments INT number of comments the post has content TEXT post’s content
idcanalesocial INT FORGEIN KEY to im canalesocial:
field links to the post’s social media account img TEXT url to post’s accompanying photo
inserted on INT timestamp when the record was inserted likes INT number of likes the post has
link TEXT url to the post on a social media site originalIdPost TEXT identifier used on its social media site shares INT number of shares the post has
timestamp INT timestamp when the post was created updated on INT timestamp when the record was updated
Table 4.1: Overview of im post database table
im commento
id INT PRIMARY KEY
idpost INT FORGEIN KEY to im post: field links to the comment’s post
created on INT timestamp when the comment was created content TEXT comment’s content
from id TEXT commentator’s id
originalIdCommento TEXT identifier used on its social media site Table 4.2: Overview of im commento database table
4.2. Implementation
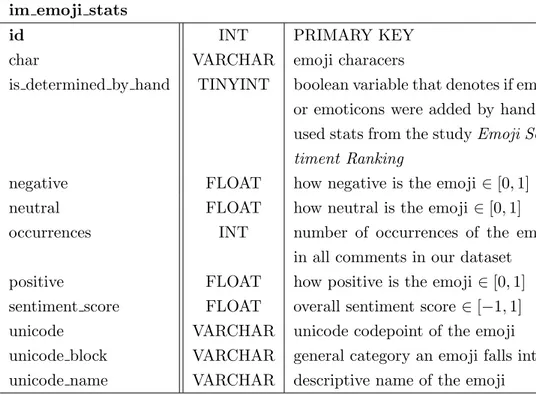
As mentioned, emojis play a big role in determining sentiment of a comment. Since none of the APIs took them into account, we used sentiment scores from Emoji Sentiment Ranking1 published as a part of a sentiment analysis study[3], and imported them into the database table im emoji stats whose details are shown in Table 4.4. However, not all emojis or emoticons that occurred in our data set were included in the study (e.g. :) :D ). Which means they had to be manually inserted in the db. Their sentiment scores were determined by finding a similarly defined emoji and making the assumption that they had the same, or at least similar, sentiment. For example, green book’s ( ) sentiment score was used in place for the missing blue book emoji ( ). An example of missing inserted emojis and their similar counterparts can be found in Table 4.3
Inserted icon Similar icon Sentiment score Unicode name 0.491 Blue book
0.72 Slightly smiling face 0.491 Dark sunglasses :-) :) =) 0.657 Smiley face
:* 0.71 Kiss face
<3 0.657 Heart
Table 4.3: Example of inserted emojis into im emoji stats database table
im emoji stats
id INT PRIMARY KEY
char VARCHAR emoji characers
is determined by hand TINYINT boolean variable that denotes if emoji or emoticons were added by hand or used stats from the study Emoji Sen-timent Ranking
negative FLOAT how negative is the emoji ∈ [0, 1] neutral FLOAT how neutral is the emoji ∈ [0, 1] occurrences INT number of occurrences of the emoji
in all comments in our dataset positive FLOAT how positive is the emoji ∈ [0, 1] sentiment score FLOAT overall sentiment score ∈ [−1, 1] unicode VARCHAR unicode codepoint of the emoji unicode block VARCHAR general category an emoji falls into unicode name VARCHAR descriptive name of the emoji
Table 4.4: Overview of im emoji stats database table
1
4. Framework
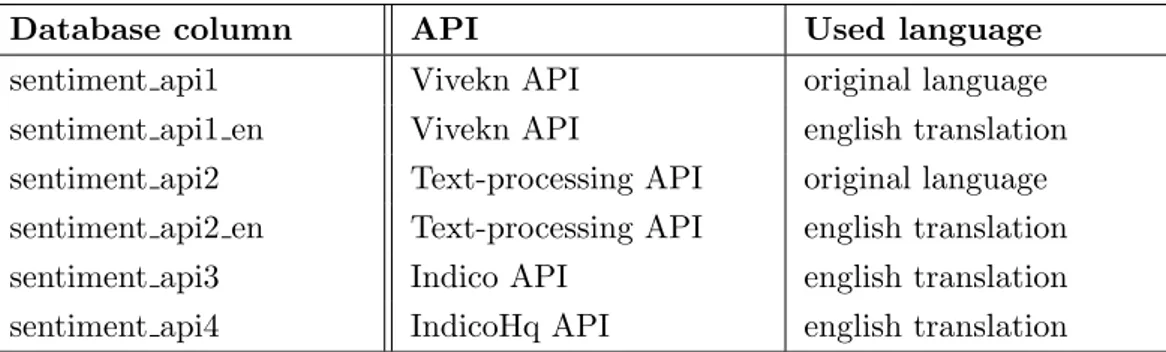
To keep Tables 4.6, 4.5, 4.6 and 4.7 concise we’ve bundled descriptions of all sentimen api columns together. Each of those columns contain sentiment predictions of a specific API used. The (column, AP I) mappings can be found in table below.
Database column API Used language sentiment api1 Vivekn API original language sentiment api1 en Vivekn API english translation sentiment api2 Text-processing API original language sentiment api2 en Text-processing API english translation sentiment api3 Indico API english translation sentiment api4 IndicoHq API english translation
Also, the columns in subsequent tables for which the data type is set to LONGTEXT-default to a JSON string. Storing multi-value JSON strings might seem to go against the First Normal Form (1NF) rule which asserts that every column should hold a single value. However, MySQL 5.7. has introduced support for JSON. And one of its features is normalization of JSON documents prior to inserting [4]. Even though we opted for a version without JSON support, we’ve decided to code for future compatibility in order to avoid database bloat caused by an exaggerated number of columns. This way instead of having multiple columns for each (AP I, language) configuration, we have only one.
im post sentiment
id INT PRIMARY KEY
idpost INT FORGEIN KEY to im post: the field points to post’s id
real sentiment LONGTEXT aggregation over post’s comments of: real sentiment data
sentiment api1, sentiment api1 en, sentiment api2, sentiment api2 en, sentiment api3, sentiment api4
LONGTEXT
aggregation over post’s comments of: API’s sentiment predictions in original (English) language. All sentiment api columns default to: { " s e n t i m e n t _ s t a t s " : { " p o s i t i v e " : 9, " n e g a t i v e " : 2, " n e u t r a l " : 38, " t o t a l " : 49 } , " s e n t i m e n t _ l a b e l " : " n e u t r a l " " t o t a l _ c o m m e n t s " : 49, }
4.2. Implementation
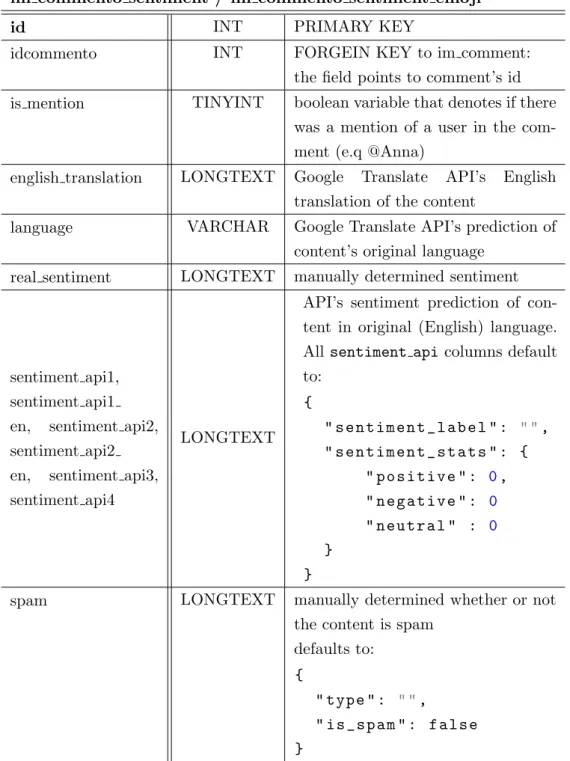
im commento sentiment / im commento sentiment emoji
id INT PRIMARY KEY
idcommento INT FORGEIN KEY to im comment: the field points to comment’s id is mention TINYINT boolean variable that denotes if there
was a mention of a user in the com-ment (e.q @Anna)
english translation LONGTEXT Google Translate API’s English translation of the content
language VARCHAR Google Translate API’s prediction of content’s original language
real sentiment LONGTEXT manually determined sentiment
sentiment api1, sentiment api1 en, sentiment api2, sentiment api2 en, sentiment api3, sentiment api4
LONGTEXT
API’s sentiment prediction of con-tent in original (English) language. All sentiment api columns default to: { " s e n t i m e n t _ l a b e l " : " ", " s e n t i m e n t _ s t a t s " : { " p o s i t i v e " : 0, " n e g a t i v e " : 0 " n e u t r a l " : 0 } }
spam LONGTEXT manually determined whether or not the content is spam
defaults to: {
" t y p e " : " ",
" i s _ s p a m " : f a l s e }
Table 4.6: Overview of im commento sentiment and im commento sentiment emoji database table
4. Framework
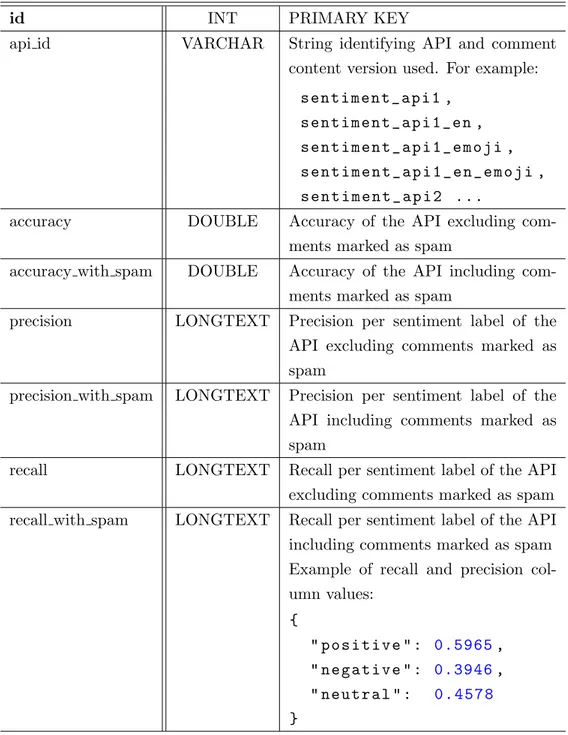
im sentiment api stats
id INT PRIMARY KEY
api id VARCHAR String identifying API and comment content version used. For example:
s e n t i m e n t _ a p i 1 , s e n t i m e n t _ a p i 1 _ e n , s e n t i m e n t _ a p i 1 _ e m o j i , s e n t i m e n t _ a p i 1 _ e n _ e m o j i , s e n t i m e n t _ a p i 2 ...
accuracy DOUBLE Accuracy of the API excluding com-ments marked as spam
accuracy with spam DOUBLE Accuracy of the API including com-ments marked as spam
precision LONGTEXT Precision per sentiment label of the API excluding comments marked as spam
precision with spam LONGTEXT Precision per sentiment label of the API including comments marked as spam
recall LONGTEXT Recall per sentiment label of the API excluding comments marked as spam recall with spam LONGTEXT Recall per sentiment label of the API including comments marked as spam Example of recall and precision col-umn values: { " p o s i t i v e " : 0.5965, " n e g a t i v e " : 0.3946, " n e u t r a l " : 0 . 4 5 7 8 }
4.2. Implementation
4.2.2 Sentiment analysis APIs
Four different APIs were chosen to be tried and evaluated against each other. They were chosen on the grounds of them being free and easily programmatically accessible regardless of the programming language used. Thus making it feasible for us to invoke them from our framework. Each of the APIs is called by making either a HTTP or HTTPS post request with a specific payload. The responses vary but all are parsed and stored in the format like the one shown in Listing 3.1.
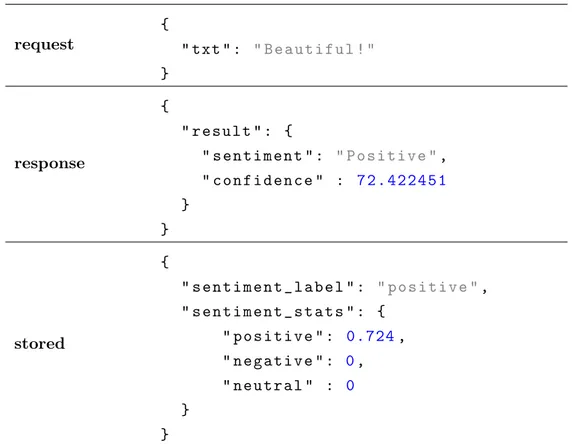
Vivekn API
Author: Vivek Narayanan
Web url: http://sentiment.vivekn.com/docs/api/
Database columns: sentiment api1 and sentiment api1 en
As described on the API’s website, the tool works by examining individual words and short sequences of words which then compares against a probability model. The prob-ability model was built on a prelabeled test set of IMDb movie reviews and it is based on the Fast and accurate sentiment classification using an enhanced Naive Bayes model study [5]. The API is invoked via an HTTP post request with a txt payload that sup-plies comment’s content. The request, response and the form in which the response was stored in sentiment db is presented in Table 4.8.
request { " txt " : " B e a u t i f u l ! " } response { " r e s u l t " : { " s e n t i m e n t " : " P o s i t i v e ", " c o n f i d e n c e " : 7 2 . 4 2 2 4 5 1 } } stored { " s e n t i m e n t _ l a b e l " : " p o s i t i v e ", " s e n t i m e n t _ s t a t s " : { " p o s i t i v e " : 0.724, " n e g a t i v e " : 0, " n e u t r a l " : 0 } }
4. Framework
Text-processing API
Web url: http://text-processing.com/docs/sentiment.html Database columns: sentiment api2 and sentiment api2 en
This API is also trained on movie reviews but uses two binary classifiers. More specifically, it uses hierarchical classification by combining a subjectivity classifier and a polarity classifier. First, the subjectivity classifier determines whether the text is objective or subjective. If the text is objective, then it is classified as neutral. Otherwise the polarity classifier is used to determine if the text is positive or neg-ative. More details on the implementation can be found in articles [6], [7], [8] and [9]. However, the two classifier model introduces a caveat. Sentiment probabilities of positive and negative labels always sum up to one, while the neutral label is stan-dalone and dominates the result if its probability is greater than 0.5. The response, request and the stored JSON strings are shown in Table 4.9.
request { " t e x t " : " B e a u t i f u l ! " } response { " l a b e l " : " neg ", " p r o b a b i l i t y " : { " n e u t r a l " : 0 . 3 8 6 3 7 6 0 9 9 9 4 7 0 9 8 5 4, " neg " : 0 . 6 8 8 4 6 3 0 5 4 8 1 7 8 5 6 0 8, " pos " : 0 . 3 1 1 5 3 6 9 4 5 1 8 2 1 4 3 7 5 } } stored { " s e n t i m e n t _ l a b e l " : " n e g a t i v e ", " s e n t i m e n t _ s t a t s " : { " p o s i t i v e " : 0.311, " n e g a t i v e " : 0.688, " n e u t r a l " : 0 . 3 8 6 } }
4.2. Implementation
Indico API
Web url: https://indico.io/docs#sentiment
Web url (hq): https://indico.io/docs#sentiment hq
Database columns: sentiment api3 and sentiment api4 (hq)
Even though we used all APIs as black boxes, the Indico API was treated as such even more so because implementation details weren’t readily available on its website. It was also the only API that required registration in order to obtain an authorization key to access it. It did, however, provide two different endpoints, a regular sentiment analysis and a high quality (hq) version. API’s response is a number between 0 and 1. This number represents the likelihood that the analyzed text is positive. Meaning, values greater than 0.5 indicate positive sentiment, while values below that threshold indicate a negative sentiment. Since we were operating within a three label domain, a script was made to label all likelihoods ∈ [a, b] as neutral to see how the accuracy (and other metrics) would change. The response, request and the stored JSON are listed in Table 4.10. request { " d a t a " : " B e a u t i f u l ! ", " a p i _ k e y " : 6 8 d 3 0 f . . ., " l a n g u a g e " : " e n g l i s h " } response { " r e s u l t s " : 0 . 3 4 6 8 1 0 2 0 8 1 5 1 1 1 1 3 } stored { " s e n t i m e n t _ l a b e l " : " p o s i t i v e ", " s e n t i m e n t _ s t a t s " : { " p o s i t i v e " : 0.654, " n e g a t i v e " : 0.346, " n e u t r a l " : 0 } }
4. Framework
4.2.3 Sentiment analysis scripts
The logic of all workflows described in Chapter 3 is implemented as a collection of python scripts. If we were to take the top down approach as we did in Chapter 3, we can start mapping specific nodes in workflow flowcharts to single scripts.
Predicting sentiment, determining real sentiment and performance evaluation parts of Figure 3.1 are realized via automated sentiment analysis.py, update real sentiment and spam.py and evaluate api performance.py, respectively.
API evaluation script
The evaluate api performance.py script can be invoked via the command line and it stores the results in im sentiment api stats database table. It accepts the following optional arguments:
–help -h shows all available arguments and exits
–api <name> specifies which API ∈ {sentiment api1, sentiment api1 en, sentiment api2, sentiment api2 en, sentiment api3, sentiment api4} to eval-uate. If not specified, script evaluates all APIs
–metric <name> specifies which metric ∈ {precision, accuracy, recall} to calculate. If not specified, all are calculated
–spam calculates performance metric(s) for specified API(s) taking into ac-count all comments regardless weather or non they were tagged as spam –no-spam calculates performance metric(s) for specified API(s) taking into
account only the comments not tagged as spam. If neither no-spam nor spam arguments were specified, the metrics are calculated for both cases –emoji calculates performance metric(s) for specified API(s) of sentiment
statis-tics from im commento sentiment emoji table
–no-emoji calculates performance metric(s) for specified API(s) of sentiment statistics from im commento sentiment table If neither no-emoji nor emoji arguments were specified, the metrics are calculated for both
Usage and sample output
$ python evaluate_api_performance.py --metric accuracy ---Calculations for api: sentiment_api1_emoji with spam Real sentiment distribution {
"positive": "43.51%", "neutral": "45.61%", "negative": "10.88%" }
4.2. Implementation
True positives:
{’positive’: 1205, ’neutral’: 2167, ’negative’: 177} False negatives:
{’positive’: 1439, ’neutral’: 605, ’negative’: 484} False positives:
{’positive’: 517, ’neutral’: 1694, ’negative’: 317} Total sentiment predictions: 6077
Accuracy: 0.584000
-Updating table im_sentiment_api_stats
Setting ‘accuracy_with_spam‘ = 0.584 Where ‘api_id‘ = ’sentiment_api1_emoji’ ... 1 row affected
---Script for determining real sentiment
The update real sentiment and spam.py script can be invoked via the command line and stores the results in im commento sentiment table. For each comment the script displays its content and prompts user for input to determine:
1. whether or not the comment is only a user tag (e.g @Anna) 2. whether or not the comment is spam and if so, to specify a type 3. comment sentiment
The script accepts the following optional arguments (if no arguments are specified script runs for all comments):
–help -h shows all available arguments and exits -idgt <nb> runs for all comments that satisfy id > nb -idlt <nb> runs for all comments that satisfy id < nb
-ideq <nb nb> runs for the the space separated list of comment ids Usage and sample output
$ python update_real_sentiment_and_spam.py -ideq 6 7 ---Comment_id: 6
Content: Bellissime!
4. Framework
-Is this comment ONLY a mention? (y/n): n
Updating table im_commento_sentiment Setting ‘is_mention‘ = 0
Where idcommento = 6 ... 1 row affected
-Is this comment spam? (y/n): n
Updating table im_commento_sentiment
Setting ‘spam‘ = ’{"type": "", "is_spam": false}’ Where idcommento = 6
... 1 row affected
-Determine the real_sentiment: pos/neg/neu/mix? pos Updating table im_commento_sentiment
Setting ‘real_sentiment‘ = ’{ "sentiment_label": "positive", "sentiment_stats": { "positive": 1, "negative": 0, "neutral": 0 }}’ Where idcommento = 6 ... 1 row affected
---Automated sentiment analysis
The sentiment prediction workflow in Figure 3.2 is implemented by automated sentiment analysis.py script. Each part of the workflow is implemented by an inde-pendent script that exports its functionality via s single function. Additionally, all of them are also standalone scripts and can be run via the command line. The following table contains a breakdown of scripts used by automated sentiment analysis.py.
translate comments.py
The script:
1. gets comment’s original content from im commento 2. calls Google Translate API with comment’s content
3. stores the translation and detected language in im commento sentiment data table
Command line arguments: -h, -ideq, -idlt, -idlt predict comment
sentiment.py Depending on the command line arguments or function pa-rameters provided, the script:
1. gets comment’s original content from im commento 2. gets comment’s English translation content from im
commento sentiment
3. calls one (or all) APIs for sentiment analysis
4. stores the new sentiment prediction in im commento sentiment emoji table
Command line arguments: -h, -ideq, -idlt, -idlt, -api, – original-language
update senti-ment prediction with emojis.py
If comment contains emojis, the script:
1. gets sentiment stats from im commento sentiment ta-ble
2. adds the sentiment score from im emoji stats for each emoji
3. normalizes stats so the likelihoods of positive, negative and neutral labels add up to 1
4. stores the new sentiment prediction in im commento sentiment emoji table
Command line arguments: -h, -ideq, -idlt, -idlt, -api update post
sen-timent stats.py Depending on the command line arguments or function pa-rameters provided, the script:
1. gets sentiment stats from im commento sentiment or im commento sentiment emoji table for all post’s comments
2. count per API how many positive, negative and neutral comments the post has
3. normalizes stats so the likelihoods of positive, negative and neutral labels add up to 1
4. stores the results of this aggregation in im post sentiment stats table
4. Framework
Usage and sample output
$ python predict_comment_sentiment.py -api ViveknAPI -ideq 6
---Comment_id: 6
Content: Bellissime! Translation: Beautiful!
Updating table im_commento_sentiment Setting ‘sentiment_api1_en‘ = ’{ "sentiment_stats": { "sentiment_label": "positive", "positive": 0.724, "negative": 0, "neutral": 0, } }’ Where idcommento = 6 ... 1 row affected ---4.2.4 Web server
Our web server is hosted on a Digital Ocean server, accessible via the domain name sentiment-analysis.ml. The server is set up as a Linux Ubuntu virtual machine with 512MB of RAM memory and 20GB of disk space.
It essentially runs two web applications build with Django 1.9+, the python web framework. Both web applications conform to Django’s Model Template View pat-tern, from now on refereed to as MTV. The patter is similar to the better known Model View Controller pattern. They are essentially the same paradigm, only what Django refers to as Template maps to the MVC’s View, and Django’s View corre-sponds to MVC’s Controller. All the slight variations between the two paradigms have been documented in depth in Mastering Django: Core[10]. In short, Django’s Model represents the underlying, logical structure of data and the relationships be-tween the data. The Template is the presentation layer. More specifically, it’s a collection of HTML pages. Finally, the View contains all business logic code. Views are usually positioned between models and templates and are used to communicate between them.
One of the web applications is a more traditional website used to aid development by having results accessible in a presentable and aggregated manner. The other is a REST API with a graphical user interface based on Django’s REST API which provides a handy way of interacting with the data. Other than being able to access
4.2. Implementation
the API and modify the data via a browser by going to sentiment-analysis.ml/api/, it can also be accessed from the command line, using tools like curl. For e.g.
# Get a list of posts:
$ curl -u username:password \
http://sentiment-analysis.ml/api/posts/?page=2 \ -H ’Accept: application/json; indent=2’
# Get a specific post’s details: $ curl -u username:password \
http://sentiment-analysis.ml/api/posts/<id>/ \ -H ’Accept: application/json; indent=2’
# Get a list of comments: $ curl -u username:password \
http://sentiment-analysis.ml/api/comments/?page=1 \ -H ’Accept: application/json; indent=2’
# Get a specific comment’s details: $ curl -u username:password \
http://sentiment-analysis.ml/api/comments/<id>/ \ -H ’Accept: application/json; indent=2’
# Modify comment’s real sentiment: $ curl -X PUT \
-u username:password \
http://sentiment-analysis.ml/api/comments/<id>/ \
-d ’{"real_sentiment":{"sentiment_label": "positive"}}’ \ -H "Content-Type: application/json" \
4. Framework
4.3
User interface
The User Interface, later in the text UI, has been split into two sections. One more suitable for a regular user, which contains stylized components representing our results. The other section consists of JSON REST API user interface, where data and our results are represented in JSON format. We will give more comprehensive explanation of each of them in the following two sections.
4.3.1 Web Application UI
In this section we have shown data from the data dump such as list of posts with their related comments. Post details are shown in a separate fragment of the page shown in the figure below. Fragment consist of content of the post, post engagement and links towards Facebook post and JSON REST API web page containing same information in JSON format.
Figure 4.3: Post Details Fragment
User is able to choose a specific post from the list of posts located in the left side of the page. Choosing a post, the fragment containing post details reloads with new data and under it lists all comments related to it. The representation of a list item of the comment list is represented in next figure. Comment fragment has original language comment content and the English translated version, under the content we outlined sentiment analysis results of most accurate API compared with real sentiment score. User can see detailed representation of sentiment scores for each API separately. In case of comments being marked as spam, there is an indicator clearly pointing it out.
4.3. User interface
Figure 4.4: Comment Fragment
Keeping in mind that the most preferred way of representing data is though visualization, we have decided to show sentiment scores though pie charts. Fragment that contains the chart is located on the right side of the web page. The chart fragment contains two pie charts, one representing statistics related to real sentiment score and second representing statistics related to sentiment score of chosen API as shown in the figure 4.5. User is able to choose between different APIs in order to visually compare them with real sentiment scores.
4. Framework
Figure 4.5: Chart representation of sentiment score
Navigating to Stats tab, we show how we have calculated the accuracy of APIs, list how many samples we have and list percentage of negative, positive and neutral real sentiment comments. This webpage gives opportunity to the user to see tabular representation of statistical results of each API with or without emojis, API with data translated in English and results taking into consideration the spam filters. Such tabular view has been enclosed below this paragraph.
4.3. User interface
Figure 4.6: Tabular representation of statistical results for an API
4.3.2 JSON REST API UI
This section represents the data in JSON form using Django REST Framework. The used framework has brought us to having a browsable Web API in few steps. Following official documentation we were able to define all the relations between our entities and easily retrieve needed data. One of few views we are able to reach is shown on the figure below.
Chapter 5
Results of APIs comparison
In this chapter we show how the developed framework allowed us to compare the performance of selected APIs (the ones described in Section 4.2.2). And in turn, the comparison allowed us to assess the validity of the framework. This chapter also aims to indicate how the framework can easily be extended for assessment of other, additional APIs.
5.1
Experimental setting
In our dataset we had a total of 6088 comments out of which 6.02% were labeled as spam and 24.7% contained at least one emoji or emoticon. As far as determining real sentiment by hand goes: 10.89% of the comments were labeled as negative, 45.49% as neutral and 43.62% as positive. It is obvious there is a bias in our data towards neutral and positive sentiments. This may be due to a small sample size, but more likely it is because people tend to leave more positive feedbacks rather than negative.
To evaluate APIs three metrics were used: accuracy, precision and recall. They were calculated by running the evaluate api performance.py script. For the sake of completeness, below are the formulas used to calculate those 3 metrics.
Accuracy is the simplest of all metrics as it is just the fraction of correctly classified comment sentiments.
Accuracy = number of correct predictions total number of comments
Precision and recall, on the other hand, are a bit more complex to understand and are calculated separately for each sentiment label ∈ {positive, negative, neutral}. While their calculation is quite straightforward in a binary classification problem, it gets a bit more challenging to intuit the logic in a multi-class problem. Primarily because the concepts used such as positive are traditionally explained by a single
5. Results of APIs comparison
confusion matrix and in this case they would have to be explained by three- one for each of the classification labels. To minimize redundancy, a confusion matrix for the positive sentiment class is shown in Table 5.1.
H H H H H H H H H predicted true
positive negative neutral
positive TP FP FP
negative FN -
-neutral FN -
-Table 5.1: Confusion matrix for the positive sentiment label
The following definitions are used in the case of calculating T P, F P, F N values for the positive sentiment label (the same rationale can be extended for the negative and neutral labels:
True Positive (TP): number of correctly predicted labels. More specifically, num-ber of correctly identified pairs {real, predicted}: {positive, positive}
False Positive (FP): number of times the API predicted the label in question when it shouldn’t have. More specifically, it would be the total number of misclassified pairs {real, predicted}: {negative, positive} and {neutral, positive}
False negative (FN): number of times the API didn’t predict the label when it should have. More specifically, it would be the total number of misclassified pairs {real, predicted}: {positive, negative} and {positive, neutral}
With this information we can proceed in defining the other two metrics used. Recall is the proportion of true {positive, negative, neutral} comments that were actually predicted correctly. In other words, out of all truly {positive, negative, neutral} examples, what fraction did the classifier manage to pick up?
Recall = T P T P + F N
Precision tells us what proportion of all the labels that were predicted as {positive, negative, neutral} truly are {positive, negative, neutral}. In other words, out of all the examples the classifier labeled as {positive, negative, neutral} what fraction was correct?
P recision = T P T P + F P
5.2. Results and discussion
5.2
Results and discussion
The calculated metrics discussed in Section 5.1 can be found in their entirety in Tables 5.2, 5.3 and 5.4. However, the data in a table format is a bit dense and presents a challenge to anyone who wants to gain valuable insights from it. To help with the visualization data were also presented in form of a few bar charts. The first two showing accuracy across all APIs, and the rest displaying precision and recall for Text-processing API.
If we take a closer look at the accuracy charts we can immediately see that predictions which used English translations had higher accuracy over the predictions made using content in original language. In fact, the accuracy was improved by 11.34% on average across all APIs used.
Taking comments marked as spam out of the equation does improve overall accuracy but by a very small margin of 1%. One of the reasons for such small improvement could be that the fraction of spam data was relatively low (6.02%) and hence couldn’t have a big impact on the metric.
However, the biggest impact on accuracy is gained by the usage of English trans-lations containing emojis. Accuracy of predicted sentiments of translated comments improved on average 19.39% when emojis were taken into account. What is even more interesting to note is the fact that emoji sensitive sentiment predictions of com-ments in original language outperform English emoji-less predictions by 9% w.r.t to accuracy. Both of these numbers prove that we were correct in assuming that emojis were a very important factor when it comes to determining content sentiment.
All APIs had improved their accuracy to be above 60% with the interventions our framework introduced. The interventions being translating comments and taking emojis into account. And out of all Text-processing API predicted sentiment of comments 74% ofthe time. That is great result indeed because when it comes to determining sentiment even humans can’t do it 100% accurately. Indeed, human accuracy tends to be around 80%, meaning people tend to agree on sentiment only around 80% of the time. This shines a different light on the results [11].
Looking at the recall and precision bar charts of the Text-processing API we can see how both metrics improved with using English translations and emojis. But the improvement is much more prominent with respect to recall and the positive label. Which means that the classifier managed to pick up a larger number of positive comments then originally. On the other hand, it seems the API struggled with identifying the ones labeled negative. As we can see from the charts, at best, Text-processing API picked up on 48% of negative comments; meaning it misclassified more than half as either positive or neutral. But we would need more data labeled negative (more than 10.89% at least) in order for us to confidently conclude the API didn’t perform well with respect to comments having negative sentiment.
5. Results of APIs comparison 0 0.1 0.2 0.3 0.4 0.5 0.6 0.7 0.8 0.9 1 0.49 0.53 0 0 0.55 0.59 0.48 0.56 0.58 0.67 0 0 0.64 0.72 0.58 0.61 Accuracy
API accuracy including spam comments
Vivekn Text-processing Indico IndicoHQ 0 0.1 0.2 0.3 0.4 0.5 0.6 0.7 0.8 0.9 1 0.48 0.52 0 0 0.55 0.6 0.49 0.58 0.58 0.67 0 0 0.65 0.74 0.6 0.63 Accuracy
API accuracy without spam comments
original language English translation original language with emoji English with emoji
5.2. Results and discussion 0 0.1 0.2 0.3 0.4 0.5 0.6 0.7 0.8 0.9 1 0.26 0.43 0.61 0.75 0.89 0.83 0.85 0.8 0.27 0.48 0.28 0.48 Recall
Recall for Text-processing API
original language English translation original language with emo ji English with emo ji 0 0.1 0.2 0.3 0.4 0.5 0.6 0.7 0.8 0.9 1 0.76 0.8 0.82 0.83 0.5 0.58 0.63 0.74 0.33 0.38 0.39 0.43 Precision
Precision for Text-processing API
positive neutral negative
5. Results of APIs comparison
API configuration Precision with-out spam
Precision with spam comments Vivekn original language (ol) ”positive”: 0.5965,
”neutral”: 0.4578, ”negative”: 0.3946
”positive”: 0.5583, ”neutral”: 0.4868, ”negative”: 0.3412 Vivekn (en) ”positive”: 0.6706,
”neutral”: 0.529, ”negative”: 0.4522
”positive”: 0.6323, ”neutral”: 0.5498, ”negative”: 0.3946 Vivekn (ol) with emoji ”positive”: 0.7351,
”neutral”: 0.5342, ”negative”: 0.4126
”positive”: 0.7001, ”neutral”: 0.562, ”negative”: 0.3583 Vivekn (en) with emoji ”positive”: 0.7482,
”neutral”: 0.6215, ”negative”: 0.4793
”positive”: 0.7138, ”neutral”: 0.6406, ”negative”: 0.4178 Text-processing (ol) ”positive”: 0.7631,
”neutral”: 0.4977, ”negative”: 0.3327
”positive”: 0.6964, ”neutral”: 0.5223, ”negative”: 0.3019 Text-processing (en) ”positive”: 0.7978,
”neutral”: 0.5757, ”negative”: 0.3801
”positive”: 0.7324, ”neutral”: 0.5934, ”negative”: 0.3451 Text-processing (ol) with emoji ”positive”: 0.822,
”neutral”: 0.6259, ”negative”: 0.3876
”positive”: 0.776, ”neutral”: 0.6471, ”negative”: 0.3527 Text-processing (en) with emoji ”positive”: 0.8307,
”neutral”: 0.7438, ”negative”: 0.4313
”positive”: 0.7801, ”neutral”: 0.7561, ”negative”: 0.3912 Indico (en) ”positive”: 0.616,
”neutral”: 0.4829, ”negative”: 0.2915
”positive”: 0.5841, ”neutral”: 0.5135, ”negative”: 0.2704 Indico (en) with emoji ”positive”: 0.6756,
”neutral”: 0.7059, ”negative”: 0.3318
”positive”: 0.6426, ”neutral”: 0.7284, ”negative”: 0.308 IndicoHQ (en) ”positive”: 0.5839,
”neutral”: 0.5479, ”negative”: 0.6193
”positive”: 0.5541, ”neutral”: 0.5738, ”negative”: 0.5558 IndicoHQ (en) with emoji ”positive”: 0.61,
”neutral”: 0.7031, ”negative”: 0.6161
”positive”: 0.5785, ”neutral”: 0.7224, ”negative”: 0.5602 Table 5.2: Precision stats