POLITECNICO DI MILANO
Corso di Laurea Magistrale in Ingegneria Informatica Dipartimento di Elettronica, Informazione e Bioingegneria
Master’s Degree in Computer Science and Engineering
Automated Techniques for Identifying
Fake News and Assisting Fact Checkers
Supervisor: Prof. Mark James Carman
Master’s thesis of:
Stefano Agresti, Matr. 913079
Acknowledgments
First of all, I would like to thank my surpervisor, prof. Mark Carman, for sharing his ideas and passion throughout the development of this thesis. Every time, they inspired me to push my work a bit further than I thought I could reach. I will miss our Thursday afternoon meetings.
A huge thanks goes to my parents, who supported me in every plan I had, no matter how crazy it seemed. Without them I wouldn’t have achieved half of what I did.
I have to thank my sister as well for all the nice time spent together, during trips and at home (also, thank you for all of Muffin’s pictures, they would lift anybody’s mood).
Thanks to Juliana, who could make even a lockdown look enjoyable. These last few months with you have gone by like a bliss. I can’t wait to see what the future holds for us.
I want to thank my ”Amicanza” group. You don’t see me a lot, but you’re always there to hang out when I’m back to Bracciano (and quarantine would’ve been a lot more boring without our game nights).
Finally, I’m going to thank every person I’ve met in these years. I can’t name everybody, but all you, from Los Angeles to Moscow, from Paris to Sicily, have made this journey through university much more than just studying.
Abstract
One of the most worrying issues of our age is the spread of online misinformation. This problem is affecting our society heavily, transforming political discussion into a relentless battle between opposing sides. Not only that, the diffusion of conspiracy theories makes it difficult for governments to enforce unpopular, yet necessary, legislation, as shown during the ongoing Covid-19 pandemic. It would be naive to put all the blame on Facebook or Twitter, but it’s undeniable that social networks have allowed fake news to prosper as never before. Many studies have been published on how to fight this phenomenon, oftentimes exploiting new powerful tools coming from the field of Artificial Intelligence, sometimes showing promising results. Yet, they all suffered from the limitations of dealing with such an elusive problem by using the classic “true” against “false” approach. In our thesis, we propose a new taxonomy for online news content that goes beyond this binary division (of fake versus real news), showing the creation pro-cess of fastidiouscity, a working prototype capable of categorizing unknown texts according to this new classification. We further investigate whether it is pos-sible to automatically detect and fact-check claims in a given text, a necessary step when discussing the veracity of a document, demonstrating the efficacy of our approach through a crowdsourcing experiment. Moreover, we show a new methodology for creating news datasets by scraping Reddit, setting up another crowdsourcing experiment to validate the quality of this strategy. Finally, we perform several experiments on how to enhance the training performances of BERT, Google’s new language representation model, demonstrating that they can be boosted in a multitask environment, while they’re not affected by the use of a multilingual dataset.
Contents
1 Introduction 1
1.1 Current technologies . . . 2
1.2 Our approach . . . 3
1.3 Outline of the thesis . . . 3
2 Related works 5 2.1 Natural Language Processing . . . 5
2.1.1 BERT . . . 5
2.2 Fake News Detection . . . 6
2.2.1 Knowledge Based . . . 7
2.2.2 Style Based . . . 8
2.2.3 Propagation Based . . . 8
2.2.4 Source Based . . . 9
2.3 Fake News Datasets . . . 9
2.4 Fake News Taxonomy . . . 10
3 Research questions 12 4 Our approach 15 4.1 Proposing a new Taxonomy . . . 15
4.1.1 News . . . 17
4.1.2 Opinions . . . 19
4.1.3 Memes . . . 20
4.2 Proposing a structure for an online content classifier . . . 22
4.3 Building an online content classifier . . . 23
5 Data 24
5.1 Datasets for the newsworthiness classifier . . . 24
5.2 Datasets for the professionality classifier . . . 26
5.2.1 Low-quality articles . . . 28
5.2.2 High-quality articles . . . 30
5.3 Datasets for the automated fact-checking system . . . 32
5.3.1 Datasets for claim detection . . . 32
5.3.2 Datasets for agreement detection . . . 36
5.4 Datasates for the bias detector . . . 41
5.5 Datasets for the political ideology detector . . . 45
5.6 Datasets for the multilingual experiment . . . 47
5.7 Datasets for the multitask experiment . . . 51
5.8 Summary . . . 51
6 Experiments 53 6.1 Evaluating the quality of a Reddit dataset . . . 53
6.2 Building a newsworthiness classifier . . . 56
6.3 Building a professionality classifier . . . 58
6.3.1 First classifier: r/savedyouaclick and r/qualitynews . . . . 59
6.3.2 Second classifier: r/savedyouaclick and r/news . . . 60
6.3.3 Third classifier: r/savedyouaclick and selected publishers 60 6.3.4 Considerations on the experiment . . . 61
6.4 Building an automated fact-checking system . . . 62
6.4.1 Claim detection . . . 63
6.4.2 Coreference resolution . . . 66
6.4.3 Agreement detection . . . 68
6.5 Building a bias detector . . . 70
6.5.1 Related works . . . 70
6.5.2 First classifier: Wikipedia dataset . . . 71
6.5.3 Second classifier: News dataset (Kaggle and r/conservative) . . . 72
6.5.4 Third classifier: News dataset (Kaggle, r/conservative, liberal subreddits) . . . 72
6.5.5 Considerations on the experiments . . . 73
6.6 Building a political ideology detector . . . 74
6.6.1 First classifier: Crowdsourcing dataset . . . 75
6.6.2 Second classifier: News dataset (Kaggle and r/conservative) . . . 76
6.6.3 Third classifier: News dataset (r/conservative and liberal subreddits) . . . 76
6.7 Exploring BERT’s performances on a multilingual dataset . . . . 77
6.7.1 Related works . . . 78
6.7.2 Our experiment . . . 78
6.7.3 Results . . . 80
6.8 Exploring BERT’s performances in a multi-task setting . . . 82
6.8.1 Our experiment . . . 83
6.8.2 Results . . . 84
7 Building a working prototype 86 8 Conclusions 88 8.1 Future works . . . 91
Bibliography 94 A Technical details 98 A.1 Scraping Reddit . . . 98
A.2 Scraping fact-checking websites . . . 99
A.2.1 Creating a list of fact-checking websites . . . 99
A.2.2 Creating a list of claims and articles links . . . 102
A.2.3 Scraping the articles . . . 102
Chapter 1
Introduction
Among the numerous innovations and revolutions that the last decade has brought, one of the most impactful was, with little doubt, that of social media. Mostly created around 2004-2005, the number of people using these websites skyrocketed in the last ten years, reaching more than 3.5 billion people, roughly half of the world population1. Unfortunately, it’s common knowledge that these
tools are now causing several negative effects on society that can be difficult to deal with and to fight against, or even to simply monitor. Increased depres-sion rates between teenagers, invasive marketing, lack of privacy online are just some of the problems denounced by endless studies and experts (Twenge et al. 2018,Rosenblum 2007,Zuboff 2019). One of the most disturbing phenomena, however, is the explosion of misinformation.
Brought to the attention of politics after the 2016 US presidential elections, the so-called “fake news” have been a plague on the Internet since its creation, but have only recently entered the spotlight because of their worrying grip over public opinion. While ten years ago conspiracy theories and hoaxes were limited to circles of fanatics, which accounted for an extremely small portion of the population, they are now largely widespread, actively affecting political discourse in most of the western world2.
A proof of that was given during the Covid-19 pandemic. While governments and medical experts tried to control the situation through difficult measures, such as lockdowns and forced social distancing, their efforts were undermined 1https://www.statista.com/statistics/278414/number-of-worldwide-social-network-users 2https://time.com/5887437/conspiracy-theories-2020-election/
CHAPTER 1. INTRODUCTION 2
by people who didn’t consider the virus as a serious threat, but rather chose to believe in secret plots and hidden powers interested in disrupting the economy. What ten years ago would’ve made us laugh, today is a common reality, with over 70% of Americans who have at least read coronavirus-related conspiracy theories and one quarter of them actually believing in their truthfulness3.
Not all hope is lost, though. While long-term solutions should be addressed by schools and education, we can fight today against this problem using devices coming from the same world as social networks. Artificial Intelligence (AI) and text classification technologies have made huge steps forwards in recent years, crashing record after record. Many researchers are now exploring the possibility of contrasting the spread of misinformation using big data and machine learn-ing, while companies like Facebook, Twitter and Youtube have started flagging or demonetizing content that their algorithms recognize as containing wrong information.
1.1
Current technologies
With billions of posts, tweets and generic content shared on social networks ev-ery day, it is impossible to target misinformation without using automatic clas-sification techniques. Specifically, we need systems capable of analyzing large quantities of text, in order to detect automatically whenever falseful content is posted, without requiring any human intervention in the process. Luckily, technology is evolving fast in this area. The latest innovation in the field is called BERT (Devlin et al. 2019), acronym for Bidirectional Encoder Represen-tations from Transformers, a new language representation model pre-trained by Google’s engineers on a corpus of books of 800M words and on a version of English Wikipedia of 2,500M words. BERT’s main characteristic is that it is designed in such a way that it can be fine-tuned on specific tasks simply by modifying its final output layer. As a result, BERT obtains state-of-the-art re-sults on Natural Language Processing (NLP) tasks it wasn’t trained for, even when faced with small fine-tuning data.
In this thesis, BERT will be the main model we will be using for our experiments. 3 https://www.pewresearch.org/fact-tank/2020/07/24/a-look-at-the-americans-who-believe-there-is-some-truth-to-the-conspiracy-theory-that-covid-19-was-planned/
CHAPTER 1. INTRODUCTION 3
1.2
Our approach
Despite the exceptional achievements of BERT and the various studies per-formed on the subject of fake news, we’re still far from an effective and compre-hensive solution on the matter.
In many cases, researchers simply focused their attention on comparing “false” news against “real” information. They analyzed how news articles spread ( Zan-nettou et al. 2017), how they’re written (Zellers et al. 2019) or how users interact with them (Castillo, Mendoza, and Poblete 2013) to determine whether they’re more likely to be fabricated or not, sometimes with good results. Yet, most of these studies lacked a more holistic approach, one that takes into consideration the more subtle ways in which misinformation spreads online. An opinion piece can be biased, pointing the reader in a specific direction, without containing any false data. Citizen reporting might contain low-quality writing and content, but might be true information anyway. A news outlet can be precise in reporting news that harm the opposing political side, but fail to denounce its own. The purpose of this thesis is to propose a new, more complex classification of online news, showing that it is possible to go beyond the binary distinction “fake” versus “real” and that it is possible to build on top of this new taxonomy an automatic classifier using the technology available today. We will therefore present fastidiouscity, a working prototype designed for this purpose.
We will then discuss how to train a system to detect check-worthy statements inside a given text and how to effectively perform automatic online searches to find evidence to confirm or refute them.
Other than that, we’re going to show how social networks can be mined in order to build datasets of news articles to be used in text classification tasks without resorting to crowdsourcing and/or manual labelling to categorize them. Finally, we will be performing some experiments to show whether the training of BERT models can be positively affected by the use of a multilingual dataset and by the use of a multitask setting.
1.3
Outline of the thesis
The thesis is structured as follows:
state-of-the-CHAPTER 1. INTRODUCTION 4
art results in the field of online misinformation detection
• Chapter 3 describes the research questions that this thesis is trying to answer
• Chapter 4 presents our proposed taxonomy of online news, as well as the steps to build an automatic classifier on top of it
• Chapter 5 explains the details of the datasets that were used and the steps taken to create new ones by mining social networks
• Chapter 6 describes the experiments that were performed to answer our research questions with their results
• Chapter 7 presents fastidiouscity, our working prototype
• Chapter 8 summarizes the entire work, drawing conclusions on our ap-proach to the problem
Chapter 2
Related works
We present here a survey of the different techniques and approaches that have been used in literature to counter the proliferation of online misinformation. In addition to that, we will give a deeper explanation of BERT, Google’s new language representation model, as it was used extensively throughout the de-velopment of this thesis, together with a generic introduction to the field of Natural Language Processing.
2.1
Natural Language Processing
According to the Oxford dictionary, Natural Language Processing is “the ap-plication of computational techniques to the analysis and synthesis of natural language and speech”. In synthesis, we can say that its goal is to make com-puters capable of fully understanding and interacting with human language. Created in the 1950s, this field has grown parallel to AI and machine learn-ing, progressing as more and more data became available to researchers with the coming of modern internet. Not only that, new and more powerful models have been produced at impressive rates in recent years, each one surpassing the records set by the previous ones.
2.1.1
BERT
The latest innovation in the area of NLP was brought by Google in 2018, with the release of BERT, acronym that stands for Bidirectional Encoders
CHAPTER 2. RELATED WORKS 6
sentations from Transformers. BERT’s model is based on the Transformers architecture, whose original implementation is described inVaswani et al. 2018
and that we will be omitting here for brevity purposes, referring the readers to the original paper for a better understanding. The main difference between BERT and other Transformers based models is the task it’s been pre-trained on, which uses a “Masked Language Model” objective. This means that ran-dom words are masked from the input, with the system having the objective of predicting them correctly by only analyzing the remaining part of the sen-tence. This task allowed the authors to abandon the left-to-right or right-to-left paradigms common in language models (which resembles the way humans read), in favor of a bidirectional approach, which uses words both preceding and fol-lowing the masked item to help in the prediction. BERT was also pre-trained on a “next-sentence prediction” task, which helps pre-training on text-pairs repre-sentations. The authors used two different sources to pre-train their model, the BookCorpus (800M words) and English Wikipedia (2,500M words). After com-pleting the pre-training step, the model can be fine-tuned on any specific task, obtaining in many cases good accuracy even with little data available. The final results rewarded Google’s approach, with BERT advancing the state-of-the-art for eleven different NLP tasks.
2.2
Fake News Detection
As mentioned in the introduction, several studies have been made on how to effectively tackle the fight against fake news. Here we will be giving a survey of the most recent developments on the subject. For a more in-depth analysis, we suggestZhou and Zafarani 2018. In general, we can divide fake news detection techniques into four main categories:
• Knowledge based • Style based • Propagation based • Source based
CHAPTER 2. RELATED WORKS 7
2.2.1
Knowledge Based
Knowledge based techniques exploit one of the oldest weapons against fake news, fact-checking. The idea behind it is to simply check whether the information contained inside a story is true or not, without any additional analysis. Manual fact-checking is very common, with several websites like Politifact1 or Snopes2 that have turned it into a business model, and it’s generally considered the most reliable way to expose fake news, since it makes use of trusted experts who can evaluate a news article or a politician statement in all of its shades. Unfortunately, it’s also one of the slowest ways to counter misinformation, which instead spreads fast through the web, often damaging the community before the fact-checking process has even begun.
To overcome these issues, the concept of automatic fact-checking has been pro-posed. A possible way to achieve the automatization of fact-checking is pre-sented inCiampaglia et al. 2015, where authors discuss the possibility of creat-ing a knowledge graph of information known to be true. The graph will then give higher support to truthful claims with respect to false ones, helping in discerning between the two. There are, however, several limitations with this approach, since a knowledge graph is expensive to create and to maintain, due to the constant updates it requires to implement new information.
A different perspective is given inFavano 2019. In that work, the author showed a proof of concept for a system capable of recognizing claims inside a speech, before looking online for related articles, judging automatically whether those articles support or refute the claims, thus providing explainable proofs as to why a certain statement should be approved or rejected. Figure 2.1 displays a schematic description of this system.
Figure 2.1: The proof of concept presented in Favano 2019. 1www.politifact.com
CHAPTER 2. RELATED WORKS 8
2.2.2
Style Based
As in knowledge based methods, style based techniques focus on news content to determine their truthfulness. Different from knowledge based, though, they analyze the way a story is written to make this decision. In recent studies, not only the writing style, but also images and multimedia content have been taken into consideration to obtain a greater accuracy in news classification, creating the field of multi-modal fake news detection. One such example is Y. Wang et al. 2018. In this paper, the authors showed a new framework that uses a combination of multi-modal features to assess the credibility of a news article. The result is a system that can quickly analyze a story’s veracity, even if it’s talking about new events that just happened. The main issues with style based approaches are their low accuracy on real-world scenarios, as well as the fact that fake news publishers can easily manipulate their writing style in order to bypass them. Moreover, these methods are powerless if the person writing is convinced that his/her information is true, no matter what the actual truth value is (recurring situation with common users on social networks). All in all, this strategy is promising, but still presents serious limitations when used alone.
2.2.3
Propagation Based
As explained in Vosoughi, Roy, and Aral 2018, ”fake news spreads faster, far-ther, more widely, and is more popular with a higher structure virality score compared to true news”. That is, there are fundamental differences between how truthful and fake news spread. Starting from this assumption, methods can be conceived to detect online fake content exploiting the way they propa-gate on social media. Many papers have followed this strategy, showing in some cases interesting results. We point the readers to Ma, Gao, and Wong 2018,
Zhang, Dong, and Yu 2018andZhou and Zafarani 2019for reference.
The main drawback of this approach is that it requires the news to spread before it is able to make a classification, allowing fake stories to be shared and read by users in the meantime. On the other hand, these systems are more robust to manipulation than style based ones and can give important insights on what makes news viral.
CHAPTER 2. RELATED WORKS 9
2.2.4
Source Based
One more approach that can be employed against fake news is the source based approach. In this case, a system is developed such that, given a news story, it is capable of assessing the credibility of its publisher and/or the credibility of the users that have shared it online.
As shown inHorne, Norregaard, and Adali 2019, news publishers on social media can be grouped according to the stories they choose to release, showing a clear distinction between hyper-partisan websites, conspiracy communities and main-stream media. However, labelling news as “reliable” or “unreliable” depending on their authors raises serious ethical concerns that should be evaluated when creating a fake news detection system.
A different path is to look at the users who spread these stories. Estimates by
Shao et al. 2018 tell us that 9 to 15 percent of Twitter users are bots, many of which created with the sole purpose of influencing online political discussion. Research on how to detect malicious ones has progressed significantly, with an example being Cai, L. Li, and Zeng 2017. The problem in this case is that, for every malicious bot that’s taken down, new ones can be created, possibly more powerful and more difficult to detect. For this reason, there have been suggestions to focus instead on vulnerable users, users who don’t spread fake news maliciously, but tend to believe and share them more than the average user. Unfortunately, at the moment of writing no major paper has been published on the topic.
2.3
Fake News Datasets
In the previous paragraphs we showed the state-of-the-art in the field of fake news detection. Many of the presented papers rely on deep learning or natural language processing to build effective systems and their results suggest that we should keep working in this direction in the future. But to build better, more robust detectors we don’t need only new models, we also need good quality data. We present here two of the most important datasets that were built in this field and that serve as a foundation for the datasets built for this thesis.
• Liar, Liar Pants On Fire, W. Wang 2017. This is considered one of the most important benchmarks when talking about fake news detection. Obtained by scraping statements fact-checked by Politifact between 2007
CHAPTER 2. RELATED WORKS 10
and 2016, it contains more than 12.8K claims labelled on various degrees of truthfulness. This dataset contains many additional information for each claim, such as speaker’s name and history, party affiliation, subject of the claim.
• r/Fakeddit: A New Multimodal Benchmark Dataset For Fine-Grained Fake News Detection, Nakamura, Levy, and W. Y. Wang 2019. This dataset contains more than 1 million samples, 60 percent of which are accompanied by images or other types of media, labeled according to a 6-way classification. The dataset was built by scraping Reddit3 submissions
on 22 different subreddits (a subreddit is a subpage of Reddit dedicated to a specific theme - for example, in r/news users share news articles from around the world). The researchers then assigned a label to the samples depending on the subreddit they were coming from.
2.4
Fake News Taxonomy
When facing a classification problem, one of the first tasks a data scientist has to take care of is finding an appropriate set of labels on which to perform the actual classification. This can often be tricky, as a set too small might give inconclusive results, while one too big might confuse classification algorithms and lead to overfitting. Fake news detection is not different in this. At the time of writing, there isn’t a unique classification researchers and experts agreed on. The majority of fact-checking websites uses variations of the 6-degree truth scale from Politifact, which divides news into: “True”, “Mostly True”, “Half True”, “Mostly False”, “False”, “Pants on Fire” - with the first label indicating completely true information and the last one indicating a completely made-up story. Most of the papers we’ve seen so far have used a simpler “false”/”true” classification, given the difficulty of tracking these different shades of truth in an automatic system.
In some cases, researchers tried a different approach, labelling not the degree with which a news is false, but rather focusing on what makes it false. An exam-ple is the 6-way labelling system used in the r/Fakeddit dataset byNakamura, Levy, and W. Y. Wang 2019: “True”, “Satire/Parody”, “Misleading Content”, “Manipulated Content”, “False Connection”, “Imposter Content”. In this
CHAPTER 2. RELATED WORKS 11
text, fake news is divided according to the reason why it is considered fake -Imposter Content is considered fabricated because it’s written by bots, while Misleading Content is considered false because the title doesn’t match what’s written inside the article.
InMolina et al. 2019this same strategy is pursued, this time looking not only at the different types of fake news, but rather considering the different types of online news content. The final 8-way classification given in the paper is the following: “Real News”, “False News”, “Polarized Content”, “Satire”, “Misre-porting”, “Commentary”, “Persuasive Information”, “Citizen Journalism”. Some researchers proposed to change this approach entirely, ending the one-dimension classification that dominated so far and moving towards a multi-dimensional one. In Tandoc, Lim, and Ling 2017, authors suggested to look separately at an article’s factuality and at its intention to deceive, hence la-belling different online content according to how it performs on these two scales - for example satire is low on both, authoritative news is high on factuality and low on intention to deceive, misleading content is high on both.
In the end, experts have yet to find an universal labelling for online news con-tent that can satisfy both the necessities of classification algorithms as well as catching all the nuances of truthfulness in news articles. Some even argue that this is not possible at all and that we should rather change the fake news detec-tion problem from a classificadetec-tion task to a regression one, given that, as stated in Potthast et al. 2017, “hardly any piece of ‘fake news’ is entirely false, and hardly any piece of real news is flawless”.
Chapter 3
Research questions
In the previous chapters we have introduced the topic of fake news detection and listed its main strengths and weaknesses at the time of writing. In this work, we tackle some of the limitations currently encountered in the field by answering the following questions:
1. Is it possible to create an objective classification of online news that goes beyond the simple “fake”/”real” division? If so, are automated text clas-sification techniques available today effective enough to automatically cat-egorize articles according to this new classification?
2. Can we mine social networks like Reddit to build datasets to be used in news classification tasks that are as effective for training systems like BERT as those built through crowdsourcing?
3. Is it possible to build an automated fact-checking system that, given a text, is able to:
(a) reliably identify those sentences containing claims,
(b) automatically convert such sentences into a self-contained format (by removing coreferences, etc) so that they provide for more effective evidence search online, and
(c) determine whether any related evidence thus found supports or refutes the original claim?
CHAPTER 3. RESEARCH QUESTIONS 13
By answering the first question, we want to propose a new taxonomy for on-line news content that can be used to ease the work of automated classification systems without losing the various shades that characterize the world of online news distribution. We will then show that it’s possible to use modern technolo-gies to label unseen content according to such classification by describing, step by step, how we managed to build a working demo that tackles this specific problem.
As for the second point, we mentioned in chapter 2 that one of the main chal-lenges with fake news automatic detection is the lack of comprehensive datasets, necessary to train text classification systems like BERT. To tackle this issue, we will show different strategies used during our work to build such datasets on our own, before focusing on why scraping Reddit can be considered the most versatile, simple and effective way for building datasets for this purpose. Fi-nally, we will be presenting the results from a crowdsourcing experiment that we launched in order to gather evidence in support of our claim.
For the last question, we will be describing the creation of an automatic claim detection system, capable of finding check-worthy statements in a text, before retrieving related evidence online, analyzing it to determine whether it supports the original statement or not. To make the research more precise and effective, we will introduce one more step designed to automatically turn any sentence extracted from a text into a self-contained format, by removing any reference external to the sentence itself.
In addition to these three points, we will be performing further experiments to investigate whether BERT’s training performances can be improved under certain settings. Specifically, we will try to answer two more questions:
4. Does the training of a single BERT text classification model over a multi-lingual dataset give better results with respect to the training of different BERT models each over monolingual portions of the same dataset? 5. Does the training of a BERT text classification system obtain better results
when performed in a multi-task setting with respect to the training of the same system in a single-task setting?
As we know, the spread of online misinformation is not limited to a single coun-try, being instead widespread around the whole globe. Unfortunately, this goes at odds with most of the literature regarding automatic text classification, which
CHAPTER 3. RESEARCH QUESTIONS 14
is almost entirely focused on the English language, due to its predominance in publicly available datasets and due to the greater interest it receives from IT companies. That’s why one of the major reasons for the excitement around BERT was its ability to be easily fine-tuned to perform tasks in basically any language, even with little data available. What we want to discover in our work is: given a multilingual dataset, does a single BERT model fine-tuned over the entire dataset obtain better results than several BERT models, each fine-tuned on a monolingual portion of the same dataset? Understanding this is impor-tant, since it might lead to different approaches when building a system capable of detecting fake news in different languages, which represents the ultimate, long-term goal of this field of study.
The fifth and final question aims at understanding whether a BERT model could benefit from being fine-tuned in a multi-task setting with respect to a single-task one. The results of this experiment might be useful for our own work, since in many cases tasks overlap when talking about online news classification - as an example, detecting whether an article is biased and detecting its political ideology are two strictly related problems.
Chapter 4
Our approach
4.1
Proposing a new Taxonomy
As already mentioned, there isn’t a single classification for online news that experts and researchers agreed on. In section 2.4, we gave an overview of some proposed ones, but, as soon as we started collecting data, we realized that most of them weren’t detailed enough to fit it properly. The few that did required to notice distinctions too subtle for an automated system to detect, or even for an accurate dataset to be built. As an example, among the six labels used in r/Fakeddit, there are “misleading content”, “manipulated content” and “false connection”: how should we rate a clickbait article that contains badly reported statistics and exaggerated claims? It can rightly be considered “manipulated” if the data is fake, but if the data has a base of truth it becomes “mislead-ing”, and if it is accompanied by an unrelated image just to enhance views, it becomes “false connection”. Building a single model capable of following such a classification without overfitting is a challenge even for the most advanced technologies.
That’s why we prefer the approach shown inTandoc, Lim, and Ling 2017. In this paper, authors argue that we shouldn’t be using a one-dimensional approach to classify news content, proposing a two-dimensional system that analyses sep-arately factuality and intention to deceive. Such a system is simpler to build, as it can employ the best technique for each analysis, dividing the original problem of fake news detection into two different subproblems easier to tackle.
Our taxonomy follows this idea, increasing the number of dimensions and
CHAPTER 4. OUR APPROACH 16
taining a classification that is both accurate and relatively easier to implement in an automated classifier. We start from a first decision level, that, given a social media post, assigns it a different label based on whether it can be consid-ered newsworthy or not. Thus, we create a first distinction between four main categories of online content:
• news: they are characterized by two major features: they are of public interest (meaning that they are of interest to a large enough number of people - for example the inhabitants of a city or a country) and depict themselves as just reporting information.
• opinions: here, authors give comments or opinions. In some cases, these posts may contain data, but their main focus is to let readers know the point of view of the writer.
• personal posts: most of the posts that users see on their Facebook or Twitter feed belongs to this category. This box can be quite large, as it contains a variety of content, from personal updates, to funny stories, to simple jokes. The most important thing, however, is that this kind of content won’t change the reader’s perspective on the world in any way influential to society.
• memes: together with the category above, this is the most common con-tent on the internet. Although the official definition of meme is quite large, comprising any “idea, behavior or style . . . that spreads by imitation”1,
we restrict the category to all multimedia content that has been modified and manipulated in an evident way before being shared again. The differ-ence between a meme and a fake image/video is that the former doesn’t pretend to be truthful and is usually clearly distinguishable from any kind of news content. However, given that they’re usually published and shared for fun, they have been proven to be an effective propaganda machine, as they can easily hide political messages behind apparently innocuous jokes. The first layer of classification (also shown in Figure 4.1) allows us to dis-card most social media content, given that all personal content can be ignored. Therefore, the following steps will be focusing on the three remaining categories.
CHAPTER 4. OUR APPROACH 17
Figure 4.1: The first level of the classification.
4.1.1
News
We begin by splitting the news category based on the publishing source: • large media publishers: these are widespread newspapers that will rarely
publish information without any basis in reality. In general, they are characterized by good quality of writing and a large audience, although they can still report wrong information for various reasons.
• common users: they have generally low following, as well as poor writing skills compared to those of professional journalists (although exceptions exist). They are mostly untrustworthy when publishing news, unless we are dealing with situations of citizen reporting, where common citizens report facts they’re witnessing through smartphones and social media. • satirical publishers: their purpose is to mock the political establishment
and they’re usually easy to recognize by the average reader.
We further divide based on factuality, obtaining the following categorization (we didn’t include satirical content which is always non-factual):
• large media:
– truthful content : this category includes news articles containing only verified information. However, such information can be presented in a manipulated way, pointing the readers in the wrong direction. – false content : news articles containing information that has been
disproved by evidence.
– unverifiable content : in many cases, newspapers won’t release their sources, in order to protect them. This can lead to situations where
CHAPTER 4. OUR APPROACH 18
their information can’t be immediately verified, being backed only by its publisher reputation.
• common users:
– citizen reporting : in these situations, a citizen will report on an event he’s witnessing by publishing it on social media.
– hoax : hoaxes can be in the form of fake citizen reporting, with some-body pretending to witness something that is untrue, or in the form of conspiracy theories. In both cases, the information is completely false. This is one of the most dangerous types of content, since it often masks frauds or bots.
We proceed by splitting truthful and false content based on whether the content has been objectively reported:
• truthful content:
– good quality content : this type of news reports only verified informa-tion, backed by evidence, in a mostly objective manner. It doesn’t make use of loaded words, nor does it omit details to change the perception of a story.
– manipulated content : these stories have been twisted to favor one actor over the others or to make the content more appealing to the readers.
• false content:
– errors: sometimes, every newspaper can produce wrong information without any ill-intention behind. The most trustworthy ones will issue corrections, although this is not a common practice.
– fake content : it’s rare that a large newspaper knowingly releases a completely false story, given the repercussions it might face in terms of reputation or lawsuits. Therefore, in most cases, this happens only when there is a strong political motivation behind, such as discreting a political adversary.
Finally, we discriminate between the different ways a story can be manipulated by focusing on the writer’s motivation:
CHAPTER 4. OUR APPROACH 19
• biased content: if stories have been manipulated because of political moti-vations - which can be favoring a politician over another, pushing towards abstention or even just making an article more appealing to readers from a certain political area - we say that they’re biased. Such manipulation can take many forms, but is usually realized through omissions, use of emotional language or through an excessive emphasis over certain details. • clickbait: in this case, the goal is simply to draw more views to a website, in order to increase its revenues. These articles are generally harmless with respect to politically motivated ones, as they usually take the form of empty stories with catchy headlines, but are nevertheless unethical and increase distrust in newspapers.
The overall classification for news is summarised in Figure 4.2.
Figure 4.2: Classification of news in our taxonomy.
4.1.2
Opinions
With respect to news, we decided to adopt a simpler classification for opinion pieces, focusing only on their factuality and objectivity.
CHAPTER 4. OUR APPROACH 20
Checking a text factuality is a necessary step when dealing with opinions, be-cause, although sharing information is not their main purpose, they often make claims, bringing data to support their theses. It’s not rare that these claims are exaggerated, or even baseless, so fact-checking them is essential to establish whether such theses should be taken seriously or not.
Analysing whether a text is biased is crucial as well, since in writing opinion pieces authors enjoy large discretionality over which stories to focus on, over which data to show and over which tone to implement (the same article can have very different impacts if it’s written in an enraged tone rather than a neutral one). Thus, this is an important information when trying to distinguish well thought opinions from superficial, or even ill-intentioned, ones.
Given the above two-step classification, we obtain the following categories (dis-played in Figure 4.3):
• opinions based on wrong information: in this case, the author’s theses are built on false basis, so readers should approach them with strong skepticism, or discard them entirely.
• biased analysis: with this type of articles or posts, readers should be made aware that authors likely selected and analyzed the information at their disposal through the lens of their political ideals, thus altering the overall quality of their analysis.
• good quality: here, authors have taken correct information and, using it as a basis, provided a complete analysis that was minimally influenced by their political stances.
It’s worth noting that an opinion piece can be both biased and contain wrong information, although the latter is generally a more serious accusation.
4.1.3
Memes
The last category is constituted by memes. This category, mostly overlooked in previous works, has grown in importance in recent years, mainly because of how easily they spread through the internet.
We only make one distinction, between political and apolitical memes (examples for both are shown in Figures 4.4 and 4.5).
CHAPTER 4. OUR APPROACH 21
Figure 4.3: Classification of opinions in our taxonomy.
Figure 4.4: An apolitical meme from Wikipedia.
Figure 4.5: A meme with a clear polit-ical message.
CHAPTER 4. OUR APPROACH 22
The latter are harmless and their diffusion is mostly inconsequential to peo-ple’s lives. Conversely, political memes can be dangerous. By spreading over-simplified messages, they help sowing distrust and disillusion through the public, while polarizing the political debate at the same time (an example is given in
Proch´azka and Blommaert 2019, where authors show how memes have been used to popularize content related to the QAnon conspiracy). For these reasons, we believe it’s important to include them in our taxonomy.
4.2
Proposing a structure for an online content
classifier
After showing our classification for online news content, we propose a possible structure for a classifier to be built on top of it.
This classifier is composed of multiple sequential layers, roughly following the divisions mentioned in the previous paragraphs, and represents an ideal system: 1. Determine content newsworthiness, separating news from opinions and
personal posts, as well as isolating memes from other images. Then: (a) If it’s a meme: determine whether it is political or not
(b) If it’s a personal post: discard it
(c) If it’s news or opinion: continue with the classification 2. Analyze the content source (only for news content) 3. Analyze the content factuality
4. Analyze if the content is biased
5. Analyze what was the author’s intent (mainly for news content)
Based on the response to each of these points, we should be able to place any online content inside one of the categories shown above.
The advantage with respect to other systems is that the original problem has been divided into smaller tasks, each addressable in the most appropriate way via a specific classifier. Thus, we maintain a complex taxonomy that captures all the different shades of information sharing, without having to face an overly complicated technological challenge.
CHAPTER 4. OUR APPROACH 23
As a matter of fact, in the following sections we will be showing, through several experiments, that most of these tasks can already be tackled with the technology available today.
4.3
Building an online content classifier
Starting from this ideal structure, we realized a working prototype called fas-tidiouscity. This system represents a simplified version of the classifier just presented, to adapt it to the possibilities granted by current technologies. Its final composition consists in the following layers:
• A professionality detector
• An automated fact-checking system • A bias detector
• A detector to evaluate the political ideology behind a text
We decided to keep the focus of our work on texts, rather than images, as we considered the former more interesting from a research point of view, thus dropping the classification over political and apolitical memes.
We dropped the newsworthiness detector as well, since in the use case for our prototype, which consisted in a web application for reviewing articles provided by the users, we assumed this information would be unnecessary (a user wouldn’t be interested in using our system on something he/she doesn’t find newsworthy anyway). However, for completeness, we will still show the creation of such detector, from data collection to model training, leaving open the possibility of using our findings for different applications.
We also decided to simplify the last layer to fit the data at our disposal, moving from a more generic analysis of what a writer’s intent might be to a more specific predictor of what his/her political ideology could be.
In the next chapter, we will discuss the datasets used to train the classifiers, describing the experiments performed on them before their deployment.
Chapter 5
Data
In this chapter, we will show the datasets used in the creation of fastidiouscity and in the various experiments that we conducted. To make the presentation easier to follow, we decided to group them based on which purpose they were required for. For each of them, we prepared a description of its source and data and, for those we created by ourselves, we integrated such descriptions with an overview of their creation process. In the last paragraph, a brief summary is given for reference.
5.1
Datasets for the newsworthiness classifier
In the first layer of our ideal classifier, the objective was to separate uninteresting information (like personal updates) from newsworthy content. In Spangher, Peng, and Ferrara 2019, “newsworthiness” is defined by “how likely [a] piece of information [is] to appear on the front page of a major newspaper ”. Starting from this definition, we created a three way classification for online texts made of news, opinions and uninteresting content. We explained them in detail in section 4.1.
To collect data from all three categories, we resorted to three different sources. The first one, used to create a dataset of news articles, was Reddit. Taking inspiration from Nakamura, Levy, and W. Y. Wang 2019, we exploited the characteristic of this social network of creating mono-thematic communities to
CHAPTER 5. DATA 25
our advantage, finding r/news1, a community followed by more than 22 million users dedicated to sharing newspaper articles. Using the Pushshift API2, we
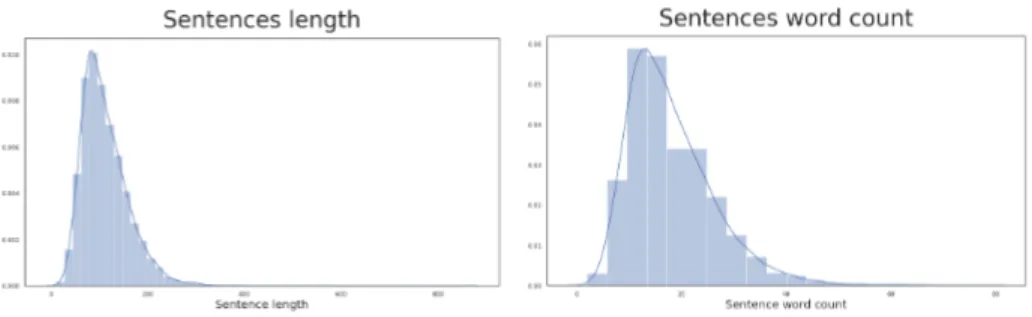
obtained 30,000 links published on the subreddit pointing to online news articles, which translated into 17,948 entries for our dataset (some articles were lost during the scraping process). Of these, we removed the ones characterized by an excessively low number of characters or words (threshold at 100 characters and 20 words), reducing them to 17,782 samples. In Figure 5.1, we show the distribution of the articles’ lengths, which appear to assume an almost normal distribution, as expected.
Figure 5.1: The distribution of r/news articles’ length and word count, capped at 5,000 characters and 2,000 words to make the graphs easier to interpret.
The second source was another subreddit, called r/InTheNews3. As specified
in its description, this community is “for opinion, analysis, and discussion of recent events”, which fit with our second category. From there, we were able to obtain 26,037 links that allowed us to successfully scrape 15,816 articles. As shown in Figure 5.2, in this case as well the distribution of the articles’ lengths didn’t reveal any particular pattern, being close to a normal one.
To create a collection of uninteresting content, we used instead a corpus of blog texts available on Kaggle4, retrieved from blogger.com and covering a wide variety of topics. To avoid any overlapping with the other categories, we removed all posts related to politics or society, which could be labelled incorrectly as opinions or news. The final dataset was considerably larger than the previous ones, with over 630,000 rows, so, to avoid excessively skewing the final model,
1https://www.reddit.com/r/news/ 2https://pushshift.io/
3https://www.reddit.com/r/inthenews/
CHAPTER 5. DATA 26
Figure 5.2: The distribution of r/InTheNews articles’ length and word count, capped at 5,000 characters and 2,000 words to make the graphs easier to inter-pret.
we decided to sample 20,000 of its entries. It’s interesting to notice that in this case, differently from before, the texts showed a different distribution in terms of their lengths, with short posts making up the majority of the dataset.
Figure 5.3: The distribution of the blog posts’ length and word count, capped at 5,000 characters and 2,000 words to make the graphs easier to interpret. In conclusion, before moving on, we show in Figure 5.4 an interesting comparison between the 30 most used words in the three datasets just presented. The differences are evident, with r/news and r/InTheNews dominated by political references, against the more common words found in the blog corpus.
5.2
Datasets for the professionality classifier
In our system, the main purpose of this layer was to discriminate between well written texts and poorly written ones, with the latter being usually less trustworthy.
CHAPTER 5. DATA 27
Figure 5.4: The most common words found in r/news (top left), r/InTheNews (top right) and in the blog corpus (bottom picture).
The only important work we found on the topic was by deepnews.ai5, private
company whose aim is to retrieve high-quality articles from all over the internet, delivering them to its users. As explained by the founder, their approach was to collect a large number of news articles, dividing them according to their publishers, before asking journalism students to review the classification thus obtained. This approach makes a very strong assumption, as it assumes that all articles coming from the same publisher are either well or poorly written. In this case, the problem was mitigated by implementing crowdsourcing to improve the overall quality of the data.
Unfortunately, applying this same strategy was not feasible for us, given the limited resources available for this thesis. Therefore, we decided to pursue different paths.
CHAPTER 5. DATA 28
5.2.1
Low-quality articles
As in section 5.1, we decided to exploit Reddit for this experiment as well. Specifically, we were able to find r/savedyouaclick6, a Reddit community with almost 1.5 million subscribers whose theme is precisely sharing clickbait and low quality articles, making it an optimal source for our purposes. From here, we were able to obtain links to more than 30,000 articles of this type. Of these, we were able to scrape 11,688.
In table 5.1, we show the 5 most recurring publishers among them, with the main one being web.archive.org, a website that archives web pages from vari-ous websites. The remaining publishers contributed to a lesser extent, although it’s interesting to see almost 300 articles coming from two prominent news out-lets such as Business Insider and CNN. However, looking at entries from the dataset, it’s evident that some questionable journalistic practices are common even among famous newspapers (in Figure 5.5, we show a clear example of clickbait in one of the articles from CNN collected in the dataset).
Publisher Number of articles
web.archive.org 4,370
express.co.uk 166
businessinsider.com 135
cnn.com 131
google.com 102
Table 5.1: The five most common publishers among the low-quality articles. Looking at the article’s lengths, their average is at 3,503 characters, or 581 words (roughly double the length of this paragraph so far). There are some notable exceptions, with some of them having only a few words, or having tens of thousands. Looking closer, there are 220 articles less than 100 characters long and 675 more than 10,000 characters long. We manually checked some of them, discovering that, for the former ones, the issue was caused by the scraping process, which sometimes retrieved only an article’s title, instead of its entire text, while the latter simply appeared to be very lengthy, not showing any particular problem. In a few cases, we discovered that the text had been replaced with anti-robot checks (one example being “JavaScript is disabled. You need to enable JavaScript to use SoundCloud ”). In the end, during our analysis,
CHAPTER 5. DATA 29
Figure 5.5: This article, published on the 22nd July 2020, reiterates something that was already known by the majority of people at that time: washing hands, wearing masks and social distancing help against the Covid-19 pandemic. Yet, the study mentioned in the title gives a much more complex answer to the mat-ter, even specifying that instructing the population to take these three simple steps could only “mitigate and delay the epidemic”, without ever stating that they would be enough to stop it on their own.
we noticed that, even having only an article’s title, it was easy to recognize low-quality content (here’s an example: “7 secrets everyone needs to know about financial advisors”), so we decided to keep all of the samples regardless of their size.
Figure 5.6: The distribution of length and word count for low-quality articles, capped at 5,000 characters and 2,000 words to make the graphs easier to inter-pret.
CHAPTER 5. DATA 30
5.2.2
High-quality articles
Following the idea above, we searched for Reddit communities dedicated to shar-ing high-quality news, findshar-ing r/qualitynews7. Out of the 13,394 urls retrieved from the subreddit, we were able to scrape 11,695 news articles to be used as examples of high-quality journalism (in table 5.2 the five most common publish-ers among them). Double-checking with MediaBiasFactCheck8(one of the most
authoritative sources when analyzing a newspaper ideology and reliability), we were reassured by the fact that all five of them had high ratings on the website.
Publisher Number of articles
reuters,com 2,344
bbc.com 2,181
npr.org 1,106
theguardian.com 898
aljazeera.com 848
Table 5.2: The 5 most common publishers on r/qualitynews.
After noticing a small number of entries with low word count, we decided to perform a manual inspection, removing those that we found out to be paywalls texts, rather than real articles. The number of removed rows was, however, not significant, being in the order of a few dozens.
It’s interesting to look at the resulting distribution of the articles’ lengths. As shown in figure 5.7, there is still a spike close to zero due to the many sam-ples coming from press agencies, like Reuters, whose format consists in short sentences reporting one key fact, without any added comment or analysis.
Given the low number of subscribers of r/qualitynews (only 12,947 at the time of writing), we decided to employ again the dataset presented in section 5.1 built from the larger r/news (which counted more than 22 million followers). It’s worth pointing out that the news shared on this subreddit has a tendency to be more international, as can be observed from the names of its most shared publishers, reported in table 5.3. MediaBiasFactCheck didn’t hold information on any them, presumably due to the website focus on the United States, so the assurance over the content quality was only given by the size of the audience populating the community.
7https://www.reddit.com/r/qualitynews/ 8https://mediabiasfactcheck.com/
CHAPTER 5. DATA 31
Figure 5.7: The distribution of r/qualitynews articles’ length and word count, capped at 5,000 characters and 2,000 words to make the graphs easier to inter-pret.
Publisher Number of articles
popularnews.in 2,256
corealpha.org 1,315
en.neroonews.com 1,144
newspotng.com 1,052
techfans.co.uk 922
Table 5.3: The five most common publishers on r/news.
Finally, we decided to test a different strategy, creating a third dataset by collecting news articles from seven specific newspapers renowned for the quality of their articles and in-depth analysis: The Atlantic, Foreign Affairs, Politico, The New Yorker, The Economist, The Wall Street Journal and BBC.
We retrieved links to 5,000 articles for each of them using an automated search across all Reddit posts, before proceeding with their scraping. In the end, we obtained 15,437 samples - a much lower number than the expected 35,000 caused by the presence of a large number of duplicate urls.
The samples were further diminished by checking their length and word count, once more putting a threshold at 100 characters and 20 words. Nevertheless, looking at their distribution, a spike was still visible towards the left, because of more than 1,000 articles having less than 50 words. Reading some of them, we presumed that this was caused by having scraped only their title or summary, but, as with low quality articles, we deemed those sufficient for our purposes, so we kept all the rows.
CHAPTER 5. DATA 32
Figure 5.8: The distribution of length and word count for articles coming from our selected newspapers, capped at 5,000 characters and 2,000 words to make the graphs easier to interpret.
5.3
Datasets for the automated fact-checking
sys-tem
One of the most crucial tasks we had to tackle was establishing the factuality of a text. In order to complete it, we built an automated fact-checking system whose structure can be summed up as follows:
1. Given a text, detect which sentences should be fact-checked 2. For each of these sentences, search online for related evidence
3. For each retrieved document, determine whether it supports or refutes the related sentence
We will be talking more about the second point in the following chapter. As for the others, we describe in the following two paragraphs the datasets used for both them.
5.3.1
Datasets for claim detection
A similar problem was studied inFavano and Carman 2019. In that paper, the authors employed two different datasets: one made of manually labeled sen-tences coming from 19 different political debates, fromAtanasova et al. 2019, and one, proposed by the authors, composed of a million newspaper headlines and random sentences from Wikipedia (the first to act as check-worthy sen-tences, the remaining to be used as negative examples). However, both of them
CHAPTER 5. DATA 33
Sentence Claim label
So we’re losing our good jobs, so many of them 0 When you look at what’s happening in Mexico, a friend of mine who builds plants said it’s the eighth wonder of the world
0 They’re building some of the biggest plants anywhere in the world, some of the most sophisticated, some of the best plants
0 With the United States, as he said, not so much 0
So Ford is leaving 1
You see that, their small car division leaving 1 Thousands of jobs leaving Michigan, leaving Ohio 1
They’re all leaving 0
Table 5.4: An extract fromAtanasova et al. 2019; reading the sentences, it’s debatable that some of them, especially the first one, are not classified as claim.
suffered from several limitations, which resulted in poor performances when models were trained or tested on them.
The dataset fromAtanasova et al. 2019used as discriminator betweeen claims and non-claims whether factcheck.org, a fact-checking organization, had made remarks on a sentence or not. We argue that this approach is limiting for various reasons. Firstly, fact-checking organizations are more likely to fact-check claims if they appear to be false, or at least dubious, while they’re less likely to do so if they appear to be truthful - to back this statement, we point to Figures 5.10 and 5.19, containing the number of truthful and false claims fact-checked by Politifact and various other publishers over the course of 10+ years. Moreover, inside a speech or a debate, primary sources for this dataset, whenever two or more claims are too similar to each other they will only be fact-checked in one case, leaving other sentences as erroneous negative examples (this same problem was brought up in the original paper as well). Another issue is that often fact-checkers prefer to focus on claims that are more specific, as those can be more easily confirmed or refuted by evidence, overlooking those that are more open to interpretation. Looking at a few samples from the dataset, reported in table 5.4, it’s possible to notice how these issues introduce an important amount of noise, which severely limits the quality of any model trained on this data. The other dataset, built from Wikipedia and newspapers headlines, suffers from a significant amount of noise as well. On inspection, several articles’ titles can hardly be considered claims, and vice versa. In addition to that, many of them
CHAPTER 5. DATA 34
present inconsistencies or grammar mistakes, perhaps due to how they were collected.
That’s why we decided to introduce a new dataset that could limit the amount of noise, while maintaining a clear division between claims and non-claims. Its building process was the following:
• check-worthy sentences were scraped from Politifact, collecting all the claims that have been fact-checked on the website in the past 10+ years • As for the negative examples, our idea was to use sentences taken from
nor-mal conversations. For this purpose, we found the Cornell Movie Dialogs Corpus9, a dataset of more than 300,000 lines pronounced by characters
in more than 600 movies
The first dataset contained 17,580 claims, obtained through the Politifact API10. During exploratory analysis, they didn’t show any particular pattern, with aver-age word count being 18 words (slightly more than the averaver-age English sentence) and an approximately normal distribution. Both are positive indicators, since they suggest that there is small noise in the data.
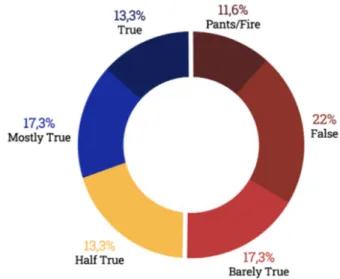
Figure 5.9: The distribution of length and word count for Politifact claims. As a side note, we explored the rest of the information contained in the dataset, reporting in Figure 5.10 the distribution of the ratings given by fact-checkers to each claim and in Figure 5.11 the number of claims pronounced by the 10 most fact-checked persons (or companies) on Politifact.
The other dataset is made of 304,713 utterances involving 9,035 characters from 617 different movies. To balance the ratio between positive and negative exam-ples, we reduced the latter in four different ways:
9http://www.cs.cornell.edu/cristian/Cornell Movie-Dialogs Corpus.html 10https://www.politifact.com/api/factchecks/
CHAPTER 5. DATA 35
Figure 5.10: The distribution of ratings on the Politifact dataset.
1. We removed sentences that were excessively long (more than 500 charac-ters)
2. We removed sentences coming from low-rated movies (less than a 7.1 score) 3. We removed sentences coming from fantasy, historic or sci-fi movies (to
avoid introducing any bias)
4. we randomly sampled among the remaining entries
The final result was a dataset of 26,710 rows. Analyzing them, we noticed a skewness towards the left in their length distribution, probably due to the large number of one-word sentences (like “Yes” or “No”) common in normal conversations.
In Figure 5.13, a comparison between the most used words in the two datasets is shown. The difference in the vocabulary is clearly visible, with Politifact using numerous politically-related terms, against the more common ones used in the movie dataset. Two of the most recurring words used in claims are “says” and
CHAPTER 5. DATA 36
Figure 5.11: The ten most common claimants in the Politifact dataset. The size of a circle is proportional to the number of fact-checked claims.
Figure 5.12: The distribution of length and word count for the lines from movies.
“said ”, which is not too surprising given that, in numerous cases, claims take a form similar to “He said that ”.
5.3.2
Datasets for agreement detection
For this task, we decided to resume the idea of scraping Politifact, extending it with multiple websites coming from around the world, using fact-checking articles with their fact-checked claim as examples of agreement and disagreement
CHAPTER 5. DATA 37
Figure 5.13: On the left, the most common words between all the claims; on the right, the most common ones between the movie lines.
(an article classifying a claim as false would be in disagreement with that claim, and vice versa).
To create the dataset, we used the following strategy (more details on the im-plementation are available in the appendix):
• Query the names of different politicians from several countries on the Google FactCheck API11 to gather a list of fact-checking websites • Query again the API, this time using the list of websites obtained in the
previous step, retrieving a list of claims and urls pointing to fact-checking articles from those websites.
• Scrape the articles thus found
On top of this, we integrated the data with articles extracted directly from Politifact through its own API. In the end, we built a dataset of 52,877 fact-checking articles, divided into 23 unique languages (though only 10 of them counting more than 50 samples) and 21 unique publishers (of which Politifact maintained the largest share, with more than 15 thousands entries). Each article was accompanied by the fact-checked claim.
After analysing the lengths of claims and related articles, we decided to remove all rows with claim length of more than 400 characters (removing roughly 0.42% of the total). We then did the same with articles less than 200 characters long (deleting only 0.02% of all rows). The final results appeared promising,
CHAPTER 5. DATA 38
Figure 5.14: The distribution of the fact-checking articles over the ten main languages.
Figure 5.15: The distribution of the fact-checking articles among the various publishers.
CHAPTER 5. DATA 39
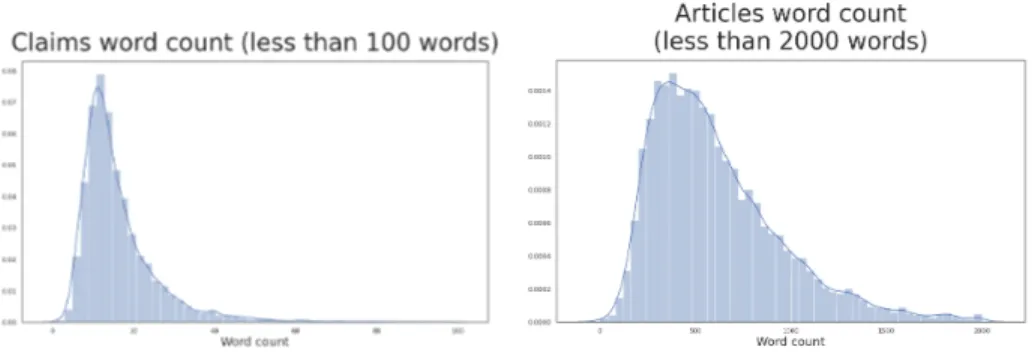
with the word count from the claims showing a normal distribution with mean at around 15 words (the average phrase length) and with the article bodies showing a slightly skewed normal distribution centered at around 550 words (approximately equivalent to a couple pages of this thesis).
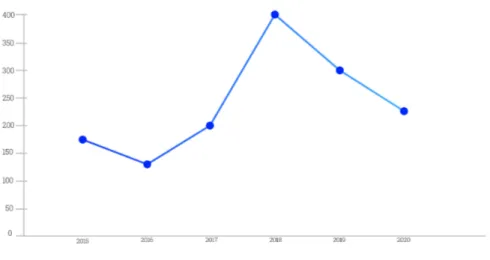
Figure 5.16: The distribution of the word count among claims and articles. In Figure 5.17, we show another interesting information: the distribution over the past five years of the claims from the top five languages. As we can see, English claims constantly increased in number between 2017-2020, probably due to an increase in the activities of fact-checking publishers, or maybe correlated to the increasingly inflamed political landscape in the United States. The pattern of Portuguese claims is intriguing as well. From being almost irrelevant in 2016-2017, they spiked in 2018, even surpassing English ones, and contending first place with them in 2019, before somewhat decreasing in 2020. Comparing this trend to the evolution of Brazilian politics (where most Portuguese articles come from), it’s reasonable to assume that it was related to the presidential elections held in the country at the end of 2018, which led to the election of controversial president Jair Bolsonaro, who entered in office precisely on January 1st, 2019. Most of the other languages tended to be irrelevant before 2019, which likely depends on how the Google FactCheck API retrieves information from newspapers, rather than external situations. Notable exceptions are the claims in Italian, always present from 2016 to 2020, with a peak in 2018, year of the last Parliamentary elections (Figure 5.18).
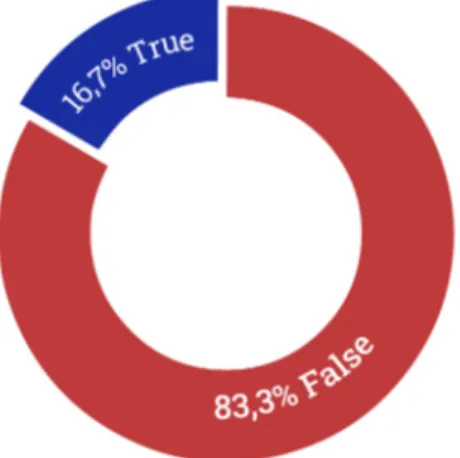
In Figure 5.19, it’s possible to observe that, similar to the dataset from Poli-tifact, the samples are characterized by a significant unbalance towards false claims (which, in our case, corresponded to disagreement examples). This ap-pears to further reinforce our speculation in section 5.3.1 about fact-checking organization prioritizing suspicious claims over truthful ones.
CHAPTER 5. DATA 40
Figure 5.17: The distribution of the fact-checking articles over the five main languages during the years 2015-2020.
Figure 5.18: Trend of the number of claims for Italian publishers in the years 2015-2020.
CHAPTER 5. DATA 41
Figure 5.19: The distribution of supporting and refuting fact-checking articles.
Lastly, we show the most used words in each language. It’s worth noticing how words like “covid ” and “coronavirus” are among the most used in almost every single language. Considering that this dataset was built in September 2020, containing articles up to 15 years old, it gives a very clear idea of how intensely the political debate all over the world was influenced by the pandemic. In addition to that, more similarities can be observed between different idioms, such as the frequency of the term “police”, the numerous references to photos or videos (due to many hoaxes being in the form of manipulated multimedia content) and the common mentions of political figures - signs that fake news have similar themes and similar ways of spreading even in different countries.
5.4
Datasates for the bias detector
The purpose of the bias detector was to establish whether a journalist is report-ing the information objectively inside the news he/she is writreport-ing. To build it, we collected three different datasets, training a text classifier on each of them and comparing their performances.