Italian National Agency for New Technologies, Energy and
Sustainable Economic Development
http://www.enea.it/en
http://robotica.casaccia.enea.it/index.php?lang=en
This paper is a pre-print. The final paper is available on:
dell’Erba, R. “Distance estimations in unknown sea underwater
conditions by power LED for robotics swarms”. Continuum Mech.
Thermodyn. 33, 97–106 (2021).
https://doi.org/10.1007/s00161-020-00889-x
Distance estimations in unknown sea
underwater conditions by power LED for
robotics swarms
Ramiro dell'Erba
ENEA Technical Unit technologies for energy and industry – Robotics Laboratory [email protected]
ORCID id 0000-0002-4857-4025
Abstract
The aim of this paper is to measure distances between autonomous underwater vehicles using power LED as light source and photodiode as receiver in unknown light water adsorption conditions. The method is based on the attenuation of the light signal, depending principally on distance and water characteristics. In a previous paper we proposed the use of a cheap power LED system to support acoustic devices in localization and configuration computation of an underwater robotics swarm. The idea was based on the exchange of light signals of different wavelengths, to reduce the noise, generated by LEDs; the unknown water conditions, affecting the light propagation, required a local measure of the absorption function a(λ) to obtain the distance between the source and the receiver. To avoid the use of many different wavelength LEDs we investigated the influence of power and flash duration on the LED spectral emission. Starting from this experience we are now able to measure distances without the unpractical local measure of the absorption function. In this paper we show as, modifying frequency, we shall be able to measure a(λ) and, consequently, the distance d.
Keywords
LED, Autonomous vehicle, underwater robot, distances measurement.
1. Introduction
ENEA is working in robotics since a long time (1961) and underwater robotics is a key topic of our laboratory [1]–[3]. Some years ago, (2006) we moved our attention from single autonomous underwater vehicle (AUV) to a swarm of very low cost cooperating robots. The use of underwater autonomous vessels or rovers has been proven to be a powerful tool in many submarine tasks for monitoring, exploration, search, rescue and many other applications but it still is expensive, because it requires the support of an equipped ship. To make AUV competitive with rovers many problems are still to be solved, especially about power availability, information processing, navigation, and control [4], [5], [6].
Performances improvement of AUV can be achieved using of a large number of low cost cooperating mini AUV, [7]. In fact a swarm is able to perform tasks in a more fast and robust way with respect of a single machine. Perhaps the most important feature of a swarm is its capability to span from the surface to the basement; this allows ensuring a quasi-real time communication with the human operator and, therefore, to interact with the underwater system using a remote console that can be locate also on the coast. The swarm allow realizing a multi-hop submarine network where the nodes of the net are the elements of the swarm Therefore we are dealing with a variable geometry network. This could limit the use of the expensive surface ships to the deployment phase, taking advantage of the parallel exploration to shorten times and have many other advantages [5], [8]. As example other advantages, using a swarm approach, lies in the speed-up coming from the parallelism and in the increase of reliability by redundancy [9]; the lack of one member can be easily managed by redistributing the job among the others like, in natural systems, for the bees [10]. Last, but not least, a swarm can interact with a human operator as a single object, without the problem of controlling a large number of individuals, once a swarm control layer it has been developed.
The concept of robot swarms is a study theme by the scientific community since several years. The realization of swarms using a different numbers of cooperating robots has been successfully tried [11], [12], [13], but in underwater environment it is still a challenge [14], [15], [16].
One of the most important tasks for an underwater vehicle is its localization into the sea; a swarm has the supplementary task to know its geometric configuration, which means to be aware of the relative position of some other robots, typically the neighbours is enough. To get absolute localization of the whole swarm at least one element of the swarm must have a
precise localization. Therefore one element comes out on the surface to fix its position by GPS; that of the other swarm elements are computed from the knowledge of the relative position between them. The knowledge of the geometric configuration is a very important issue for many applications; it often is depending by the assigned task that can also be changed during the mission [17]. One of the reasons to vary the geometric configuration is to have the most efficient perception (in general meaning, vision, acoustical data, magnetic measurements) of the surrounding environment; but there are also needs connected with the optimization of internal and external channel communication network. This knowledge was, in a first release of underwater network, achieved using the time-of-flight of a dedicated acoustic modem to obtain the distance among the first neighbours. Unfortunately it is well known as reflections, fading and other phenomena make difficult and sometimes not reliable measurements that are involving acoustic devices. The need to continuously exchange data among the nodes, to get the distances, represents a considerable burden for the network operation. In fact to calculate the network configuration, also using suitable algorithms [1], forces to frequent short messages that strongly deoptimize the exploitation of the communication channel, mainly for the long times needed to switch from a message to another one. A possible solution, which improves both the time allocation, in the acoustical protocols, and unloads the acoustical channel burden, is to couple the acoustic protocol with an optical device. The intention is to collect distances measurements between the robots more precise, using sensor data fusion.
Optical methods are very powerful but their performances are strongly affected by many variable parameters like salinity, turbidity, the presence of dissolved substances that change the colour and the transparency of the water in all the optical bands. Moreover the presence of solar radiation, in shallow water, heavily affects the signal to noise ratio. Our current approach uses a mixed strategy based on the variable exploitation of the optical channel depending on the environmental conditions. In favourable conditions the transmission protocol will freely decide which channel to adopt depending on the priority, i.e. distance-to-cover and dimension of the message itself. In less favourable conditions the optical channel will be limited to the fundamental synchronization task, generating a light lamp that will optimize the message passing through the optical channel. Any way backup solutions, based on the “all acoustical” approach, must remain available because there is the possibility to meet dirty waters with no practical possibility to use light signals.
It must be outlined that only dense swarms can take advantage of such approach because only in these situations, with internal distances ranging from few meters to a maximum of 20 meters, there are the conditions suitable to use light signals for sync and measurements. A further extension of the problem presented here can be performed by considering the interplay between swarm robotics and newly conceived materials, the so-called metamaterials. Some examples of these materials can be found in [18], [19], [20], [21], [22].
2. State of the art
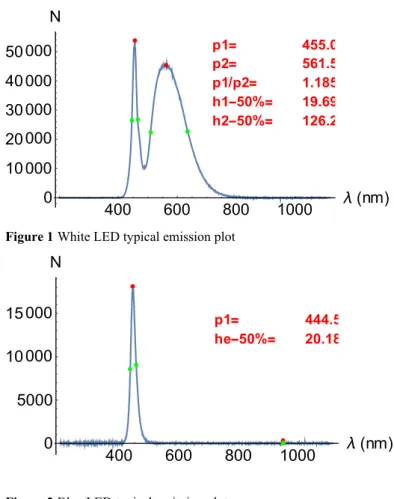
In a previous paper [23] we have considered cheap power LED to build an optical modem and tried to stress power supply and flash duration to vary light emission characteristics; examples of typical emission are shown in Figure 1 and Figure 2. Note that the white light is obtained by fluorescence of coating using a blue LED, as can be deducted by the presence of a double peak in the plot. We are strongly interested in the variation of the emission peak with the power supply; the reason is economical. Because we are thinking in terms of a swarm if we use a complex variable frequency LED the cost can increase rapidly owing to the large element number of the swarm. Therefore, we want to be able to modify, in a little range, the frequency of the peak emission by the power tension, using a cheap LED and use this variation for our aims. The peak emission vs. power supply has been measured and the results are shown in Figure 3 for the white LED and in Figure 4 for the blue LED. The work has been performed by instrument with a resolution of 0.5 nm wavelength. We did this experimental job because the LEDs technical specifications from data sheet were referred to the static features of electric power and luminance so we had the need to carry on a more precise characterization of these diodes to study their applicability in signaling and communication.
Because the water adsorption is generally unknown in the old paper we performed a local measurement of the adsorption coefficient on the known head-tale distance, and use it to compute the unknown distances between the robots. This implies we have a LED emission on the head of our torpedo like robot and a photodiode on the tale. This determines constructive problems of the optical modem so far, we studied to got rid of this architecture and we are now able to measure AUVs distance just performing more measurements in different conditions instead of the head-tale measurement. So far, we stress emission to get information useful to model water attenuation coefficient and, consequently, the distance.
Figure 1White LED typical emission plot
Figure 2Blue LED typical emission plot.
Figure 3 White LED first peak shift value vs. power tension.
Figure 4 Blue LED peak shift vs. power tension.
p1 455.06 p2 561.5 p1 p2 1.1852 h1 50 19.69 h2 50 126.23 400 600 800 1000 nm 0 10 000 20 000 30 000 40 000 50 000 N p1 444.52 he 50 20.18 400 600 800 1000 nm 0 5000 10 000 15 000 N 25 30 35 40 45 50Volts 440 445 450 455 460nm 14 16 18 20 22 24 26 28Volts 440 441 442 443 444 445 nm
3. Our prototype
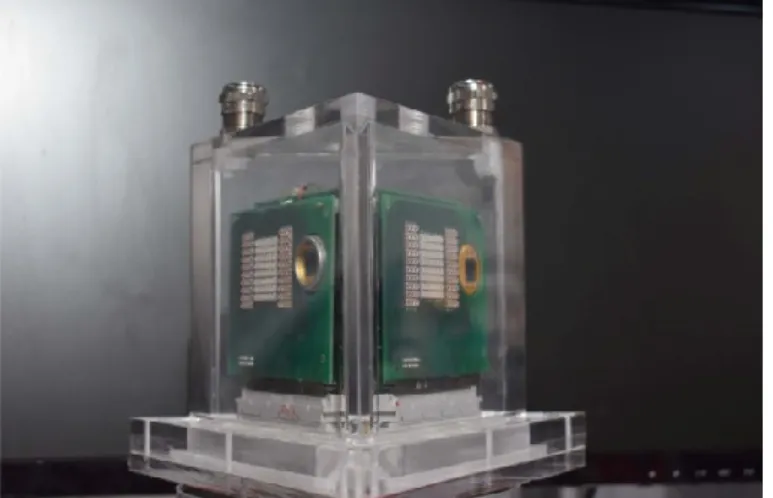
In Figure 5 and Figure 6 the optical modem prototype and the robot swarm element, realized in our laboratory, are shown. Robot’s characteristics are the following: Max depth 100 m; Max speed 4 km/h; Weight about 20 kg; Autonomy 3hrs; Dimensions are 1.20 m X 0.20 m diameter. Standard sensors include a stereoscopic camera, sonar, accelerometer, compass, depth meter. Remember that we are dealing with a system thought as to be a component of a swarm of about 20 objects, so the distances between robots are between 3 and 50 m. Therefore, the maximum distance possible between two robots is about 1000 m, as a very particular alignment case; the average value of the distances of the neighbors is considered about 10 m. In underwater world a severe limitation to our communications technology is, perhaps, the main drawback: the physical medium only permits acoustical channels, since electromagnetic waves are rapidly damped [24]. The acoustical technology has limited performances; the band pass increase with the frequency but the signal is more rapidly damped, limiting useful range [25]. Technology of dense swarms is an answer to these problems with larger acoustical bands and allowing other physical channels, like optical, to be exploited. This paper explores the opportunities offered by simple and economical optical sources to perform swarm localization and communication.
Figure 5 Optical modem. Square white Led, rectangular blue LED and circular photodiode are visible. To cover 360° three
systems are implemented.
2. Theoretical approach to the problem
Transmission of an electromagnetic wave through a material is governed by its electric and magnetic properties as described by Maxwell’s equations. The response of a material to an electromagnetic field is described by the frequency-dependent dielectric and magnetic tensorial parameters. Light propagation in a medium induces a medium response because of interaction of light with electrons and nuclei in the medium. The medium response to this interaction affecting the light propagation and generating various optical effects. This response, in the case of a sufficiently weak field can it be regarded as linear.
Light absorption by a medium, as a function of distance from the source and the wavelength, is a well-known phenomenon. In a first approximation, for a planar wave, like in case of laser source, we can assume an exponential law for the decay of the signal intensity.
I = I0 e−a(λ)d (1)
Where I is the measured intensity signal at the distance d, I0 the emitted intensity, a(λ) the absorption function typical of the medium.
In the case of spherical wave, owing to the energy balance I =I0 e
−a(λ)d
d2
(2)
Where I is the intensity measured on the receiving surface unit. Typically, you have to consider a more complicate shape emission diagram for the LED diode described by a shape function f(ϑ,φ) in front of the fraction; in our case the LED have an emission of 60°x60° therefore the energy is spread on this solid angle. The a(λ), describing how the signal is attenuated as function of the wave length lambda, is strongly affected by the water conditions as can be seen in Figure 7 whose data are due to the courtesy of [26]; it is possible to see as, in clear water that means lower a(λ) value, this function has a minimum and high visible frequency are adsorbed less than lower. For some useful results in the field of wave propagation, also in generalized media, one can refer to the following papers [27], [28], [29], [30], [31], [32], [33].
The measured intensity, owing to the spread of the LED emission, is the integral, over all the wavelengths of the equations 1 and 2. We are assuming that water characteristics do not vary in the volume containing the robots. The problem we are facing is how to measure the absorption function and the distance by our measurements. To this aim we distinguish two cases.
In the first case the wave can be considered planar and the measurements are performed in a short time range so we can consider fixed the robot position; we only stress the diode emission.
In the second case the wave is spherical and we can move the robots during the measurements.
Working on Eq.1 and Eq.2 we can note that in planar wave case to move the robots in two different and unknown position only allow us to obtain the ratio d1/d2 but give not information on the a(λ) function. In the same way we are not able to obtain separate information on a(λ) and d in spherical wave case without the device’s displacements.
Before starting we try to have an idea about the orders of magnitude of the attenuation in our case of interest. In we consider a distance of 10 m, a radius of receiving photodiode of 0,02 m and the case of clear water (a(λ) about 0.02 m-1) we get a
signal attenuation of 10%; for the planar wave and 20% for the spherical one. We have considered 1/3 as shape factor for the spherical wave because the Led emission diode is not omnidirectional. In case of turbid water (a(λ) about 0.2 m-1) the
Figure 7 Light absorption in sea water in different condition [26].
Consider now the case where distance between the robots cannot be varied and we are working with a planar wave. There is no way to obtain, a(λ) and d separately by a simple measure if the intensity I or working on a measurement set. This because the two objects are linked by multiplicative way and the exponential function. We always get the product. Anyway, stressing power, we can measure its derivative with frequency.
𝜕𝐼
𝜕𝜆= −𝑎′(𝜆)𝑑𝐼0 𝑒
−𝑎(𝜆)𝑑 (3)
Where δλ is referring to the peak shift of the LED as measured in Figure 3 and Figure 4. Dividing by the intensity, I, and multiply the Log of the intensity we can obtain the differential equation
𝑎′(𝜆) 𝑎(𝜆) = 1 𝐼 𝐿𝑜𝑔(𝐼 /𝐼0) 𝜕𝐼 𝜕𝜆 (4)
And in the same way 𝑎(𝜆1)
𝑎(𝜆2)=
𝐿𝑜𝑔(𝐼(𝜆1) /𝐼0) 𝐿𝑜𝑔(𝐼(𝜆2) /𝐼0)
(5)
The ratio is available for any couple of frequency we are able to generate.
The differential Equation (Eq.4) could be integrated but we do not know any Cauchy condition a(λ0) and the ratio (Eq.5)
cannot be useful to suggest it. The problem is stiff so we are still no able to separate and obtain the parameters of the equation. If we consider the frequency range between 440 nm and 460 nm, where we are able to operate, we can ask the following question: Does exist a simple model, depending by parameters, able to fit any water conditions a(λ) (as showed in Figure 7) in that range? And if it exists, are we able, with our measurements, to obtain the parameters? The answer is yes but only if the model keeps separate the two parameters by not multiplicative operation. So far, the idea is to find a simple model (avoiding the multiplicative presence of a(λ) and d) to characterize water, estimate its parameters by our measurements and obtain a(λ) and d separately. In fact, first attempt we tried to fit by a straight line with a common point, but this way was unfruitful. A linear model a(λ) =m λ+n, for each curve of Figure 7, is not useful because the derivate ratio and the two-frequency ratio are depending not by the two parameters but only by their ratio, m/n, so we have no chance to recover them separately. Another attempt, to fit the curve of Figure 7, in the range of our interest, was tried by the model Exp(rλ +q); from Eq. 4 we obtain r but there is no way to obtain q because the ratio in the two different wavelength eliminate it.
400 450 500 550 600 650 700
nm
0.001
0.010
0.100
1
a
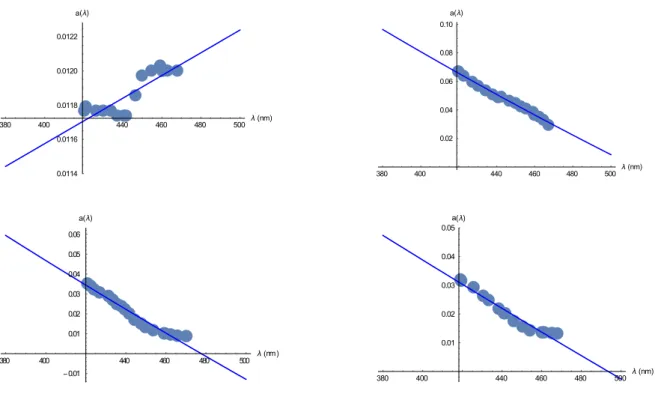
We used therefore the model Exp(rλ)+q to avoid this problem and obtain a linear behavior. In Figure 8 the fit is showed for some different water quality, in the range 420 nm and 470 nm. Note that in clear water the slope is positive.
Figure 8Some examples of fitted coefficient adsorption for different water condition.
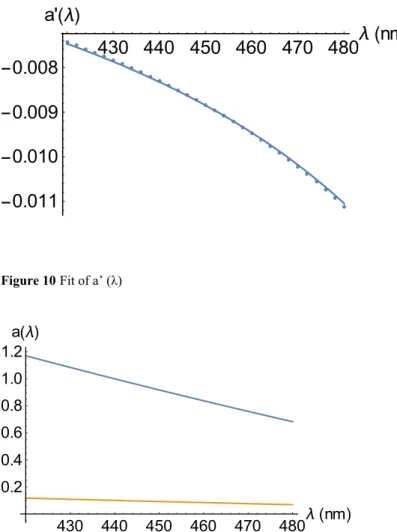
We could think to fit the two parameters of the model in the same time using the equations 4 and 5. This means we have to generate a mixed function to be fitted, taking in account the two equations that are expression of two conditions. Unfortunately, it is well known as the fit would is affected by a huge error, owing to the presence of derivative; we have tried to verified this result and we obtained a good fit for Eq. 4 and Eq. 5 separately but not for the function a(λ). As example we have fitted the ratio a(λ1)/a(λ2) and the a’(λ)/a(λ) (See Figure 9 and Figure 10) by combining the two set of data and using a combination of the model functions able to satisfy in the same time all the conditions. From the figures the results are nice, but if you derive the a(λ) the result is totally unsatisfactory, as can be seen from Figure 11.
Figure 9Fit of a(λ1)/a(λ2).
380 400 440 460 480 500 nm 0.0114 0.0116 0.0118 0.0120 0.0122 a 380 400 440 460 480 500 nm 0.02 0.04 0.06 0.08 0.10 a 380 400 440 460 480 500 nm 0.01 0.01 0.02 0.03 0.04 0.05 0.06 a 380 400 440 460 480 500 nm 0.01 0.02 0.03 0.04 0.05 a 420 430 440 450 460 470 480 nm 0.7 0.8 0.9 1.0 1.1 a 1 a 2
Figure 10Fit of a’ (λ)
Figure 11Fit of a(λ). The yellow is the real and the blue the unsatisfactory obtained fit. Note that the results are not depending from the choice of λ1.
Therefore, we have to fit the two parameters separately. To have success we can get q from Eq. 4 and, consequently, r from Eq. 3.
Many simulations, including the presence of random errors, have been performed obtaining good results. The simulations have been generated starting with known a(λi) and d and computing the values of a(λi)/a(λ1) and a’(λi)/ a(λ) for different value of λi and λ1. We added some random errors to the values. Later, from these values, we fit the vales of a(λ) and d founding agreement inside 10% using all water conditions.
Remember that this system is thought to give an approximation of the absorption coefficient a(λ) that can be iteratively improved by successive measurements and/or successive repeated computing.
The case of spherical wave and mobile robots is more realistic and interesting.
We have considered the possibility to move the robots to vary their unknown distance but we still need to vary wave length to obtain a(λ). The derivative of Eq. 2 gives as the product a’(λ) d. Computing it for two, unknown, distance d1 and d2 we can obtain the ratio d1/d2 that is what we need. So far, considering the ratio of Eq. 2 for the two distances, we can obtain the product a(λ)d1. Now, considering the Log of Eq. 2 we have a(λ)d1 +Log(d1) and consequently d1, without any model of a(λ) as done in the preceding case. See at equation (6) and (7).
𝜕𝐼 𝜕𝜆= −𝑎′(𝜆)𝑑𝐼0 𝑒−𝑎(𝜆)𝑑 d2 (6)
430 440 450 460 470 480
nm
0.011
0.010
0.009
0.008
a'
430 440 450 460 470 480 nm 0.2 0.4 0.6 0.8 1.0 1.2 a𝐼(𝑑1) 𝐼(𝑑2) =𝑑2 2 𝑒−𝑎(𝜆)𝑑1(1−𝑑𝑑21) 𝑑12 (7)
Experimental measurements into the Bracciano’s lake are in progress to verify the real possibility to estimate extinction coefficient a(λ) and the distance d. Source of errors and imprecision are many. This method must be considered as an iterative method whose precision is increasing with many measurements. These measurements must be integrated with some other source like acoustic, as usual in robot science. The use of more than one LED suddenly increase precision [23]. Working on the ratio Ii/Ij of the different frequencies we can enhance our measurements because the measured ratio (or a functional form) current by the photodiode remains more stable with respect of that of a single source. The need to have more than one device can be understood intuitively from the wider dynamic available as function the distance at which the signal was collected. Because of the absorption mechanism and on the degradation of the water transparency the choice of the frequencies that can give the maximum sensitivity can change. We are currently selecting sources and classifying standard water qualities, to determine the most suitable functional (i.e. the mentioned intensity ratio) and the approach LED as to the maximum sensitivity of the system. By this way we can be much less sensitive from the variation of the function a(λ) and to get an indication of the water pollution degree by comparing the values of the single wavelengths with their ratio.
2. Conclusion
This work was written in the frame of cheap underwater swarm robots we are developing in our laboratory. In a swarm the knowledge of its internal configuration is fundamental both for communication between the elements and to adapt its geometry configuration to the mission task. In a preceding paper we have shown as obtain the configuration using the knowledge of the distances between the elements; this is known as a geometry distance problem. In this paper we have presented as a set of commercial cheap LED diodes could be a valid aid, to an acoustic device, to measure distances between them. Modifying power tension, we are able to influence LED’s emission peak. The stress of the LED emission peak gives as the opportunity to measure the local, unknown, light adsorption function of the water and, consequently, the distance between the robots. This allow us to avoid the use of expensive variable frequency LED. This research is a collateral effect due to the development of a hybrid acoustic/optical modem, based on the use of cheap commercial LEDs, we are carrying on. These measurements can be used to build the swarm configuration and the relative velocities between its elements. We could use more than one LED with different wavelength; this allow us to reduce experimental errors and increasing the sensitivity of the signal in distance measurements, by enlarging the responsivity dynamic. The use of two or three LEDs of different color enhances dinamic of the measurements increasing the precision of the results. Calculations of the distances in a simulated way show that the error on estimated distance can be significantly reduced.
Many questions are still open like a better management of the LED’s emission to render a single light source similar to a multi-source in a controlled way. The work is in progress in our laboratory with experimental campaign into the Bracciano’s lake, close to our laboratories.
![Figure 7 Light absorption in sea water in different condition [26].](https://thumb-eu.123doks.com/thumbv2/123dokorg/5593740.67434/7.892.60.516.103.362/figure-light-absorption-sea-water-different-condition.webp)