Cellular/Molecular
The Odorant Receptor-Dependent Role of Olfactory Marker
Protein in Olfactory Receptor Neurons
Michele Dibattista and Johannes Reisert
Monell Chemical Senses Center, Philadelphia, Pennsylvania 19104-3308
Olfactory receptor neurons (ORNs) in the nasal cavity detect and transduce odorants into action potentials to be conveyed to the olfactory bulb. Odorants are delivered to ORNs via the inhaled air at breathing frequencies that can vary from 2 to 10 Hz in the mouse. Thus olfactory transduction should occur at sufficient speed such that it can accommodate repetitive and frequent stimulation. Activation of odorant receptors (ORs) leads to adenylyl cyclase III activation, cAMP increase, and opening of cyclic nucleotide-gated channels. This makes the kinetic regulation of cAMP one of the important determinants for the response time course. We addressed the dynamic regulation of cAMP during the odorant response and examined how basal levels of cAMP are controlled. The latter is particularly relevant as basal cAMP depends on the basal activity of the expressed OR and thus varies across ORNs. We found that olfactory marker protein (OMP), a protein expressed in mature ORNs, controls both basal and odorant-induced cAMP levels in an OR-dependent manner. Lack of OMP increases basal cAMP, thus abolishing differences in basal cAMP levels between ORNs expressing different ORs. Moreover, OMP speeds up signal transduction for ORNs to better synchronize their output with high-frequency stimulation and to perceive brief stimuli. Last, OMP also steepens the dose–response relation to improve concentration coding although at the cost of losing responses to weak stimuli. We conclude that OMP plays a key regulatory role in ORN physiology by controlling multiple facets of the odorant response.
Key words: olfactory; olfactory receptor neurons; olfactory signal transduction
Introduction
The olfactory system gathers information from many distinct odorants present at a given point in time and space. For odorants
to be detected by olfactory receptor neurons (ORNs) in the nasal cavity, mammals sample environmental odors by changing their breathing frequency between 2 and 10 Hz (Youngentob et al., 1987;Tankersley et al., 1994;Kepecs et al., 2007). ORNs should then be tuned to ensure an appropriate range of odorant sensi-tivity and have kinetic properties that allow them to fire action potentials (APs) to reliably encode for natural stimuli in the be-having animal.
Odorants bind to olfactory receptors (ORs) expressed in the cilia of ORNs. ORs are G-protein-coupled receptors expressed in a monogenic fashion (Buck and Axel, 1991;Malnic et al., 1999) so that each ORN expresses one OR type among⬃1000 in the mouse genome. Activated ORs initiate signal transduction by activating the G-protein Golf (Jones and Reed, 1989), which in turn activates adenylyl cyclase type III (AC3;Bakalyar and Reed, Received Nov. 23, 2015; revised Jan. 25, 2016; accepted Feb. 4, 2016.
Author contributions: M.D. and J.R. designed research; M.D. performed research; M.D. and J.R. analyzed data; M.D. and J.R. wrote the paper.
This work was supported by National Institutes of Health (NIH) Grant DC009613 (to J.R.) and by Grant G20OD020296 (for infrastructure improvement at the Monell Chemical Senses Center). Immunohistochemistry and confocal microscopy was performed at the Monell Histology and Cellular Localization Core and genotyping was performed at the Monell Genotyping and DNA/RNA Analysis Core, which are supported, in part, by funding from the NIH National Institute on Deafness and Other Communication Disorders Core Grant 1P30DC011735-01. The authors thank Drs. Graeme Lowe, Anna Menini, and Simone Pifferi for helpful discussions and comments on the manuscript; Dr. Kazushige Touhara for providing the mOR-EG-GFP mice; and Amanda Miller for expert technical assistance. We are also grateful to Dr. Frank Margolis for commenting on the manuscript and providing the OMP KO mice.
The authors declare no competing financial interests.
Correspondence should be addressed to Johannes Reisert at the above address. E-mail:[email protected]. M. Dibattista’s present address: Department of Basic Medical Sciences, Neuroscience and Sensory Organs, Uni-versity of Bari “A. Moro,” Bari, Italy.
DOI:10.1523/JNEUROSCI.4209-15.2016
Copyright © 2016 the authors 0270-6474/16/362995-12$15.00/0 Significance Statement
Odorant receptors (ORs) form the largest family of G-protein-coupled receptors in mammals and are expressed in olfactory receptor neurons (ORNs). In this paper we show how the olfactory system ensures that monogenic expression of ORs dictates the response profile and the basal noise of ORNs. Olfactory marker protein (OMP), a protein long known to be expressed in mature ORNs, is responsible for controlling appropriate cAMP homeostasis and dynamics to ensure that the expressed OR is the main source of noise. In addition, OMP regulates the dynamic range of ORNs in an OR-dependent way to allow for concentration-dependent odor coding.
1990) to facilitate the conversion of ATP to cAMP. The ciliary cAMP increase opens the olfactory cyclic nucleotide-gated (CNG) channel (Nakamura and Gold, 1987;Firestein et al., 1991) and influx of Na⫹and Ca2⫹(Dzeja et al., 1999) causes ORN depolarization. Ca2⫹triggers the activation of the second olfac-tory transduction channel, an excitaolfac-tory Ca2⫹-activated Cl⫺ channel TMEM16B/ANO2 (Kleene, 1993;Lowe and Gold, 1993; Stephan et al., 2009; Hengl et al., 2010; Rasche et al., 2010; Sagheddu et al., 2010;Billig et al., 2011). Transduction leads to the generation of APs to convey odor information to the olfactory bulb (OB). Mammalian ORNs fire APs at increasing frequency as the odor concentration increases, while the number of fired APs first increases up to intermediate odor concentrations and then decreases at higher concentrations (Gesteland and Sigwart, 1977; Reisert and Matthews, 2001;Rospars et al., 2008).
For the odorant response to terminate, cAMP and Ca2⫹must return to basal levels for CNG and Cl⫺channels to close. Ciliary Ca2⫹reduction is achieved by a Na⫹/Ca2⫹extrusion (NCKX4; Stephan et al., 2012). Interestingly, the rate of cAMP degradation is not controlled by the olfactory phosphodiesterases (PDEs) 1C and 4A as neither PDE contributes significantly to response ter-mination (Boccaccio et al., 2006;Cygnar and Zhao, 2009).
So what mechanisms control olfactory kinetics? Olfactory marker protein (OMP), a protein thought to be exclusively ex-pressed in mature ORNs (Margolis, 1972), has been shown to be involved in olfactory kinetics. Interestingly, OMP was recently found to be expressed in other nonolfactory tissues, often with ORs and AC3 (Kang et al., 2015). Electro-olfactograms from OMP knock-out (KO) mice have slower onset and decay kinetics compared with wild type (WT;Buiakova et al., 1996). Single-cell recordings from isolated OMP KO ORNs showed that ORNs’ ability to fire APs was also altered (Reisert et al., 2007). OMP speeds up signal transduction by acting upstream of cAMP pro-duction, probably at the level of AC3. Recordings from ORNs expressing the MOR23 OR showed that OMP KO ORNs have a broadened odorant selectivity (Lee et al., 2011), which probably lead to synaptic inputs to more glomeruli in the OB (Kass et al., 2013). Behaviorally, OMP KO mice have deficits in their ability to detect and discriminate odorants (Youngentob and Margolis, 1999;Youngentob et al., 2001,2003).
Here we investigate how OMP affects ORN physiology and limits the speed of olfactory transduction. We found that OMP affects transduction kinetics in an OR-dependent manner, most likely depending on the basal activity of the OR expressed in a given ORN (Reisert, 2010;Nakashima et al., 2013). Additionally, the slow response kinetics of OMP KO ORNs severely dampens their ability to reliably encode odorant stimuli at higher stimulus frequencies. Finally, we show that OMP has a thresholding func-tion in ORNs that can “filter out” stimuli at lower concentrafunc-tions and endow ORNs with a narrow dynamic range.
Materials and Methods
Animals. Mice (2 to 6 months old of either sex) were killed using CO2
followed by decapitation as approved by the Monell Chemical Senses Center Institutional Animal Care and Use Committee, conforming to National Institutes of Health guidelines. The olfactory epithelium was removed from the nasal cavity and stored in oxygenated Ringer’s solu-tion at 4°C until use. A small piece of olfactory epithelium was dissected out from the underlying cartilage, placed in an Eppendorf tube contain-ing 200l of Ringer’s solution, and gently vortexed (Reisert and Mat-thews, 2001;Ponissery Saidu et al., 2012). The resulting cell suspension containing isolated ORNs was then transferred to a recording chamber on an inverted microscope and allowed to settle for 20 min before bath perfusion started. Isolated ORNs were recognized by using fluorescence
optics. The GFP-labeled M71 mouse line was generated by inserting IRES-tauGFP after the mouse M71 coding sequences (Bozza et al., 2002). The mOR-EG-GFP line was made using a transgene consisting of 3.0 kb upstream of the mOR (mouse olfactory receptor)-EG transcription start site followed by mOR-EG-IRES-gapEGFP (Oka et al., 2006). These mouse lines were crossed with the OMP KO line (Buiakova et al., 1996) and bred to obtain OMP WT and KO mice in a M71-IRES-tauGFP homozygous and mOR-EG-IRES-gapEGFP hemizygous background respectively.
Suction pipette recordings. We used the suction-pipette technique
(Baylor et al., 1980) to record from isolated ORNs (Lowe and Gold, 1991;
Ponissery Saidu et al., 2012). The suction-pipette technique provides superbly long and stable recording durations. The cell body of an isolated mouse ORN was drawn into the tip of the recording pipette, leaving the cilia exposed to the bath solution and accessible to solution changes. In this recording configuration, the recorded current (termed suction cur-rent) represented the transduction current, which enters at the cilia and exits at the cell body. In addition, since the intracellular voltage is free to vary, ORNs generate APs at the onset of the suction current, which are also recorded as typically biphasic, fast capacitance current transients. The suction current was filtered at DC 5000 Hz (⫺3 dB, eight-pole Bessel filter), a bandwidth wide enough to faithfully record the fast APs. The slow receptor current was isolated by filtering the suction current with a bandwidth of DC 50 Hz (⫺3 dB, eight-pole Bessel filter). The recorded suction current was sampled at 10 kHz. Currents were recorded with a Warner PC-501A patch-clamp amplifier, digitized using a Power1401 II analog-to-digital converter and Signal acquisition software (Cambridge Electronic Design).
Solutions and solution exchange. Mammalian Ringer’s solution
con-tained (in mM) the following: 140 NaCl, 5 KCl, 1 MgCl2, 2 CaCl2, 0.01
EDTA, 10 HEPES, and 10 glucose. The pH was adjusted to 7.5 with NaOH. Acetophenone (the ligand of the M71 odorant receptor) and eugenol (the ligand of the mOR-EG odorant receptor) 20 mMstock
solution in dimethyl sulfoxide (DMSO) were prepared fresh the day of the experiments. The odorant solutions were prepared by dilution in Ringer’s solution to the final concentration. Niflumic acid and 3-isobutyl-1-methylxanthine (IBMX) were used at concentrations of 300 and 1 mM, respectively, by dissolving them directly into Ringer’s solution
without the use of DMSO. All chemicals were purchased from Sigma-Aldrich. The forskolin analog NKH 477 (Tocris Bioscience) at 40Mwas
dissolved in Ringer’s solution and freshly prepared the day of the experiment.
Fast solution changes and odorant exposures were achieved by trans-ferring the tip of the recording pipette containing the ORN across the interface of neighboring streams of solutions using the Perfusion Fast-Step solution changer (Warner Instrument). Solution exchange was complete within 7 ms, as determined from the 10 –90% rise or fall time of a junction current, which was elicited by stepping between solutions of different ionic content. All experiments were performed at mammalian body temperature (37°C). Solutions were heated just before entering the solution changer by a solution heater based on work byMatthews (1999).
Data analysis. The basal firing rate was determined from 30 s
record-ings taken at the beginning shortly after establishing the recording con-figuration. Typically the ORN had only been exposed to a single 1 s exposure of its respective ligand to avoid possible adaptation effects. All APs over the 30 s period were counted, and this number was divided by 30 s to obtain the mean basal spike frequency. The frequency composi-tion in the absence of stimulacomposi-tion and in the presence of niflumic acid was evaluated by performing power spectra analysis on single 30 s record-ings using IGOR (Wavemetrics) and Clampfit Software (Reisert, 2010). The variance was calculated as the difference of the power spectra in the absence and presence of niflumic acid of unfiltered traces (0 –5000 Hz) and subsequently integrated from 0.3 (used as cutoff to exclude slow baseline drifts) to 50 Hz.
Data are presented as mean⫾ SE (SEM). Statistical tests are specified in the text and were performed using R software.
Immunohistochemistry. Mice were anesthetized with avertin (12.5 mg/
ml) and intracardiac perfusion was performed. First, animals were per-fused with PBS followed by ice-cold paraformaldehyde 4% w/v in PBS,
pH 7.4. The OB was extracted and postfixed for 2 h. Tissue was then placed in 30% (w/v) sucrose and left overnight at 4°C for cryoprotection. Twelve-micrometer-thick sagittal sections were cut on a cryostat and stored at⫺20°C. Tissue sections were incubated with 0.5% SDS (v/v) in PBS for 30 min for antigen retrieval, then incubated in blocking solution (3% BSA, 0.3% Triton X-100 in PBS) for 90 min, and incubated over-night at 4°C with goat anti-neuropilin 1 (1:100; AF566, R&D Systems) primary antibodies diluted in blocking solution. After rinsing in 0.1% (v/v) Tween 20 in PBS, sections were incubated with Alexa donkey anti-goat 555 secondary antibodies in 0.1% Tween 20 in PBS for 2 h at room temperature and washed. Four⬘-6-diamidino-2-phenylindole (0.1 g ml⫺1) was used to counter-stain nuclei. Tissue sections were
incu-bated for 30 min then washed and mounted with Vectashield (Vector Laboratories).
All images were taken with Leica SP2 confocal microscope at a resolu-tion of 1024⫻ 1024 pixels. Only images inFigure 8were manipulated by cropping and adjusting brightness and contrast with ImageJ (National Institutes of Health) for the purpose of illustration. Intensity values were obtained by averaging pixel intensities in each glomerulus (defined as the stained area surrounded by periglomerular cells) and subtracting the background defined as the intensity values of an arbitrary region of in-terest in the external plexiform layer.
Results
The lack of OMP alters the kinetics and amplitude of odorant responses
We sought to determine how OMP affects the odorant response in ORNs expressing known odorant receptors. We generated two OMP KO lines that also expressed GFP with either the M71 or the mOR-EG receptor with acetophenone and eugenol being the re-spective ligands (Bozza et al., 2002;Kajiya et al., 2001). Those two
ORs were selected because they have dif-ferent rates of constitutive activity (Re-isert, 2010;Nakashima et al., 2013) that drives basal levels of transduction current fluctuations with consequent AP firing. ORNs expressing M71 or the mOR-EG show high and low levels of basal noise respectively (Reisert, 2010;Connelly et al., 2013;Nakashima et al., 2013).
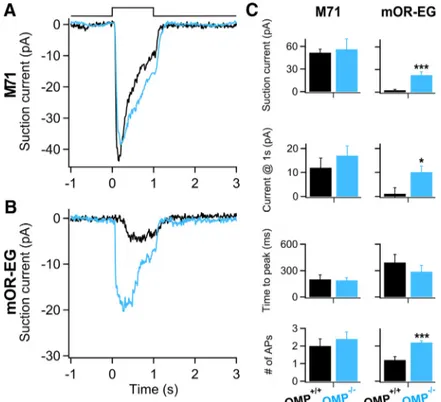
In both M71 and mOR-EG WT ORNs, a 1 s odorant exposure generated a rapidly increasing current response, which de-cayed after reaching its peak and termi-nated quickly once odorant exposure ceased (Fig. 1A, B, black traces). In OMP
KO ORNs, the response kinetics (Fig. 1A, B, blue traces) were slower in both
M71 and mOR-EG OMP KO ORNs. The slowed response kinetics in OMP KO mice is in agreement with what was shown previously in randomly picked ORNs, where it was not possible to determine which OR they expressed (Reisert et al., 2007), and in MOR23-expressing ORNs (Lee et al., 2011).
For both M71 and mOR-EG ORNs, the latency, time to peak, and the time for the response to fall to 20% of the current value at the end of 1 s stimulation (t20) were significantly slower in OMP KO ORNs (Fig. 1C, left and right columns
re-spectively; *p ⬍ 0.05, ***p ⬍ 0.005). While both kinetics were affected in the same way for ORNs expressing either OR, maximal peak responses were only re-duced in the mOR-EG ORNs lacking OMP compared with the WT (Fig. 1C, right column) at the acetophenone and eugenol
concentrations (100M) used. Thus, response magnitude might be controlled by OMP in an OR-dependent manner, a question more deeply investigated below.
ORNs fire APs during the rising phase of the receptor current and they can be displayed by filtering the odorant responses at a wider bandwidth (Fig. 1A, B, insets). Typically an ORN fires 1–2
APs, which we recorded as action currents at the onset of odor responses in ORNs expressing either OR, but M71-expressing ORNs in OMP KOs prolonged their spike train and fired more APs while no changes were observed in the mOR-EG ORNs, indicating that OMP controls not only the response magnitude but also the AP pattern sent to the OB. In conclusion, the differ-ences in the odorant responses between OMP WTs and KOs indicate an involvement of OMP in signal transduction that is dependent on the expressed OR.
OMP’s contribution to the dynamic range of odorant sensitivity in ORNs
Interestingly, we found differences in the peak amplitude at the single high odorant concentration of 100Monly in the mOR-EG-expressing ORNs while no change was observed in the M71-expressing ORNs. A previous report showed that mOR23-expressing ORNs of OMP KO mice have similar peak responses compare to WT mice (Lee et al., 2011). We further investigated response magnitudes at different concentrations in a dose-dependent manner. Stimulations with a series of 1 s pulses with Figure 1. Odorant-receptor-dependent changes in odorant responses in OMP KO ORNs. A, B, Responses to 1 s stimulations of
100Macetophenone or eugenol from M71-GFP-expressing or mOR-EG-expressing ORNs respectively of OMP WTs (black trace) and OMP KOs (blue trace). Inset shows the rising phase of the receptor currents filtered at 0 –5 kHz to display APs (arrows). C, Average data from OMP WT (black bars) and KO (blue bars) M71-expressing (left) and mOR-EG-expressing (right) ORNs. Peak current, number of APs, response latency measured as the delay between odorant onset and arrival of the first AP, time to peak (the time between stimulus onset and the time the response reaches its maximum), and t20, a measure of response termination
(arrowheads). n⫽ 13–17 ORNs for M71 ORNs and n ⫽ 48–65 ORNs for mOR-EG ORNs. *p ⬍ 0.05; ***p ⬍ 0.005, unpaired Student’s t test. All data are expressed as mean⫾ SEM.
acetophenone at different concentrations revealed that M71 ORNs in OMP KO mice have significantly larger responses at the low concentrations of 0.3, 1, and 3M(Fig. 2B; *p⬍ 0.05, ***p ⬍ 0.005). We now observed odorant responses in the OMP KOs at concentrations at which WT ORNs had not reached response threshold yet. A fit of the dose–response curves with a Hill func-tion gave values for the K1/2 (concentration for half-maximal current activation) not significantly different between WT and KO mice (Fig. 1B; WT, 14⫾ 2 M; KO, 14⫾ 9 M). More interestingly, the Hill coefficient was twofold smaller for the M71 OMP KO mice, indicating a broadening of their dynamic range and a less steep dose–response relationship (Fig. 1B; WT, 2.2⫾
0.3; KO, 0.61⫾ 0.07; p ⬍ 0.005). For both WT and KO M71-expressing ORNs, we did not see full saturation of the dose– response relation and maximal odorant responses were not significantly different as was the case in mOR-EG ORNs. We avoided higher acetophenone concentrations. It could be inter-esting to use a more effective M71 agonist (e.g., 2-amono-aceto-phenone;Zhang et al., 2012).
We wanted to understand whether the difference in response amplitude in mOR-EG OMP KOs, obtained by stimulating ORNs with eugenol at concentrations of 100M, was indicative of a shift and/or a broadening of the dynamic range of their sensitivity. Indeed, testing mOR-EG ORNs with an increasing series of different eugenol concentrations (Fig. 2C) showed an
increase of the peak responses at the two lowest concentrations (0.1 and 0.3M; *p⬍ 0.05) and a decrease at the three higher concentrations (10, 30, 100M; *p⬍ 0.05) in the OMP KOs, leading to a “crossing over” of the dose–response relationship of
OMP KO and WT ORNs. Even though it appeared that the dose– response curve lost its typical sigmoid shape (Fig. 2D) in the OMP
KOs, we could still fit a Hill curve and found that the K1/2value was⬃5-fold smaller compared with the WTs (WT, 3.3 ⫾ 2.5M; KO, 0.8 ⫾ 0.2M; p⬍ 0.005). The Hill coefficient was also smaller in the OMP KOs (WT, 1.4⫾ 0.2; KO, 0.75 ⫾ 0.12; p ⬍ 0.01). This demonstrates that the dose–response curve is flat-tened in the OMP KOs as if the lack of OMP diminished the contrast in the mOR-EG-expressing ORNs. Thus changes in odorant concentration only led to small changes in receptor cur-rent and ORNs partly lost their ability to distinguish among dif-ferent odorant concentrations. But it should also be pointed out that OMP KO ORNs expressing either the M71 or mOR-EG OR showed an increased sensitivity at low odorant concentrations compared the WT ORNs, a result that seems counterintuitive given that OMP KO mice have a reported lower behavioral sen-sitivity (Youngentob and Margolis, 1999; Youngentob et al., 2001,2003).
To further investigate this conundrum and the change in the dose–response curves in the OMP KOs and in particular the change of the Hill coefficient, we stimulated mOR-EG-expressing ORNs with 10Meugenol at increasing pulse durations ranging from 30 ms to 1 s (Fig. 3A, B). It has been established that ORNs
integrate the stimulus over time (Firestein et al., 1993;Bhandawat et al., 2005) with longer exposures giving rise to larger responses. WT ORNs integrate quickly and even at the shortest pulse dura-tion already yielded a more-than-half maximal response (Fig. 3A, C). In contrast, in the OMP KOs, shorter pulses revealed a
large reduction in the peak amplitude with only little, if any, Figure 2. OMP regulates odorant sensitivity. A, Acetophenone responses from OMP WT and KO M71-expressing ORNs stimulated at increasing concentration from 0.3 to 100M. B, The dose–response curve indicates that at 0.3, 1, and 3Mthe peak amplitudes were 2.7-fold, fourfold, and threefold larger in the OMP KO (blue curve) M71-expressing ORNs than in the OMP WTs (black curve). n⫽ 6–7 ORNs. C, Eugenol responses from mOR-EG-expressing ORNs stimulated at increasing concentration. D, In this case we observed 4–5-fold larger responses at 0.1 and 0.3Min the OMP KOs (blue trace) and on average twofold smaller at 10, 30, and 100M. n⫽ 14–22 ORNs. *p ⬍ 0.05, ***p ⬍ 0.005, unpaired Student’s t test. All data are expressed as mean ⫾ SEM.
current generated at 30 ms pulse duration and only reached sim-ilar and saturated response magnitudes as WT ORNs at 300 ms. Further increases in pulse duration did not yield larger responses. Thus, OMP ensures fast integration of the stimulus over time as it reduces the response latency and accelerates the rising phase of the response. Interestingly, while the decay phase of the response is greatly slowed in the absence of OMP, larger responses can still be observed during longer pulse durations in the OMP KOs, because now ORNs are stimulated long enough to allow integra-tion of the slow OMP KO response. These results suggest that for 1 s stimulation, the response to low concentrations of eugenol in the KOs was the result of the transduction events integrating over the course of the longer stimulation. In summary, OMP shortens the integration time. It means that OMP, by shortening the response latency, ensures that an ORN at shorter odorant exposure first will generate a response and then will generate a maximal response, even at those shorter pulse durations.
The lack of OMP disrupts ORN coding for rapid odor sampling
Given our observations of the reduction in suction current at short stimulus durations in the OMP KOs, we next investi-gated how AP generation is affected and therefore what infor-mation is sent to the OB.Figure 3D shows the chance of AP
firing generated for a given pulse duration. For WT ORNs, this likelihood is nearly 100% at all durations at a given pulse duration, while in OMP KO ORNs the likelihood was greatly reduced for short pulses (Fig. 3D; *p⬍ 0.05 Pearson’s2test). The decrease in chance of firing for shorter pulses will lead to a reduction of the signals that ORNs send to the brain, sug-gesting that indeed OMP is required for reliable AP coding.
Thus at high stimulation frequencies [e.g., during high-frequency sniffing when the stimulus duration is short during the short inhalation phase (⬃50 ms)] information transferred to the bulb would be expected to be compromised.
So how does the change in the kinet-ics of the odorant response and AP fir-ing in OMP KO mice affect the ORNs’ ability to follow stimulation frequencies that recapitulate breathing and explor-atory sniffing? ORNs in the nasal cavity are subject to continuous changes of the odor stimulation frequency due to changes in the breathing rate. WT ORNs are able to reliably encode resting respi-ratory patterns (2 Hz;Tankersley et al., 1994) at intermediate odorant concen-trations (Ghatpande and Reisert, 2011) but miss or filter out some stimuli at higher frequencies (5 Hz). We exposed mOR-EG-expressing ORNs first to eu-genol at 2 Hz, followed by stimulation at 5 Hz (Fig. 4) to simulate a sniff bout. The stimulus duration was kept at 0.1 s in both cases and seven concentrations were tested. WT mOR-EG-expressing ORNs reliably fired APs at 1, 3, and 10 Meugenol with near 100% reliability when delivered at a rate of 2 Hz (Fig. 4A, C). Moreover, at 2 Hz we could
ob-serve individual receptor current responses elicited by stimu-lation at each concentration (except for the lowest ones), but when switching to 5 Hz individual responses became less ob-vious as consecutive responses begin to fuse to give rise to a more steady-state current, rather than a dynamically regulated current. The firing probability decreased to 20%, indicating the inability of mOR-EG-expressing ORNs to follow rapid stimulation trains (Fig. 4A, D). At low (0.1 and 0.3M) and saturating concentrations (30 and 100M), the ORNs’ ability to reliably code for stimulations remained generally low. mOR-EG ORNs of OMP KO mice were not able to reliably fire APs either at 2 or at 5 Hz stimulation rates and the chance of APs generated was near zero. With the exception of the 0.1 and 100M, the AP firing probability remained significantly lower in the ORNs of the OMP KO mice (Fig. 4C,D; ***p⬍ 0.005).
The limiting factor for ORNs to fire APs in response to high-frequency stimulation is the time required for response termination at the end of an odor application (Ghatpande and Reisert, 2011). The main contributor to response termination in WT ORNs is the rate of Ca2⫹extrusion from olfactory cilia determined mainly by NCKX4 (Stephan et al., 2012). The re-sults presented in this paper and those previously published (Reisert et al., 2007;Kwon et al., 2009) showed a slower re-sponse termination in the OMP KO ORNs. If so, the slow termination phase is responsible for “fusing” of responses to consecutive stimulations in OMP KOs, thus making mOR-EG-expressing ORNs unable to follow high-frequency and even low-frequency train pulses. In the case of the OMP KOs, though, the deficits in response terminations were not caused by changing the rate of Ca2⫹extrusion but rather by the lack of OMP in speeding up the cAMP dynamics (Reisert et al., Figure 3. OMP ensures fast integration of the stimulus over time. A, B, Eugenol-induced (10M) currents from OMP WT (A) and
OMP KO (B) mOR-EG ORNs. Stimulus duration ranged from 0.03 to 1 s. C, D, Normalized suction current and the likelihood to fire APs as a function of stimulus duration. A “1” or a “0” was given for each stimulation if APs were or were not generated. For a given stimulus duration, these values were averaged across cells to give a “chance of firing.” At 0.03, 0.1, and 0.1 s, OMP KO ORNs were less likely to generate APs (2test, *p⫽ 0.01). n ⫽ 6–11. All data are expressed as mean ⫾ SEM.
2007). Thus, by increasing the response speed, OMP contributes to improved detection of stimuli during repetitive and fast stimulations.
Involvement of OMP in cAMP dynamics
To probe how OMP is participating in cAMP dynamics in ORNs, we used IBMX, a PDE inhibitor, to reveal AC3 activity in the absence of odor stimulation. In ran-domly picked ORNs expressing unknown ORs, IBMX elicited larger responses (Re-isert et al., 2007) in the OMP KOs, indic-ative of higher basal AC3 activity and cAMP levels in the absence of stimulation. Puzzlingly, M71-expressing ORNs (Fig. 5A, C, left column) showed an
unex-pected behavior, which is that the size of IBMX responses in the OMP KOs were similar to that of the WTs, suggesting sim-ilar basal cAMP levels in the absence of stimulation. By contrast, mOR-EG ORNs generated a larger response upon IBMX stimulation in the OMP KOs (Fig. 5B).
The IBMX peak amplitude is on average 10-fold higher in the OMP KOs compared with WTs. It should be noted that in mOR-EG ORNs, the responses to IBMX are usually small or even absent due to the low basal activity of mOR-EG (Reisert, 2010; Fig. 5C, left column black bar;
***p⬍ 0.005). Indeed, in our case only 45% of OMP WT mOR-EG ORNs re-sponded to IBMX and among those only 20% had a response amplitude⬎2 pA. By comparison, 90% of mOR-EG ORNs in the OMP KOs responded to IBMX and all with current amplitude⬎2 pA. These re-sults show that the differences in IBMX responses were OR dependent. The lack of OMP caused an increase of the basal level of cAMP, further indicating a role for OMP in early events of the signal trans-duction (Reisert et al., 2007). In
particu-lar, the increase in cAMP basal levels is evident only in mOR-EG and not M71 ORNs as we could not detect any significant differ-ence in M71 ORNs between OMP WTs and KOs. A parsimonious explanation is that in M71 ORNs the basal level of cAMP is al-ready high, creating a ceiling effect so that in the absence of OMP a further increase in cAMP levels is not able to increase signifi-cantly the overall IBMX response (see Discussion).
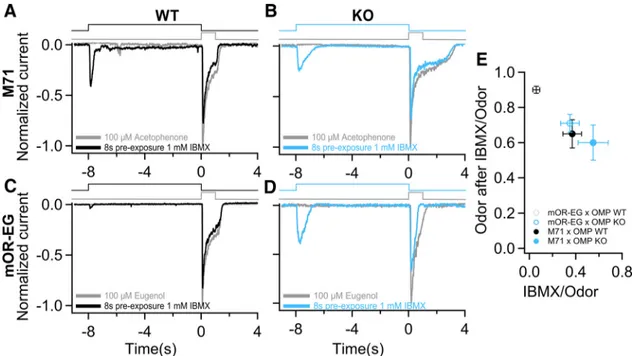
To investigate the contribution of OMP to maintaining low basal levels of cAMP and its functional consequences, we exposed ORNs to the PDE inhibitor IBMX for 8 s, followed immediately by a 1 s odor stimulation. By stimulating with IBMX and inhib-iting PDE, thus blocking basal cAMP degradation, ORNs should attain an adapted state. This would lead to a reduction of the odorant response after IBMX exposure compared with the one lacking IBMX pre-exposure.Figure 6A shows that indeed after 8 s
IBMX stimulation of a WT M71 ORN, the acetophenone re-sponse (black trace) is reduced compared with the odorant response without IBMX pre-exposure (gray trace). The
situa-tion was similar in M71 OMP KO ORNs (Fig. 6B). In both
cases the reduction in the acetophenone response after IBMX pre-exposure was⬃40% (Fig. 6E).
A different situation emerged when the same experimental protocol was applied to mOR-EG ORNs where, in WT ORNs, only small responses were elicited by 8 s IBMX (Fig. 6C, black
trace) and consequently the following eugenol response was re-duced only by 15% (compared with a eugenol response without IBMX pre-exposure). In the OMP KOs, the mOR-EG ORN showed a large response to IBMX pre-exposure and the following odorant response was now 35% smaller than the response in the absence of IBMX, a reduction similar to the one observed in M71 ORNs.
The data were analyzed by plotting the ratio (Fig. 6E) of the
IBMX response and the odorant response in the absence of IBMX pre-exposure against the ratio of the odorant responses with and without IBMX pre-exposure. The first is a measure of the size of the IBMX-induced response, the latter a measure of the adapta-Figure 4. Disrupted AP firing patterns during 2 and 5 Hz stimulations in OMP KO ORNs. A, B, Recordings from ORNs expressing the mOR-EG receptor (A, WT; B, OMP KO), stimulated at increasing concentrations of eugenol. Stimuli at 2 Hz were followed by 5 Hz; odorant exposure was 100 ms. Recording bandwidth 0 –5 kHz to display APs. C, D, The number of stimulations that led to the firing of APs was divided by the number of stimulations to yield the firing probability at 2 (C) and 5 Hz (D). OMP WT firing probability is represented with black lines and markers. OMP KO firing probability is represented with blue lines and markers. n⫽ 6–7 ORNs; *p⬍ 0.05; ***p ⬍ 0.005, unpaired Student’s t test. All data are expressed as mean ⫾ SEM.
tion occurring upon PDE blockage.Figure 6E shows that while
responses of M71 ORNs remained largely unchanged by knock-ing out OMP, mOR-EG ORN responses of OMP KO mice are greatly reduced compared with those of OMP WT mice. In par-ticular mOR-EG ORNs of OMP KO mice (Fig. 6E, cyan empty
circle) have approximately the same values as those of M71 ORNs of OMP WT and KO mice (Fig. 6E, black and cyan filled circle
respectively). From these results we can conclude that OMP is controlling cAMP dynamics and homeostasis by modifying cAMP levels according to the receptor that an ORN is expressing, especially in ORNs that have a low level of basal activity, like the mOR-EG OR.
The increase of the IBMX response in the mOR-EG OMP KO ORNs is the result of higher basal levels of cAMP due to an increase of the spontaneous activity of possibly all compo-nents of the signal transduction cascade. In particular an in-crease in IBMX responses could be observed if the expression of AC3 is higher in the OMP WT mice than in OMP KO mice. To test whether this is the case, we used NKH-477, an analog of forskolin, which is an AC3 activator, at 40M(Satake et al., 1998) and found no differences in NKH-477-induced re-sponses in the mOR-EG-expressing ORNs in the OMP KO mice compared with the OMP WT mice (data not shown; peak current: WT, 50.5⫾ 15.2 pA; KO, 37 ⫾ 12 pA, p ⫽ 0.44 ⬎ 0.05,
n⫽ 4 –5). Therefore it is unlikely that simply a higher level of
AC3 expression or a more active form of the enzyme contrib-uted to the higher cAMP response in the OMP KOs. This suggests that OMP acts as a “brake” on the spontaneous activity of transduction components involved in cAMP
dy-namics, maybe by modifying the basal rate at which cAMP is produced.
OMP affects basal noise in ORN
We previously established that the OR it-self is the major contributor to noise in WT ORNs (Reisert, 2010). So we then asked whether the differences in the basal activity of mOR-EG and M71 might help to explain some of the OR-dependent changes occurring in the OMP KOs. In other words, we wanted to address how basal activity of ORs alters ORN physiol-ogy in WT and OMP KO mice. The two ORs chosen have low (mOR-EG) and high (M71) basal activity respectively as can be seen in Figure 7A, C.
M71-expressing ORNs in the OMP WTs fired at a basal rate of ⬃0.7 Hz (Fig. 7F ) in
contrast to mOR-EG-expressing ORNs, which show a very low, near zero, basal firing rate. Basal noise is largely caused by the spontaneous activation of the OR (Re-isertJ 2010), which leads to the activation of the transduction cascade and eventu-ally to APs (Fig. 7A–D, 0 –30 s).
Spontane-ous APs can be silenced by blocking the Ca2⫹-activated Cl⫺channel TMEM16B/ ANO2 with niflumic acid (Fig. 7A–D,
30 – 60 s). The higher the level of sponta-neous events, the larger is the IBMX response (as before mentioned, IBMX blocks PDE, therefore revealing the basal levels of cAMP). We determined the noise level over a 0.3–50 Hz bandwidth of the power spectrum in the absence of niflumic acid subtracted by the one with niflumic acid (as shown previously inReisert, 2010; see Materials and Meth-ods). Noise levels showed a relationship with the response to the PDE inhibitor IBMX (Fig. 7E). Two striking changes occurred in
the M71 OMP KOs. First, the lack of OMP greatly reduced noise levels (Fig. 7E; variance: WT, 0.65⫾ 0.18 pA2; KO, 0.13⫾ 0.05 pA2; p⬍ 0.05, unpaired Student’s t test), but did not alter the response to IBMX (Fig. 7E; p⬎ 0.05, unpaired Student’s t test).
This could be explained by the observation that lack of OMP greatly prolongs the odorant response and therefore also the shot noise-like currents observed in M71 ORNs in the WTs. These fast events would be slowed in the OMP KOs, would begin to fuse and be transformed into more of a standing current, and would there-fore not be observed as noise any longer. But a constant stimula-tion at a low level would still give rise to IBMX-evoked currents. This is consistent with or similar to the observed fusing of re-sponses during rapid odorant stimulation (Fig. 4). The second striking observation is the reduction in basal AP firing in M71 OMP KO ORNs (Fig. 7F, blue filled symbols; WT, 0.71⫾ 0.27
Hz; KO, 0.025⫾ 0.02 Hz; p ⬍ 0.05 unpaired Student’s t test). This again can be explained with a more tonic basal current in the KOs compared with the more phasic, shot noise-like currents in the WTs. The latter does generate APs, while a more constant current is thought not to.
We observed increased IBMX responses in mOR-EG OMP KO ORNs (Figs. 5B,6C), which correspond to an increase in the
variance. Indeed, the variance in mOR-EG ORNs in OMP KOs was 15-fold larger than that in the OMP WTs (Fig. 7E, black
Figure 5. Odorant-receptor-dependent responses to PDE inhibitor IBMX. A, Responses to a 1 s stimulation of 1 mMof the PDE
inhibitor IBMX from M71-GFP OMP WT and OMP KO (black and blue trace) ORNs. None of the parameters measured was signifi-cantly different (C, left column). n⫽10–14.B,1sIBMXstimulationofmOR-EG-GFPOMPWTandOMPKOORNs.mOR-EGGFPOMP KO peak responses were significantly larger than those of mOR-EG-GFP OMP KO ORNs. The current at the end of the 1 s (Current @ 1 s) stimulation is indicative of a larger residual current at the end of the stimulation as a result of an altered termination phase of OMP KOs (C, right column). mOR-EG-GFP OMP KO ORNs also fire twice as many APs than OMP WTs. n⫽ 5–14 ORNs. *p ⬍ 0.05; ***p⬍ 0.005, unpaired Student’s t test. All data are expressed as mean ⫾ SEM.
empty circles, p⬍ 0.05 unpaired Student’s
t test) with noise reaching levels similar to
those in M71 OMP KOs. The increase of the IBMX response can therefore be ex-plained by the increase in the basal noise. As in the case of M71 ORNs, the lack of OMP leads to larger and slower spontane-ous events that alter both response kinet-ics and amplitude (Fig. 1). It should be noted that in the absence of OMP, mOR-EG and M71 ORNs have similar low basal firing rates that are essentially indistinguishable (Fig. 7F ). This suggests
that OMP plays a major role in maintain-ing appropriate and different basal activ-ity across ORNs expressing different ORs.
OMP is not directly involved in glomerular targeting and positioning
So far we showed that OMP is involved in regulating cAMP dynamics in the absence of stimulation and during the odorant re-sponse. OMP’s involvement is even more evident in ORNs expressing an OR with low basal activity, such as mOR-EG. Be-side its role in signal transduction, cAMP is important for the correct targeting of ORN axons to specific glomeruli in the OB. In particular, recent results have shown that basal levels of cAMP are in-volved in anterior–posterior positioning of glomeruli in the OB. Each OR, having its own basal activity, determines the basal concentration of cAMP, which in turn de-termines the expression levels of guidance
Figure 6. OMP affects basal state of adenylyl cyclase. A, B, Both M71 OMP WT and KO ORNs were exposed for 1 s to acetophenone with (cyan trace) or without (gray trace) an 8 s pre-exposure to IBMX. C, D, Same experiments were performed with eugenol on mOR-EG-GFP ORNs. E, The odorant response after IBMX exposure divided by the control odorant response as a function of the IBMX response relative to the odorant response. Open circles indicates mOR-EG ORNs while filled circle are for M71 ORNs. n⫽ 13–14 for M71 ORNs; n ⫽ 16 –23 for mOR-EG ORNs. Values are significantly different: *p⬍ 0.005, unpaired Student’s t test. All data are expressed as mean ⫾ SEM.
Figure 7. OMP alters spontaneous activity in an odorant-receptor-dependent manner. A–D, Baseline recordings in absence of stimulation from M71 OMP WTs (A) and OMP KOs (B) and mOR-EG OMP WTs (C) and OMP KOs (D). The red and dark blue traces represent low-pass filtered (50 Hz) recordings. The Ca2⫹-activated Cl⫺channel blocker niflumic acid at
300Mabolished basal activity. E, mOR-EG and M71 IBMX (1 mM, 1 s) responses were normalized to the responses of their respective ligand at 100M. The ratio is then plotted against the basal variance (averages of 8 –24 ORNs). F, Average basal spike firing rate as a function of the basal variance (n⫽ 8 –10 ORNs). All data are expressed as mean ⫾ SEM.
molecules (Nakashima et al., 2013). Neuropilin 1 (Nrp1), a sema-phorin class 3 receptor, is involved in such a mechanism and is dependent on the basal cAMP levels in ORNs expressing different ORs (Imai et al., 2006;Nakashima et al., 2013). In general, the dependence of Nrp1 on cAMP is also evident in AC3 KO mice, where the levels of Nrp1 are drastically reduced (Col et al., 2007), compared with WT mice, and where ORN axons grossly miss their targets. We reasoned that if cAMP is altered in OMP KO mice during the establishment of glomerular targeting, we should find defects in targeting in those mice. We investigated Nrp1 expression in the OB and potential defects in glomerular forma-tion. We stained consecutive sections of OBs with an antibody raised against Nrp1. First, we observed a mosaic pattern of Nrp1 expression in sagittal section of the OB. Glomeruli showed high, low, or even absent levels of Nrp1 (Fig. 8B–D,G–I ) and we did not
observe any substantial changes in the staining pattern in the OMP KO bulbs (measured as cumulative probability of the stain-ing intensity of⬃100 glomeruli for each mouse; data not shown). The GFP-positive glomeruli, which were innervated by either the mOR-EG or M71 ORN axons, had very similar Nrp1 expression both in the OMP WTs and KOs for the two different ORs (Fig. 8A–E, for M71 glomeruli, F–J for mOR-EG glomeruli). There
were no differences as to where the M71 OMP WTs and M71 KOs ranked from the highest Nrp1-staining intensity among the glomeruli analyzed (Fig. 8E). No differences either were found
between mOR-EG OMP WTs and OMP KOs (Fig. 8J ), although
one might have expected to see a change in the mOR-EG glom-eruli given the above results of increased responses to IBMX.
These results were further confirmed by the absence of shift of the M71 glomeruli along the anterior–posterior axis of the OB in OMP KOs, as expected since no change in Nrp1 levels were ob-served. Determination of the position of mOR-EG glomeruli was not attempted, as a single bulb often displayedⱕ11 mOR-EG-positive glomeruli, making comparison between WTs and KOs ambiguous. In summary, in the OB of the OMP KO mice we did not detect any gross defects in targeting: both M71 and mOR-EG-expressing ORNs were able to form properly innervated
glomer-uli in the medial and lateral side of the OB and the guidance molecule, Nrp1, is expressed in similar ways in OMP WTs and OMP KOs.
Discussion
OMP is expressed in mature chemosensory neurons in the nasal cavity and its mechanisms of action depending on the OR ex-pressed in a given ORN has not been investigated. In ORNs, cAMP can be produced by spontaneous activation of the OR, which drives Golf to stimulate AC3 with subsequent opening of CNG and Ca2⫹-activated Cl⫺channels. Interestingly, ORs have varying levels of basal activity (Reisert, 2010;Connelly et al., 2013; Nakashima et al., 2013) and hence we chose to investigate the mOR-EG and the M71 OR as they have respectively low and high levels of spontaneous activity and therefore low and high levels of basal cAMP. The latter is particularly interesting as OMP has been implicated in the kinetic regulation of cAMP (Reisert et al., 2007). In overall agreement with previous reports, we found that knocking out OMP prolongs response onset, rising phase, and response termination of the odorant-induced response regard-less of the expressed OR. The previously observed prolonged odorant-induced AP train in OMP KO mice (Reisert et al., 2007) was only observed in M71-expressing ORNs, but not in mOR-EG-expressing ORNs, indicating that indeed OMP might mo-dulate basal and odorant-induced cAMP dynamics in an OR-dependent way. An involvement of OMP in Ca2⫹extrusion by interacting with the Na⫹–Ca2⫹exchanger has been shown to take place in ORN dendritic knobs (Kwon et al., 2009). Interest-ingly Ca2⫹ is also sequestered by mitochondria in the knob (Fluegge et al., 2012), and similar to OMP KOs, disabling mito-chondrial Ca2⫹sequestration prolongs the odorant response and longer stimulus durations are required for ORNs to reach firing threshold. However, our results show that lack of OMP broadens the dose–response relation, while lack of mitochondrial Ca2⫹ homeostasis in the knob steepens the dose–response curve. This suggests a more complex role of OMP and its contribution to ORN responses in cilia and knobs. As our experiments are re-Figure 8. Axonal targeting and Nrp1 expression in the OB. A, C, F, H, GFP-expressing M71 or mOR-EG glomeruli in OMP WTs (A, F ) and KOs (C, H ). B, D, G, I, Nrp1 staining in the OB revealed mosaic patterns in both OMP WTs and KOs and for both receptor types (B, D: M71; G, I: mOR-EG). For comparison⬃100 glomeruli for each mouse (n ⫽ 5 and n ⫽ 7 mice for M71 OMP WTs and KOs respectively and for mOR-EG OMP WTs and KOs; n⫽2miceforeachgenotype).E–J,GlomeruliwererankedandNrp1levelsofGFP-positiveglomerulifellintothe⬃70thpercentile in all genotypes tested. p⬎ 0.05, Wilcoxon rank sum test. All data are expressed as mean ⫾ SEM.
stricted to monitoring ciliary events, the interplay between OMP, Na⫹–Ca2⫹exchange, and mitochondrial knob Ca2⫹ homeosta-sis remains to be investigated.
We found that in the absence of OMP, the basal current noise driven by these two receptors, which is sevenfold differ-ent in the WT, is almost the same (Fig. 7). In mOR-EG-expressing ORNs, the increased levels of cAMP (larger IBMX responses in OMP KOs) leads to an increase in noise while in M71 ORNs knocking out OMP has the opposite effect, so lack of OMP ablates the difference in noise levels and basal AP firing between these two ORs. Moreover, in mOR-EG OMP KO ORNs, the increase in IBMX response together with the slower odorant-response kinetics are indicative of OMP low-ering basal cAMP production inside the cilia. In the absence of OMP, continuous cAMP production and low-level activation of the transduction cascade lead to ORNs being in an adapted state (Reisert and Matthews, 1999;Reisert et al., 2007). This cAMP increase in the OMP KO is not predominantly driven by basal activity of the OR, since we especially observed an in-crease in noise and IBMX response in mOR-EG ORNs, which lack basal OR-driven noise. This indicates that one of OMP’s roles is that of synchronizing basal activity of AC3 with that of the OR an ORN expresses, and OR-constitutive activity be-comes the dominant source of noise. In this way OR mono-genic expression together with its particular basal activity can now play different instructive roles in ORN physiology in the olfactory system (e.g., dictating the position of glomeruli in the bulb).
Moreover, basal cAMP needs to be maintained at correct concentrations to ensure an appropriate trade-off between sensitivity and cooperativity during the odorant response. In the OMP WT, ORNs do not respond to lower odorant concen-trations used here and the steepness of their dose–response curve allows for a proper detection and discrimination of odorants at intermediate concentration. Surprisingly, knock-ing out OMP reveals that ORNs are able to respond to these low odorant concentrations, probably by integrating (see be-low) the small, but now slower, responses over the 1 s stimulus duration. This, on the one hand, makes ORNs more sensitive, but also, as the dose–response relation is now much shallower, makes it harder to encode the odorant concentration. It also suggests that ORs bind and are activated by odorants at much lower concentrations (⬎1 log unit) than one would assume from the odorant-current dose–response relation. Moreover, ORNs integrate the stimulus over time (Firestein et al., 1990) and, when OMP is absent, ORNs integrate much more slowly. Now odorant stimulations with the duration of a typical inha-lation period (50 –100 ms) are often not sufficient to activate ORNs (Fig. 3). In summary, while for longer stimulation OMP allows ORNs to narrow its dynamic range, for shorter stimu-lation OMP speeds up integration time so that ORNs can increase their chance of firing APs.
A possible explanation for the increased AC3 activity and in-creased cAMP levels in the OMP KO ORNs that we observed by using IBMX could be a compensatory mechanism through which AC3 becomes more abundant (Lee et al., 2011). The reported increase in protein levels in the OMP KO does not seem to affect responses to the AC3 activator NKH 477, suggesting that func-tional AC3 activity is not increased in the OMP KO compared with the WT. OMP could modify AC3 phosphorylation (Lee et al., 2011), although this seems unlikely as phosphorylation does not seem to affect odorant response termination (Cygnar et al., 2012).
cAMP basal levels have been reported to drive glomerular positioning along the anterior–posterior axis in the OB (Imai et al., 2006;Chesler et al., 2007;Nakashima et al., 2013). We sought to determine whether the altered level of basal noise could also alter those processes. Nrp1, an anterior–posterior targeting mol-ecule that is dependent on spontaneously generated cAMP, is altered neither in its expression level nor in its distribution across the bulbs. Our data, thus, suggest that OMP is not involved in glomerular targeting, most likely because OMP is only expressed at a later stage of ORN development when cAMP-derived signals have already established the position of a given glomerulus (Na-kashima et al., 2013;Rodriguez-Gil et al., 2015).
From single-cell physiology to behavior
Given the much shallower dose–response relation and the slow integration of the stimulus in the OMP KOs, we investigated how ORNs lacking OMP respond to a stimulus paradigm that resem-bles sniffing patterns in vivo. Previously (Ghatpande and Reisert, 2011) and here, we could show that ORNs can reliably generate APs following stimulation patterns of 2 Hz. However, this fidelity is lost at 5 Hz. In the OMP KOs, ORNs are not able to fire APs during 2 or 5 Hz stimulation. We noticed in particular that their prolonged response termination does not allow ORNs to fully recover from depolarization and to fire APs to subsequent stim-uli. By speeding up the termination phase of the transduction current, OMP facilitates cellular repolarization so that an ORN is ready to fire APs at the next stimulation to reliably send odorant information to the OB. Moreover, OMP enables ORNs to func-tion as stimulus frequency-dependent filters able to generate APs with high fidelity at 2 Hz and silencing it, at least in part, at higher-frequency (5 Hz) stimulations, thus acting as a low-pass filter. It is tempting to speculate that a slowed odorant response unable to generate APs in the OMP KO cannot synchronize odor-ant responses with the sniffing frequency, thus leading to deteri-oration of signals arriving at the bulb. Indeed, from bulb imaging experiments it seems that OMP KO mice have less total odorant-evoked neurotransmitter release when assessed within the first 2 s of an odorant presentation, suggestive of reduced AP input dur-ing this time window. But later durdur-ing the stimulation, the total neurotransmitter release was comparable to that of control mice (Kass et al., 2013). In short, in OMP KO mice OB responses take longer to fully develop. Consistently, if an OMP KO mouse en-gaged in an odor task has plenty of time to accomplish the task, it can perform comparably to controls (Youngentob and Margolis, 1999). Further, mice and rats are able to distinguish odorant in ⬃200 ms (Uchida and Mainen, 2003;Abraham et al., 2004; Rin-berg et al., 2006), which can beⱕ2 sniffing cycles at high sniffing rates. Thus the failure of proper AP synchronization with the sniffing cycle could impair odor-dependent behaviors.
In summary, we show that OMP reduces the AC3-induced noise in ORNs and thus helps to maintain appropriate basal levels of cAMP across ORs with different spontaneous activation (i.e., mOR-EG and M71). OMP also speeds up the odorant response with important consequences. It allows ORNs to maintain better fidelity when exposed rapidly to successive odorant stimulations by first integrating the odor stimulus rapidly and then by termi-nating the response quickly. OMP also ensures a dynamic dose– response relation at the cost of suppressing responses at low odorant concentrations, thus steeping the dose–response rela-tion. The latter is further improved as OMP WT ORNs are able to generate larger maximal responses compared with KO ORNs. Thus, by tuning noise and response kinetics, OMP is a key regu-lator of ORN physiology. It will be interesting to investigate
whether OMP might also play a similar role in other tissues, given its recently reported broader expression pattern (Kang et al., 2015).
References
Abraham NM, Spors H, Carleton A, Margrie TW, Kuner T, Schaefer AT (2004) Maintaining accuracy at the expense of speed. Neuron 44: 865– 876.CrossRef Medline
Bakalyar HA, Reed RR (1990) Identification of a specialized adenylyl cyclase that may mediate odorant detection. Science 250:1403–1406.CrossRef Medline
Baylor DA, Matthews G, Yau KW (1980) Two components of electrical dark noise in toad retinal rod outer segments. J Physiol 309:591– 621.CrossRef Medline
Bhandawat V, Reisert J, Yau KW (2005) Elementary response of olfactory receptor neurons to odorants. Science 308:1931–1934.CrossRef Medline
Billig GM, Pa´l B, Fidzinski P, Jentsch TJ (2011) Ca2⫹-activated Cl⫺ cur-rents are dispensable for olfaction. Nat Neurosci 14:763–769.CrossRef Medline
Boccaccio A, Lagostena L, Hagen V, Menini A (2006) Fast adaptation in mouse olfactory sensory neurons does not require the activity of phos-phodiesterase. J Gen Physiol 128:171–184.CrossRef Medline
Bozza T, Feinstein P, Zheng C, Mombaerts P (2002) Odorant receptor ex-pression defines functional units in the mouse olfactory system. J Neuro-sci 22:3033–3043.Medline
Buck L, Axel R (1991) A novel multigene family may encode odorant recep-tors: a molecular basis for odor recognition. Cell 65:175–187.CrossRef Medline
Buiakova OI, Baker H, Scott JW, Farbman A, Kream R, Grillo M, Franzen L, Richman M, Davis LM, Abbondanzo S, Stewart CL, Margolis FL (1996) Olfactory marker protein (OMP) gene deletion causes altered physiolog-ical activity of olfactory sensory neurons. Proc Natl Acad Sci U S A 93: 9858 –9863.CrossRef Medline
Chesler AT, Zou DJ, Le Pichon CE, Peterlin ZA, Matthews GA, Pei X, Miller MC, Firestein S (2007) A G protein/cAMP signal cascade is required for axonal convergence into olfactory glomeruli. Proc Natl Acad Sci U S A 104:1039 –1044.CrossRef Medline
Col JA, Matsuo T, Storm DR, Rodriguez I (2007) Adenylyl cyclase-dependent axonal targeting in the olfactory system. Development 134: 2481–2489.CrossRef Medline
Connelly T, Savigner A, Ma M (2013) Spontaneous and sensory-evoked activity in mouse olfactory sensory neurons with defined odorant recep-tors. J Neurophysiol 110:55– 62.CrossRef Medline
Cygnar KD, Zhao H (2009) Phosphodiesterase 1C is dispensable for rapid response termination of olfactory sensory neurons. Nat Neurosci 12: 454 – 462.CrossRef Medline
Cygnar KD, Collins SE, Ferguson CH, Bodkin-Clarke C, Zhao H (2012) Phosphorylation of adenylyl cyclase III at serine1076 does not attenuate olfactory response in mice. J Neurosci 32:14557–14562.CrossRef Medline
Dzeja C, Hagen V, Kaupp UB, Frings S (1999) Ca2⫹permeation in cyclic
nucleotide-gated channels. EMBO J 18:131–144.CrossRef Medline
Firestein S, Shepherd GM, Werblin FS (1990) Time course of the membrane current underlying sensory transduction in salamander olfactory receptor neurones. J Physiol 430:135–158.CrossRef Medline
Firestein S, Zufall F, Shepherd GM (1991) Single odor-sensitive channels in olfactory receptor neurons are also gated by cyclic nucleotides. J Neurosci 11:3565–3572.Medline
Firestein S, Picco C, Menini A (1993) The relation between stimulus and response in olfactory receptor cells of the tiger salamander. J Physiol 468:1–10.CrossRef Medline
Fluegge D, Moeller LM, Cichy A, Gorin M, Weth A, Veitinger S, Cainarca S, Lohmer S, Corazza S, Neuhaus EM, Baumgartner W, Spehr J, Spehr M (2012) Mitochondrial Ca(2⫹)mobilization is a key element in olfactory signaling. Nat Neurosci 15:754 –762.CrossRef Medline
Gesteland RC, Sigwart CD (1977) Olfactory receptor units—a mammalian preparation. Brain Res 133:144 –149.CrossRef Medline
Ghatpande AS, Reisert J (2011) Olfactory receptor neuron responses coding for rapid odour sampling. J Physiol 589:2261–2273.CrossRef Medline
Hengl T, Kaneko H, Dauner K, Vocke K, Frings S, Mo¨hrlen F (2010) Mo-lecular components of signal amplification in olfactory sensory cilia. Proc Natl Acad Sci U S A 107:6052– 6057.CrossRef Medline
Imai T, Suzuki M, Sakano H (2006) Odorant receptor-derived cAMP sig-nals direct axonal targeting. Science 314:657– 661.CrossRef Medline
Jones DT, Reed RR (1989) Golf: an olfactory neuron specific-G protein in-volved in odorant signal transduction. Science 244:790 –795.CrossRef Medline
Kajiya K, Inaki K, Tanaka M, Haga T, Kataoka H, Touhara K (2001) Molec-ular bases of odor discrimination: reconstitution of olfactory receptors that recognize overlapping sets of odorants. J Neurosci 21:6018 – 6025.
Medline
Kang N, Kim H, Jae Y, Lee N, Ku CR, Margolis F, Lee EJ, Bahk YY, Kim MS, Koo J (2015) Olfactory marker protein expression is an indicator of ol-factory receptor-associated events in non-olol-factory tissues. PLoS One 10: e0116097.CrossRef Medline
Kass MD, Moberly AH, McGann JP (2013) Spatiotemporal alterations in primary odorant representations in olfactory marker protein knockout mice. PLoS One 8:e61431.CrossRef Medline
Kepecs A, Uchida N, Mainen ZF (2007) Rapid and precise control of sniff-ing dursniff-ing olfactory discrimination in rats. J Neurophysiol 98:205–213.
CrossRef Medline
Kleene SJ (1993) Origin of the chloride current in olfactory transduction. Neuron 11:123–132.CrossRef Medline
Kwon HJ, Koo JH, Zufall F, Leinders-Zufall T, Margolis FL (2009) Ca2⫹ extrusion by NCX is compromised in olfactory sensory neurons of OMP⫺/⫺mice. PLoS One 4:e4260.CrossRef Medline
Lee AC, He J, Ma M (2011) Olfactory marker protein is critical for func-tional maturation of olfactory sensory neurons and development of mother preference. J Neurosci 31:2974 –2982.CrossRef Medline
Lowe G, Gold GH (1991) The spatial distributions of odorant sensitivity and odorant-induced currents in salamander olfactory receptor cells. J Physiol 442:147–168.CrossRef Medline
Lowe G, Gold GH (1993) Nonlinear amplification by calcium-dependent chloride channels in olfactory receptor cells. Nature 366:283–286.
CrossRef Medline
Malnic B, Hirono J, Sato T, Buck LB (1999) Combinatorial receptor codes for odors. Cell 96:713–723.CrossRef Medline
Margolis FL (1972) A brain protein unique to the olfactory bulb. Proc Natl Acad Sci U S A 69:1221–1224.CrossRef Medline
Matthews HR (1999) A compact modular flow heater for the superfusion of mammalian cells. J Physiol 518:13P.CrossRef
Nakamura T, Gold GH (1987) A cyclic nucleotide-gated conductance in olfactory receptor cilia. Nature 325:442– 444.CrossRef Medline
Nakashima A, Takeuchi H, Imai T, Saito H, Kiyonari H, Abe T, Chen M, Weinstein LS, Yu CR, Storm DR, Nishizumi H, Sakano H (2013) Agonist-independent GPCR activity regulates anterior-posterior tar-geting of olfactory sensory neurons. Cell 154:1314 –1325.CrossRef Medline
Oka Y, Katada S, Omura M, Suwa M, Yoshihara Y, Touhara K (2006) Odor-ant receptor map in the mouse olfactory bulb: in vivo sensitivity and specificity of receptor-defined glomeruli. Neuron 52:857– 869.CrossRef Medline
Ponissery Saidu S, Dibattista M, Matthews HR, Reisert J (2012) Odorant-induced responses recorded from olfactory receptor neurons using the suction pipette technique. J Vis Exp e3862.CrossRef Medline
Rasche S, Toetter B, Adler J, Tschapek A, Doerner JF, Kurtenbach S, Hatt H, Meyer H, Warscheid B, Neuhaus EM (2010) Tmem16b is specifically expressed in the cilia of olfactory sensory neurons. Chem Senses 35: 239 –245.CrossRef Medline
Reisert J (2010) Origin of basal activity in mammalian olfactory receptor neurons. J Gen Physiol 136:529 –540.CrossRef Medline
Reisert J, Matthews HR (1999) Adaptation of the odour-induced response in frog olfactory receptor cells. J Physiol 519:801– 813.CrossRef Medline
Reisert J, Matthews HR (2001) Response properties of isolated mouse olfac-tory receptor cells. J Physiol 530:113–122.CrossRef Medline
Reisert J, Yau KW, Margolis FL (2007) Olfactory marker protein modulates the cAMP kinetics of the odour-induced response in cilia of mouse olfac-tory receptor neurons. J Physiol 585:731–740.CrossRef Medline
Rinberg D, Koulakov A, Gelperin A (2006) Speed-accuracy tradeoff in ol-faction. Neuron 51:351–358.CrossRef Medline
Rodriguez-Gil DJ, Bartel DL, Jaspers AW, Mobley AS, Imamura F, Greer CA (2015) Odorant receptors regulate the final glomerular coalescence of olfactory sensory neuron axons. Proc Natl Acad Sci U S A 112:5821–5826.
Rospars JP, Lansky P, Chaput M, Duchamp-Viret P (2008) Competitive and noncompetitive odorant interactions in the early neural coding of odor-ant mixtures. J Neurosci 28:2659 –2666.CrossRef Medline
Sagheddu C, Boccaccio A, Dibattista M, Montani G, Tirindelli R, Menini A (2010) Calcium concentration jumps reveal dynamic ion selectivity of calcium-activated chloride currents in mouse olfactory sensory neurons and TMEM16b-transfected HEK 293T cells. J Physiol 588:4189 – 4204.
CrossRef Medline
Satake K, Takagi K, Kodama I, Honjo H, Toyama J, Shibata S (1998) Relax-ant effects of NKH477, a new water-soluble forskolin derivative, on guinea-pig tracheal smooth muscle: the role of Ca2⫹-activated K⫹ chan-nels. Br J Pharmacol 123:753–761.CrossRef Medline
Stephan AB, Shum EY, Hirsh S, Cygnar KD, Reisert J, Zhao H (2009) ANO2 is the cilial calcium-activated chloride channel that may mediate olfactory amplification. Proc Natl Acad Sci U S A 106:11776 –11781.CrossRef Medline
Stephan AB, Tobochnik S, Dibattista M, Wall CM, Reisert J, Zhao H (2012) The Na(⫹)/Ca(2⫹)exchanger NCKX4 governs termination and adapta-tion of the mammalian olfactory response. Nat Neurosci 15:131–137.
CrossRef Medline
Tankersley CG, Fitzgerald RS, Kleeberger SR (1994) Differential control of ventilation among inbred strains of mice. Am J Physiol 267:R1371– R1377.Medline
Uchida N, Mainen ZF (2003) Speed and accuracy of olfactory discrimina-tion in the rat. Nat Neurosci 6:1224 –1229.CrossRef Medline
Youngentob SL, Margolis FL (1999) OMP gene deletion causes an elevation in behavioral threshold sensitivity. Neuroreport 10:15–19. CrossRef Medline
Youngentob SL, Mozell MM, Sheehe PR, Hornung DE (1987) A quantita-tive analysis of sniffing strategies in rats performing odor detection tasks. Physiol Behav 41:59 – 69.CrossRef Medline
Youngentob SL, Margolis FL, Youngentob LM (2001) OMP gene deletion results in an alteration in odorant quality perception. Behav Neurosci 115:626 – 631.CrossRef Medline
Youngentob SL, Kent PF, Margolis FL (2003) OMP gene deletion results in an alteration in odorant-induced mucosal activity patterns. J Neuro-physiol 90:3864 –3873.CrossRef Medline
Zhang J, Huang G, Dewan A, Feinstein P, Bozza T (2012) Uncoupling stim-ulus specificity and glomerular position in the mouse olfactory system. Mol Cell Neurosci 51:79 – 88.CrossRef Medline