Università degli Studi di Salerno
Facoltà di Scienze Matematiche Fisiche e Naturali Dipartimento di Chimica e Biologia
__________________________________________
“Development of dosimeters with selective materials to high frequency radiation”
A dissertation submitted in fulfillment of the requirements for the Degree of Philosophiæ Doctor in
Scienza e Tecnologie per l’Industria Chimica, Farmaceutica e Alimentare (Indirizzo chimica – XI ciclo)
Candidate: Dr. Maria Funaro
Supervisor: Prof. Antonio Proto
Co-Supervisors: Coordinators:
Prof. Paolo Ciambelli Prof. Gaetano Guerra Dr. Patrizia Pelosi Prof. Paolo Ciambelli
Abstract
The clinical use of ionizing radiation to obtain a necrosing or cytotoxic radiobiological effect on tumoral lesions requires wide and complex physical and dosimetrical procedures. In particular, it is necessary to calculate accurately the absorbed dose optimizing its delivery in order to treat the tumor, without affecting the surrounding healthy tissues. Moreover, the technological development of the last few years has led to an evolution in the field of radiotherapy, in the sense of an always bigger conformation of the dose distribution to the volumes to be irradiated, through the use of very complex dose release techniques. For this reason, priority target in radiotherapy is the research and the tuning of suitable systems for dosimetrical measurements. In this context, the research activity presented in this PhD thesis has regarded not only the use and development of conventional dosimeters but mainly the development of new radiation detectors based on nanomaterials. Different nanomaterials have been prepared and tested under photon radiation, such as precursors of silver nanoparticles, manganese doped zinc sulphate nanoparticles, multiwall carbon nanotubes and graphene. This work demonstrates that these nanomaterials, interesting for their fascinating physical and chemical properties, are also very promising to realize dosimeters of new generation.
Dedicated to
Giulia, Alessandra and Fabio
I wish to express my sincere gratitude to my supervisor, Prof. Antonio Proto, not only for guiding my first steps in the field of chemistry but above all for his mental opening in taking up new challenges also in a different research field from his own, for his continuous encouragements, for believing in me and for creating a serene work climate.
I am grateful to Dr. Patrizia Pelosi for having introduced me to Radiation Dosimetry and for the technical support during my permanence at Radiotherapy Unit of “G. Rummo” Hospital in Benevento. I had the idea to develop this research project, after speaking with her.
I wish to thank Prof. Paolo Ciambelli for helpful comments and suggestions and for having introduced me to the entrepreneurial world trough the participation to Start Cup Campania 2012, PNI 2012 and Nanochallenge 2012.
I am grateful to Prof. Guerra for his availability for all technical questions concerning the PhD, for useful scientific discussions and advices on patent draft. I wish to thank Dr. Debora Sarno, Dr. Maria Sarno Dr. Matilde Sublimi for their collaboration; Dr. Fabrizio Bobba, Dr. Antonio Di Bartolomeo and Dr. Nicola Franza for useful discussions and their expert comments.
I am grateful to Dr. Antonio Borsellino, Dr. Anna Colantuoli and Dr Francesco Granata for the use of the LINAC of the Radiotherapy Unit of Check up Diagnostic Center in Salerno and for the technical support.
I wish to thank Dr. Rosario Lanzetta and Dr. Teresa Pironti for the use of the LINAC of the Radioterapy Unit of “G. Rummo” Hospital in Benevento.
Fisciano, 20 Novembre 2012 Maria Funaro
The work of this PhD thesis originated the following publications:
Funaro M., Di Bartolomeo A., Pelosi P., Saponetti M.S., Proto A. “A dosimeter based on silver-nanoparticle precursors for medical applications with linear response over a wide dynamic range”, Micro & Nano Letters, 6(9):759-762, 2011;
Funaro M., Di Bartolomeo A., Pelosi P., Proto A. “Un rivelatore nanostrutturato sensibile a basse ed alte dosi”, Proceedings VII Congresso
Nazionale Associazione Italiana di Fisica Medica, Catanzaro, 13-16
Settembre 2011;
Funaro M., Sarno M., Altavilla C., Proto A., Ciambelli P. “Dosimetro di radiazione “in tempo reale” basato su nanomateriali di carbonio”. Patent SA 2012°000011;
Funaro M., Boccia M., Granata F., Motta O., Proto A. “A comparison between the accuracy of radiochromic film and 2D arrays in IMRT prostate quality assurance”. Radiologia e Futuro, 2:266-269, 2012;
Funaro M., Sarno M., Ciambelli P., Altavilla C., Proto A. “Real time radiation dosimeters based on vertically aligned Multiwall Carbon Nantotubes and Graphene”, Submitted, 2012.
Moreover, the project Sviluppo di dosimetri nanostrutturati (NARRANDO), winner of the first prize both at Start Cup Campania 2012 and PNI 2012 (Life Sciences section), derived from this thesis.
Fig. 1.1: response characteristics of three dosimeters. Curve A first exhibits linearity with dose, curve B first exhibits linearity and then saturation at high doses, curve C first exhibits linearity with dose, then supralinear behavior, and finally saturation.
10
Fig. 1.2: PTW water phantom. 13
Fig. 1.3: simulation of the treatment planning for Fricke dosimeter with isodose values. In red the cylindrical vial containing the Fricke solution. The color red correspond to a isodose value of 115%.
14
Fig. 1.4: change in absorbance after irradiation vs. wavelength for Fricke solution.
15
Fig. 1.5: (a) basic design of a thimble ionization chamber; (b) PTW Farmer Chamber Type 30010.
16
Fig. 1.6: (a) diagram of a parallel-plate ionization chamber: 1 is the polarizing electrode; 2 is the measuring electrode; 3 is the guard ring; a is the height (electrode separation) of the air cavity; d is the diameter of the polarizing electrode; m is the diameter of the collecting electrode; and g is the width of the guard ring (adapted from the IAEA TRS-381 dosimetry protocol [9]). (b) PTW Advanced Markus Chamber Type 34045.
17
Fig. 1.7: electrometer in feedback mode of operation. 18
Fig. 1.8: schematic diagram of a basic film densitometer. 20
Fig. 1.9: (a) GAFCromic EBT2 configuration; (b) identification of the layers by SEM.
22
Fig. 1.10: atomic composition of active layer. 23
Fig. 1.11: IR spectrum. 24
Fig. 1.12: the experimental set up used to irradiate radiochromic film GAFChromic EBT2.
25
Fig. 1.13: ionization chamber 30013 Farmer, connected to the electrometer PTW UNIDOS.
26
Fig. 1.14: not irradiated sample (up left); the irradiated samples (in total 15) show a different color according to the dose.
26
Fig. 1.15: calibration curve of the film EBT2 (Dose vs. LG net). 28
Fig. 1.16: PTW 2D ionization chambers 2D array in solid phantom at a distance between its centre and the beam source equal to 100.0 0.2 cm.
29
Fig. 1.17: (a) dose distribution measured by radiochromic film, (b) dose distribution calculated by TPS, (c) map of values of γ index.
31
Fig. 1.18: (a) dose distribution measured by radiochromic film, (b) dose distribution calculated by TPS, (c) map of values of γ index.
31
Fig. 1.19: energy-level diagram of the termoluminescence process: (a) ionization by radiation and trapping of electrons and holes; (b) heating to release electrons, allowing luminescence production.
33
Fig. 1.20: schematic diagram of a TLD reader. 34
Fig. 1.21: principle of diode detection without external bias (in short-circuit mode).
36
Fig. 1.22: schematic representation of a p-channel MOSFET showing the oxide, the substrate, the source, the drain and the gate.
37
Fig. 1.23: after the irradiation a shift ΔVTH in the drain current versus gate voltage curve is observed.
38
Fig. 1.24: alanine dosimeters. 40
Fig. 2.2: (a) sagittal and (b) axial profile of depth-dose for the exposure of 21 Gy.
47
Fig. 2.3 hole containing the sample in the plastic water sheets (a) before and (b) after (21Gy) irradiation.
49
Fig. 2.4: absorbance spectra of colloidal solutions with 1mM AgNO3 and 1% C6H5O7Na3 after gamma irradiation at 8 Gy, 10 Gy, 21 Gy, 40 Gy, 80 Gy, 120 Gy respectively.
50
Fig. 2.5: dependence of the absorbance peak intensity on the absorbed dose.
50
Fig 2.6: absorbance spectra of colloidal solution with 1 mM AgNO3 and 0.1% C6H5O7Na3 after gamma irradiation with 2 Gy, 4 Gy, 6 Gy (a) and 8 Gy, 10 Gy, 21 Gy, 40 Gy, 80 Gy, 120 Gy (b).
51
Fig: 2.7: dependence of the absorbance peak intensity on the absorbed dose.
51
Fig. 2.8: AFM image of the nanoparticles synthesized by 8 Gy (a) and 21 Gy (b). Length and width distributions of the nanoparticles synthesized by 8 Gy (c)-(e) and by 21 Gy (d)-(f), respectively.
53
Fig. 2.9: dependence of the absorbance peak intensity on the absorbed dose for Ag nanoparticles synthesized by chemical reduction.
55
Fig. 3.1: schematic illustration of the procedure used for copper nanoparticles formation [6].
59
Fig. 3.2: (a) UV-Vis spectra of the polystyrene films containing ZnS precursors after irradiation with 2 Gy (red line) and 9 Gy (black line). The baseline was the polystyrene film containing ZnS precursors and not irradiated. (b) UV-Vis spectra of the polystyrene films containing ZnS precursors irradiated respectively with 2 Gy (blue line) and 9 Gy (red line) and not irradiated (black line). The baseline was the polystyrene
film without precursors and not irradiated.
Fig. 3.3: XRD patterns of ZnS:Mn products synthesized from low-temperature solid-state process. 1 cub(111)/hex(002); 2, cub(220)/hex(110); 3, cub(311)/hex(112).
64
Fig. 3.4: photoluminescence spectrum of the sample after irradiation of 20 Gy.
66
Fig. 3.5: photoluminescence spectra of ZnS:Mn2+ nanoparticles in glycerin after irradiation with 20 Gy (violet line), 10 Gy (blue line), 2 Gy (green line). The red line corresponds to the photoluminescence spectrum of the sample not exposed to radiation.
66
Fig. 3.6: dependence of the photoluminescence peak on the absorbed dose.
67
Fig. 4.1: schematic representation of the micro-contact printing procedure.
Fig. 4.2: TEM image of nanoparticles prepared by a “wet chemistry” approach.
74
Fig. 4.3: SEM images of carbon nanotubes grown by CCVD on silicon substrate. (a, b, c) Film edge at different magnification; (d) patterned substrate.
75
Fig. 4.4. Raman spectrum of graphene on Cu foil. 76
Fig. 4.5: X-ray diffraction pattern of Cu and Graphene on Cu. 77
Scheme 4.6: schematic views of ionization chamber prototype. 79
Scheme 4.7: (a) silicon-MWCNTs electrode and (b) copper-graphene electrode.
79
Fig. 4.8: collected charge at 310 V vs. dose for all ionizing chambers. Comparison between the collected charge at 105 MU and 310 V and that at 105 MU and 155V.
81
Fig. 4.9: collected charges vs. bias voltage for ionizing chamber with silicon-MWCNTs anode and aluminum cathode at a distance of 12 mm.
83
Fig. 4.10: collected charges at 0 V vs. dose for ionizing chamber with silicon-MWCNTs anode and aluminum cathode at a distance of 6 mm (blue indicators). Collected charge at 0 V and 105 MU (red indicator) for the same device with a distance between the electrodes equal to 12 mm.
83
Fig. 5.1: XRD pattern of the sample without alanine. 88
Fig. 5.2: XRD pattern of the sample with alanine
(n /n 0.36 2 7 3 3 C H NO AgNO ). 89
Fig. 5.3: XRD pattern of the sample with alanine
(n /n 0.18 2 7 3 3 C H NO AgNO ). 90
Fig. 5.4: SEM images for the sample without alanine (a) and with a quantity of alanine so that n /n 0.36
2 7 3 3 C H NO AgNO (b). 91
Fig. 5.5: SEM images for the samples with alanine: 36 . 0 n / n 2 7 3 3 CH NO
AgNO (a) and nAgNO3/nC3H7NO2 0.18 (b).
92
Fig. 5.6: TEM image for the sample with alanine 18 . 0 n / n 2 7 3 3 C H NO AgNO . 94
Fig. A1: ELEKTA LINAC 97
Tab. 1.1: monitor units delivered by the accelerator, corresponding dose values determined by the ionization chamber and mean value of gray levels.
27
Tab. 4.1: materials for ionization chambers electrodes. 78
Tab. 5.1: average crystallite size computed for each diffraction peak for the sample with no alanine.
88
Tab. 5.2: average crystallite size, computed for each diffraction peak, for the sample with alanine (n /n 0.36
2 7 3 3 C H NO AgNO ). 89
Tab. 5.3: average crystallite size, computed for each diffraction peak, for the sample with alanine (n /n 0.18
2 7 3 3 C H NO AgNO ). 90 List of Tables
AC Alternating Current
AFM Atomic Force Microscopy
CCVD Catalytic Chemical Vapor Deposition
CMOS Complementary Metal Oxide Semiconductor
DC Direct Current
EBL Electron Beam Lithography
EBRT/ERT External Beam Radiation Therapy
EPR Electron Paramagnetic Resonance
ESR Electron Spin Resonance
ICRU International Commission on Radiation Units and Measurements
IMRT Intensity Modulated Radiation Therapy
IR Infrared
LINAC LINear ACcelerator
MOSFET Metal Oxide Semiconductor Field Effect Transistor
MWCNTs MultiWall Carbon NanoTubes
NPs Nanoparticles
PAAm Poly(allylamine)
PDMS Polysimethylsiloxane
PMMA Poly(methyl methacrylate)
PTM PhotoMultiplier Tube
RF Radio-Frequency
SEM Scanning Electron Microscopy
SRS Stereotaxy Radiosurgey
SBRT Stereotaxy Body Radiation Therapy
SPRs Surface Plasmon Resonances
TEM Transmission Electron Microscopy
TLD ThermoLuminescence Dosimeter
TPS Treatment Planning System
UV-Vis Ultraviolet-Visible
XRD X-Ray Diffraction
2DXRT Conventional EXternal beam Radiation Therapy
eV Amount of energy gained by the charge of a single electron moved across an electric potential difference of one volt (1 eV= 1.6×10⁻¹⁹
joule) Gy SI derived unit of the absorbed radiation dose (1 Gy = 1 joule/kg) Hz SI unit of frequency, defined as the number of cycles per second of a periodic phenomenon.
keV 1 keV = 103 eV
kGy 1 kGy = 103 Gy
MeV 1 MeV = 106 eV
MHz 1 MHz = 106 Hz
MU Measure of machine output of a LINAC in radiotherapy torr Non-SI unit of pressure; 1 torr is approximately equal to 1 mm of mercury. Measurements Units
Abstract i
Dedicated to ii
Acknowledgments iii
Publications and Prizes iv
List of Figures v
List of Tables x
Nomenclature and Measurement Units xi
Table of Contents xiii
Introduction 1
Chapter 1 – Radiation Dosimetry 6
1.1 Definition of absorbed dose and absorbed dose rate 8
1.2 Properties of dosimeters 9
1.2.1 Precision and accuracy 9
1.2.2 Linearity 9
1.2.3 Dose rate dependence 10
1.2.4 Energy dependence 11
1.2.5 Spatial resolution and physical size 11
1.3 Fricke dosimeter 11 1.4 Ionization chambers 15 1.5 Film dosimeters 19 1.5.1 Radiographic film 19 1.5.2 Radiochromic film 20 Table of Contents
1.5.3 Calibration of EBT2 Radiochromic film 24 1.5.4 A comparison between the accuracy EBT2 and that of
ionization chambers 2D array 29
1.6 Thermoluminescence dosimeters 32
1.7 Semiconductor silicon diodes 35
1.8 MOSFET dosimeters 36
1.9 Alanine dosimeters 39
1.10 Bibliography 41
Chapter 2 – A dosimeter based on silver nanoparticles precursors 44
2.1 Materials and Methods 45
2.1.1 Preparation of silver nanoparticles precursors 45
2.1.2 Irradiation set up 46
2.1.3 Analysis techniques 47
2.2 Results and Discussions 48
2.1.2 Dosimeter based on colloid of precursors with 1% sodium citrate
48
2.1.2 Dosimeter based on colloid of precursors with 0.1% sodium citrate
50
2.1.3 AFM analysis 52
2.3 A comparison with a dosimeter based on colloid of Ag nanoparticles synthesized by chemical reduction
54
2.4 Bibliography 55
Chapter 3 – Response to radiation of ZnS and Cu Nanoparticles 57
3.1 Cu nanoparticles precursors 58
3.2 ZnS nanoparticles precursors 61
3.3 Mn doped ZnS nanoparticles 63
Chapter 4 – MWCNTs and Graphene based dosimeters 70
4.1 Synthesis of MWCNT and graphene 72
4.1.1 Preparation of the patterned catalyst for the MWCNTs synthesis
72
4.1.2 CCVD growth of Multiwall Carbon Nanotubes 73
4.1.3 CCVD growth of graphene 73
4.2 NiFe2O4 nanoparticles, MWCNTs and graphene characterization 74
4.3 Sensor device 77
4.4 Experimental irradiation set up 79
4.5 Irradiation measurements results 80
4.6 Bibliography 84
Chapter 5 – Silver nanoparticles in alanine 86
5.1 Synthesis of silver nanoparticles 87
5.2 XRD characterization 87
5.3 SEM characterization 91
5.4 TEM characterization 94
5.5 Bibliography 94
Conclusions 96
Appendix A – The LINac ACcelarator 99
Appendix B – Dose release techniques in Radiotherapy 103
The clinical use of ionizing radiation to obtain a necrosing or cytotoxic radiobiological effect on tumoral lesions requires wide and complex physical and dosimetrical procedures. In particular, it is necessary to calculate accurately the absorbed dose optimizing its delivery in order to treat the tumor, without affecting the surrounding healthy tissues. Delivery parameters of a prescribed dose are determined during the treatment planning, which is performed on dedicated computers using specialized treatment planning software. It is crucial to ensure that the prescribed dose is exactly equal to that delivered by the radiation source which is in general a LINear ACcelerator (LINAC).
Over the last few decades, various radiation detectors have been utilized for the measurement of the absorbed dose and in the quality assurance programs, such us ionizing chambers, Fricke dosimeters, radiographic and radiochromic films, thermoluminescence dosimeters (TLDs), semiconductor silicon diodes, Metal Oxide Semiconductor Field Effect Transistor (MOSFET) dosimeters, alanine dosimeters.
The technological development of the last few years has led to an evolution in the field of radiotherapy, in the sense of an always bigger conformation of the dose distribution to the volumes to be irradiated, through the use of very complex dose
release techniques, such as Intensity Modulated Radiation Therapy (IMRT), Stereotactic Radiosurgey (SRS) and Stereotactic Body Radiation Therapy (SBRT). In particular, high gradient of dose are used in IMRT and highly focused beams of ionizing radiation are directed on extremely little lesions in SRS and SBRT.
Priority goal in radiotherapy is the research and the tuning of suitable systems for dosimetrical measurements. In this context, my research activity has regarded the use and development of conventional detectors, such us Fricke dosimeter and radiochromic films and, above all, the development of new dosimetrical systems based on nanomaterials.
In particular, a liquid detector based on precursors of silver (Ag) nanoparticles was developed. The ionizing radiation induces the synthesis of Ag nanoparticles, as it is evident by the color change of the solution from transparent to yellow. The color is due to the establishment of an absorption band in the visible region of the optical spectrum. This band is the result of surface plasmon resonance, i.e. the oscillation of conduction electrons on the metal surface. So, it is possible to understand if nanoparticles are formed not only by color change but also by the presence of an absorption band in the visible region. This allows us to make measurements with an UV-Vis spectrometer. The relation between absorbance peak intensity and absorbed dose is linear over the whole range of doses, from 2 Gy till 120 Gy. Moreover, Atomic Force Microscopy (AFM) shows a correlation between dose and shape/dimension of the radiation-induced nanoparticles.
The response to radiation of other materials, such us silver nanoparticles, precursors of copper (Cu) nanoparticles, precursors of zinc sulphate (ZnS) nanoparticles and manganese (Mn) doped ZnS nanoparticles, was also studied. Among these materials, only Mn doped ZnS nanoparticles show a physical
variation after radiation. In particular, it was found that photoluminescence increases linearly with absorbed dose.
Both the detectors based on Ag nanoparticles precursors and Mn doped ZnS nanoparticles are not absolute dosimeters as ionization chamber or Fricke dosimeter, since they require a calibration before to be used. Ionization chambers are considered the best dosimeters because they allow absolute dose measurements and are characterized by high accuracy, stability over time and reliability. However, they have a relative large physical size which limits their spatial resolution and require a high bias voltage to achieve an acceptable collection of charges, excluding their use for in vivo dosimetry. These disadvantages require the implementation of ionization chambers with improved electrodes. For this reason, real time radiation detectors with electrodes based on vertically aligned Multiwall Carbon Nanotubes (MWCNTs) and Graphene were developed and their charge collection efficiency was studied. Their performance was also compared with that of electrodes made of a conventional material. Moreover, in order to highlight the effect of nanocarbons, reference radiation detectors were also tested. Nanocarbons dosimeters display an excellent linear response to dose and collect more charge than the others at standard bias voltage. In particular, MWCNTs based ionization chamber gives the best charge collection efficiency and it is able to work also to lower bias voltage and zero Volt, allowing in vivo applications. Graphene based ionization chambers show a semiconductor behavior because they have a good charge collection efficiency at standard bias voltage but not at lower Volts. The proposed dosimeters were also patented (Patent SA 2012°000011) and were the subject of the Business Plans presented at Start Cup Campania 2012, PNI 2012 and Nanochallenge 2012.
As further research activity, silver nanoparticles were synthesized by a green method at room temperature, reducing silver nitrate in aqueous solution by
ascorbic acid as reducing agent with the assistance of alanine as capping agent. The silver nanoparticles were characterized by X-Ray Diffraction (XRD), Scanning Electron Microscopy (SEM) and Transmission Electron Microscopy (TEM). The use of alanine in the synthesis influences the shape and the dimensions of nanoparticles. The idea to synthesize silver nanoparticles in alanine stems from the consideration that alanine dosimeters have been introduced on the market and by the successful application of silver nanoparticles precursors as radiation detector. This work can considered preliminary for the construction of a silver/alanine nanocomposites based dosimeters.
The research activity has regarded not only the fabrication of dosimeters but also their exposure to ionizing radiation in order to study their response to dose. For this reason, it was necessary to establish conventions with some Radiotherapy Units. In particular, two conventions were activated respectively with the Radiotherapy Unit of “G. Rummo” Hospital in Benevento and the Radiotherapy Unit of Check up Diagnostic Center in Salerno.
The thesis is structured as follows:
In chapter one the radiation dosimetry fundamentals and the description of standard dosimeters is furnished. Among these, Fricke dosimeter has been reproduced and tested since it is considered the father of chemical dosimeters. Moreover, a characterization of radiochromic films, their calibration and a comparison between their dosimetrical accuracy and that of ionization chambers 2D array was also performed since this dosimeter had been just introduced in the frequented Radiotherapy Unit. This has allowed to gain experience in the field of radiation dosimetry and to take confidence with materials characterization techniques.
In chapter two, the description of a dosimeter based on Ag nanoparticles precursors is furnished and the results of its response to dose, together with AFM
analysis, are discussed. Furthermore, the performance of the proposed dosimeter was compared with that of another detection system based on Ag nanoparticles synthesized in laboratory by chemical reduction instead by radiation.
In chapter three, the syntheses of precursors of copper nanoparticles, precursors of ZnS nanoparticles and Mn doped ZnS nanoparticles are furnished and the response of these materials to radiation is studied.
In chapter four, real time radiation detectors with electrodes based on vertically aligned Multiwall Carbon Nanotubes (MWCNTs) and Graphene are presented. In particular, the synthesis of these nanocarbons, their characterization and their response to radiation is provided.
In chapter five, the synthesis of silver nanoparticles in alanine is presented together with their characterization by XRD, SEM and TEM.
Appendix A contains a detailed description on the working principle of a LINAC and on its components.
In Appendix B, the principal dose release techniques used in Radiotherapy are described.
Appendix C is the Executive Summary of the Business Plan presented for Start Cup Campania competition.
Radiotherapy is the process of employing ionizing radiation to eradicate the tumor growth [1, 2]. The goal of radiotherapy is to eradicate tumor cells while sparing surrounding healthy tissue [3]. The sterilization is a result of the radiation interacting with base pairs in the DNA molecule of a cell causing single or double strand breaks.
Radiation dosimetry is a radiotherapy branch. Strictly, it [4] deals with the measurements of the absorbed dose or dose rate resulting form the interaction of ionizing radiation. More broadly, it refers to the determination of these quantities, as well as any of the other radiobiologically relevant quantities, such as kerma, exposure, dose equivalent, energy imparted and so on. One often measures one quantity, usually the absorbed dose and derives another from it through mathematical relationships.
A dosimeter can be defined generally as any device, able to provide the measure of the absorbed dose deposited in its sensitive volume by ionizing radiation. A dosimeter along with its reader is referred to as a dosimetry system.
To function as a radiation dosimeter, the dosimeter must possess at least one physical effect that is a function of the measured dosimetric quantity and can be used for radiation dosimetry with proper calibration. In order to be useful,
CHAPTER 1
radiation dosimeters must exhibit several desirable characteristics such us accuracy and precision, linearity between the dosimetric readings and dose over a wide range, small dose rate dependence, flat energy response, spatial resolution. Obviously, not all dosimeters can satisfy all characteristics, therefore, the choice of a radiation dosimeter and its reader must be made judiciously, taking into account the requirements of the measurement situation, e.g., in radiotherapy ionization chambers are recommended for beam calibrations (reference dosimetry) and other dosimeters, are suitable for the evaluation of the dose distribution (relative dosimetry) or dose verification. Moreover, the choice of a radiation dosimeter depends on the dose release techniques. In the last years sky-high precision techniques have been introduced such Intensity Modulated Radiation Therapy (IMRT), Stereotaxy Radiosurgey (SRS) and Stereotaxy Body Radiation Therapy (SBRT). In particular, high gradient of dose are used in IMRT and highly focused beams of ionizing radiation are directed on extremely little lesions in SRS and SBRT.
The situation is also more complex if one considers that to ensure that the prescribed dose in the treatment planning is equal to the dose released by the accelerator, the measurement of absorbed dose distribution is performed in a phantom, even if the ultimate check can only be made by in vivo absorbed dose measurements. Not all the dosimeters can be used for in vivo measurements. In this chapter, after introducing the principals dosimetrical quantities and describing the properties of a dosimeter, an overview of the most important dosimeters is provided, underlying their advantages and disadvantages. For two of them, the results of some measurements are also discussed. In particular, Fricke dosimeter was reproduced and tested under radiation, since it is considered the father of chemical dosimeters. Moreover, a characterization of radiochromic films, their calibration and a comparison between their dosimetrical accuracy and
that of ionization chambers 2D array was performed since this dosimeter had been just introduced in the frequented Radiotherapy Unit. This has allowed to make experience in the field of radiation dosimetry and to take confidence with materials characterization techniques.
1.1 Definition of absorbed dose and absorbed dose rate
Absorbed dose is defined by ICRU [5] as the expectation value of the energy imparted (dε by ionizing radiation to matter of mass ) (dm , thus )
m ε D d d . (Eq. 1.1) The expectation value of the energy imparted is specified to emphasize that the absorbed dose is a non-stochastic quantity, whereas energy imparted is a stochastic quantity whose value vary discontinuously in space and time.
The mean energy imparted to the matter, ε, in a given volume equals the radiant energy, R , of all those charged and uncharged ionizing particles which enter the in
volume minus the radiant energy, Rout, of all those charge and uncharged ionizing particles which leave the volume, plus the sum, Q , of all changes of
the rest energy of nuclei and elementary particles which occur in the volume ( Q > 0: decrease of rest energy; Q < 0: increase of rest energy), thus
ε Rin Rout Q. (Eq. 1.2) The unit of absorbed dose is Gray (Gy); 1 Gy is equal to 1 Joule (J) per kilograms (kg).
The absorbed dose rate, D , is the quotient of Dd by dt where D, d is the increment of absorbed dose in the time interval dt thus ,
t D D d d . (Eq. 1.3)
Its unit is Gy∙s 1 .
1.2 Properties of dosimeters 1.2.1 Precision and accuracy
In radiotherapy dosimetry, the uncertainty associated with the measurement is often expressed in terms of precision and accuracy.
The precision of dosimetry measurements specifies the reproducibility of the measurements and it has to do with random errors due to fluctuations in instrumentals characteristics, ambient conditions, and so on and the stochastic nature of radiation fields. Precision can be estimated from the data obtained in repeated measurements. High precision is associated with a small standard deviation of the distribution of measurement results.
The accuracy of dosimetry measurements expresses the proximity of their expectation value to the “true value” of the measured quantity. Thus, it is impossible to evaluate the accuracy from data themselves, as is done to assess their precision. Accuracy is a measure of the collective effect of the errors in all the parameters that influence the measurements.
Cleary precision and accuracy are separate characteristics. Measurements may be highly precise but inaccurate, or vice versa, or may be strong in both or neither of these virtues.
1.2.2 Linearity
To be useful, a dosimeter must have adequate dose sensitivity throughout the dose range to be measured. A constant dose sensitivity throughout the range provides a linearly proportional between the dosimetric reading and the dose that is desiderable for ease of calibration and interpretation.
However, beyond a certain dose range a non-linearity could set in. The linearity range and the non-linearity behavior depend on the type of dosimeter and its physical characteristics. Three examples of response characteristics of dosimetry systems are sketched in Fig. 1.1. Curve A exhibits linearity over the whole range of dose, curve B first exhibits linearity and then saturation at high doses; curve C first exhibits linearity with dose, then a supralinear behavior, and finally saturation. In general, a non-linear behavior should be corrected for.
Fig. 1.1: response characteristics of three dosimeters. Curve A first exhibits linearity with dose, curve B first exhibits linearity and then saturation at high doses, curve C first exhibits linearity with dose, then supralinear behavior, and finally saturation.
1.2.3 Dose rate dependence
If a dosimeter is to be used for measuring the time integrated dose (not the dose rate), then it is necessary that its reading is independent on the rate at which the dose is delivered, at least within the range of dose rates to be encountered.
Dose Dos im etr ic R ea ding Curve C Curve B Curve A
Ideally, the response of a dosimetry system at two different dose rates should remain constant. In reality, dose rate may influence the dosimeter readings and appropriate corrections are necessary.
1.2.4 Energy dependence
The response of a dosimetry system is generally a function of radiation beam quality (energy). Since the dosimetry systems are calibrated at a specified radiation beam quality (or qualities) and used over a much wider energy range, the variation of the response of a dosimetry system with radiation quality (called energy dependence) should be corrected for.
Ideally, the energy response should be flat, i.e., the system calibration should be independent of energy over a certain range of radiation qualities. In reality, the energy correction has to be included in the determination of the dose for most measurement situations.
1.2.5 Spatial resolution and physical size
Because the dose is a point quantity, the dosimeter should allow the determination of the dose from a very small volume, i.e., one need a “point dosimeter” to characterize the dose at a point. The use of dosimeters with very small dimensions, to a great extent, approximates a point measurement.
1.3 Fricke dosimeter
Fricke dosimeter [6, 7] is considered the father of chemical dosimeters. In a chemical dosimeter the absorbed dose is determined from some quantitative change in an appropriate material and any well-characterized chemical reaction may serve as the basis for the dosimeter.
Fricke dosimeter is composed of an aerated solution of 1 mmol/l Fe(NH4)2(SO4)2∙6H2O and 1 mmol/l NaCl in 0.4 mol/l H2SO4 . Contaminants can significantly affect performance; therefore care must be taken to clean all glassware carefully and to use high purity chemicals. Sodium chloride is added to reduce or eliminate any sensitivity to organic impurities.
The working principle of Fricke dosimeter is based on the oxidation reaction of Fe2+ ions to Fe3+ ions in consequence of radiation. The ferrous ions are in solution; therefore what is irradiated is mainly water. When ionizing radiation interacting with water, it produces a range of ions, radicals and molecules, such as H, OH, H2, H2O2, H+, OH , eaq. Different reaction occurs:
. , , , , OH Fe OH Fe OH OH Fe O H Fe O H H HO HO Fe HO Fe HO O H 3 2 3 2 2 2 2 2 2 2 3 2 2 2 2 (Eq. 1.4)
Note that the presence of O2 is necessary.
The average absorbed dose to the Fricke solution, DS is directly proportional to the change in absorbance, A:
, ) ( 3 S Fe ρlεG A D (Eq. 1.5) where is the density of Fricke solution, l is the optical pathlength, is the molar linear absorption coefficient for Fe3+ ions and G(Fe3+) is the number of Fe3+ ions formed after the absorption of an energy equal to 100 eV. The molar linear absorption depends on the temperature of the solution during readout; the number of Fe3+ ions depends on the temperature during irradiation and also on radiation energy. The absorption peak given in literature is 304 nm.
Fricke dosimeter is classified as an absolute dosimeter. This means that it can measure the absorbed dose deposited in its own sensitive volume without requiring calibration in a known field of radiation. It can be used both for photon and electron radiation source. It satisfies almost all the properties of a dosimeter, except the energy independence. Its limit is the poor response to doses below 4 Gy. Its reading system is very simple being based on an UV measurement. It is not a real time dosimeter since the readout occurs after a timeframe from irradiation.
In order to make experience in the field of radiotherapy and considering its historical importance, Fricke dosimeter was prepared in laboratory and tested under a radiation photon beam, generated by a LINear ACcelerator (LINAC - Precise ELEKTA) of “G. Rummo” Hospital and characterized by a nominal energy of 6 MeV. A vial containing Fricke solution was allocated in a water phantom (PTW) at a source-to-sample distance of 100.0 0.2 cm and irradiated with 5 Gy. The role of the water phantom is to simulate the human body. It essentially consists of a 3D water tank equipped with 3D stainless steel moving mechanism and stepper motors for an accurate detector positioning (Fig. 1.2).
The simulation of the planning treatment for Fricke dosimeter is showed in Fig. 1.3.
Fig. 1.3: simulation of the treatment planning for Fricke dosimeter with isodose values. In red the cylindrical vial containing the Fricke solution. The color red correspond to a isodose value of 115%.
A change in absorbance occurs after irradiation at a wavelength of 304 nm, as it is evident by the UV-Vis spectrum (Fig. 1.4), measured with a double beam spectrophotometer (PerkinElmer).
Fig. 1.4: change in absorbance after irradiation vs. wavelength for Fricke solution.
1.4 Ionization chambers
The ionization chamber is the simplest of all gas-filled radiation detectors, and is used for the detection or measurement of ionizing radiation, particularly gamma ray exposure. It basically consists of two metallic plates separated by a distance
D. The D gap is filled with a gas or noble liquid and it defines the sensitive
volume of the chamber. A bias voltage is applied to maintain a uniform electric field between the electrodes. When ionizing radiation interacts with the gas or the noble liquid, ion-electron pairs are created. Under the electric field, positive ions and electrons drift in opposite directions toward the anode and cathode, respectively, where the charge produced by ionizing particles is collected.
The ionization chamber is the most widely used type of dosimeter for precise measurements, such as those required in radiotherapy [4]. It is an absolute dosimeter as Fricke detector and, for this reason, it is used for beam calibration. Ionization chambers have various shapes and sizes depending upon the specific requirements. Two models are essentially used for radiotherapy: thimble chamber and plane-parallel ionization chamber.
A thimble chamber is basically a cavity surrounded by a conductive outer wall and having a central collecting electrode (Fig. 1.5 a). The wall and the collecting electrode are separated with a high quality insulator to reduce the leakage current when a polarizing voltage is applied to the chamber. PTW Farmer Chamber Type 30010 [8] is represented in Fig. 1.5 b.
Fig. 1.5: (a) basic design of a thimble ionization chamber; (b) PTW Farmer Chamber Type 30010.
A guard electrode is usually provided in the chamber to further reduce the chamber leakage. The guard electrode intercepts the leakage current and allows it to flow to ground bypassing the collecting electrode.
A parallel-plate ionization chamber consists of two plane walls, one serving as an entry window and polarizing electrode and the other as the back wall and collecting electrode as well as guard-ring system. The electrodes usually contain a
(a)
several millimeters thick plastic covered with conductive materials, such as aluminum or graphite coated Mylar®.
A schematic diagram of a parallel-plate ionization chamber is provided in Fig. 1.6 a. Advanced Markus Chamber Type 34045 [8] is represented in Fig. 1.6 b.
Fig. 1.6: (a) diagram of a parallel-plate ionization chamber: 1 is the polarizing electrode; 2 is the measuring electrode; 3 is the guard ring; a is the height (electrode separation) of the air cavity; d is the diameter of the polarizing electrode; m is the diameter of the collecting electrode; and g is the width of the guard ring (adapted from the IAEA TRS-381 dosimetry protocol [9]). (b) PTW Advanced Markus Chamber Type 34045.
The reading system consists of an electrometer, i.e. a highly sensitive electronic voltmeter whose input impedance is so high that the current flowing into it can be considered, for most practical purposes, to be zero.
An electrometer used in conjunction with an ionization chamber is a high gain, negative feedback, operational amplifier with a standard resistor or a standard capacitor in the feedback path to measure the chamber current or charge collected over a fixed time interval, as shown schematically in Fig. 1.7.
Fig. 1.7: electrometer in feedback mode of operation.
Electrometers are able not only to measure small current of the order of nA or less but also to apply a bias voltage between the electrodes of the ionization chamber. For this reason, they are also equipped with a HV power supply.
Rf = feedback resistor
(variable to very sensitivity) Cf = feedback capacitator (variable to very sensitivity)
V = I Rf (rate mode) V=(I t)/ Cf (integrated mode) Rf I + Cf
Ionization chambers have desiderable properties such as high accuracy, stability over time and reliability. Moreover, they are real-time dosimeter and allow absolute measurements of dose. Ionization chambers present two disadvantages: they have a relative large physical size which limits their spatial resolution and require a high bias voltage to achieve an acceptable collection of charges. This limit excludes their use for in vivo dosimetry.
1.5 Film Dosimeters 1.5.1 Radiographic film
Radiographic film [4, 10] consists of microscopic grains of silver bromide (AgBr), dispersed in a gelatin layer on either one or both sides of a thin plastic base. Incident charged particles produce ion pairs in or near the grains, and their effect is to convert Ag+ ions to Ag atoms. A few such Ag atoms on a grain (containing typically 1010 Ag+ ions) constitute a latent image, which renders the grain developable by a chemical process. In that process all of the Ag+ ions are converted to Ag atoms and the bromide is removed, leaving behind an opaque microscopic grain of silver. The presence of this elemental silver may be detected optically and quantitatively related to the absorbed dose.
The radiation effect is measured in terms of the light opacity of the film, as measured by a densitometer, whose principle of operation is shown in Fig. 1.8. Opacity is defined as Io/I, where Io is the intensity of light incident on the film, and I is the intensity transmitted through the film. The optical density is defined as OD = log10 (Io/I) and is a function of dose.
Unexposed film would exhibit a background optical density called the fog density (ODf). The density due to radiation exposure called the net optical density can be obtained from the measured density by subtracting the fog density.
Fig. 1.8: schematic diagram of a basic film densitometer.
The advantage in using radiographic film is that it gives excellent 2D spatial resolution and, in a single exposure, provides information about the spatial distribution of radiation in the area of interest or the attenuation of radiation by objects. However, radiographic film dosimeter presents several disadvantages such as the sensibility to light, a limited useful dose range, the pronounced energy dependence for lower energy photons, the dependence of response on several, difficult to control, parameters and the necessity of a chemical processing. Moreover, the relationship between the dose and OD should be linear, but unfortunately this is not always the case. Some emulsions are linear, some are linear over a limited dose range and others are non-linear.
1.5.2 Radiochromic film
Some of the difficulties encountered with radiographic film are solved with radiochromic film dosimeters. These detectors [10], with very high spatial resolution and relatively low spectral sensitivity variation, are insensitive to visible light, thus offering ease of handling and preparation in room light.
film Io
I
+
LOG RATIO AMPLIFIER
2.99
(3½ digits DPM) OD = log10 (Io/I)
Radiochromic dosimeters color directly and do not require chemical processing; a color change (colorless to blue, red, green, etc.) indicates exposure to radiation. Image formation occurs as a dye-forming or a polymerization process, in which energy is transferred from an energetic photon or particle to the receptive part of the leuko-dye or colorless photomonomer molecule, initiating color formation through chemical changes.
GAFChromic EBT2 film [11] is the radiochromic dosimeter more used. Like its predecessors, this film is self-developing, but has some improved features. In particular it contains a yellow “marker” dye, a feature that minimizes response differences caused by coating anomalies; it is energy independent from 50 keV into the MeV range and is more tolerant to light exposure and less prone to damaged edges when cut.
As reported in [11], GAFChromic EBT2 is made by combining a clear, polyester over-laminate with the active film coating. The substrate of the active film is clear 700 gauge (175 micron) polyester. The substrate is coated with an active layer film, nominally 30 microns thickness, over which a topcoat, nominally 5 microns, is applied. The over-laminate, 200 gauge (50 micron) polyester with approximately 25 microns of pressure-sensitive adhesive, is bonded to the coated side of the active film. The configuration of EBT2 is shown in Fig 1.9 a.
A characterization of GAFChromic EBT2 was performed using the Scanning Electron Microscopy (SEM) of Liquid Crystal Laboratory (LiCryL) at University of Calabria. The identification of the GAFChromic EBT2 layers by SEM is reported in Fig 1.9 b.
F ig. 1 .9 : (a ) GA F C ro mi c E B T 2 conf igu ra ti on; (b) i de nti fica ti on of the laye rs by S E M . (a ) (b)
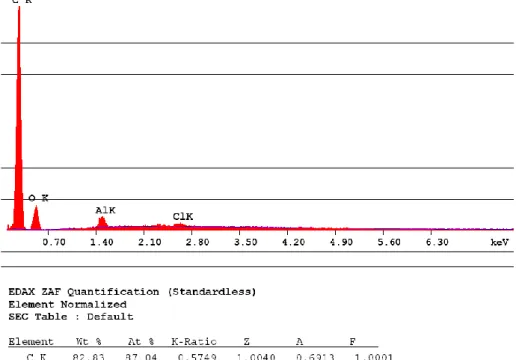
The atomic composition of active layer (Fig. 1.10) was determined by SEM.
Fig. 1.10: atomic composition of active layer.
The further analysis executed with IR highlights saturation problems due to the fact that films are not completely transparent (Fig. 1.11). However, it is possible to note some peaks in the range 3400-3500 cm-1, probably due to the presence of alcohols, in the range 2950 ~ 2850 cm-1 corresponding to the presence of alkanes and in the range 2000 ~ 2500 cm-1 (ammine salts).
Even though it has not been possible to determine of what material the film and in particular the active layer were made, the performed measurements have been useful for taking confidence with some characterization techniques.
1.5.3 Calibration of EBT2 Radiochromic film
A radiochromic film is not an absolute dosimeter so it is necessary to calibrate it before quality assurance programs.
The calibration was performed at Check up Diagnostic Center [12]. Two sheets of GAFChromic EBT2 film were cut to obtain 16 samples. They were appropriately marked to maintain consistent orientation during scanning. In fact it was found that there is a dependence of scanner response on the film orientation upon the scanner plane. The effect is due to the shape and the behavior of the polymers present in the active layer. The active layer films consists of small needle – shaped particles of about 1 – 2µm in diameter and 15 – 25 µm in length which tend to align with their long axis parallel to the direction of the film coverage. This preferential orientation results in a greater spread of light in the direction normal to coverage rather than parallel to it.
Then, each sample was positioned in a phantom according to a set up characterized by the following geometrical parameters: a distance between the
irradiation source and the film equal to 100.0 0.2 cm, a field size of 10 10 cm2 (Fig. 1.12).
Fig. 1.12: the experimental set up used to irradiate radiochromic film GAFChromic EBT2.
The phantom used for experimental measurements is the PTW solid phantom (model 29672) and consists of modules of RW3, a tissue – equivalent material composed by white polystyrene containing 2% of titanium oxide (TiO2). Other five modules were putted above the film in Fig. 1.12, so that the distance between the source and the surface of the phantom was equal to 95.0 0.2 cm.
The irradiation of the samples was performed using ELEKTA Synergy accelerator with a 6 MeV photon beam. The samples received 5, 20, 40, 60, 80, 100, 120, 140, 160, 180, 200, 250, 300, 350, 400 Monitor Unit (MU), respectively. The MU is the measure of machine output of the LINAC, which is calibrated to give a particular absorbed dose. The conversion factor between Monitor Unit and dose was determined by means of the ionization chamber 30013 Farmer, connected to the electrometer PTW UNIDOS (Fig. 1.13), using the same set up of radiochromic films. In particular 100 MU were given at temperature room equal to (26.8 0.01)°C and pressure of (1008 1)mBar. In this reference setup, 100 monitor units were equal to 92.792 cGy.
Fig. 1.13: ionization chamber 30013 Farmer, connected to the electrometer PTW UNIDOS.
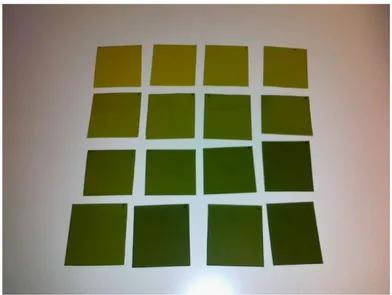
After irradiation, the samples changed color according to the dose (Fig. 1.14).
Fig. 1.14: not irradiated sample (up left); the irradiated samples (in total 15) show a different color according to the dose.
The transmission scanner Epson Expression 10000XL, in color mode RGB, 48 bit (16 bits per color), was used as reading system. The scanner was able to detect
transmitted light through the film by adopting a numerical scale, the so called gray levels, ranging from 0 (no transmission) to 65535 (no attenuation).
Before carrying out the several scans of the films, it was necessary to set the various acquisition parameters ensuring that they were always the same in all acquisitions and execute three “empty” scans to ensure the heating of scanner lamp. Each sample was placed in the center of the scanner and it was scanned with 72 dpi resolution and saved as a 48 – bit RGB uncompressed tagged image file format (TIFF) image file.
Then, using ImageJ program, a ROI (Region of Interest) of 4 cm 4 cm was selected on each sample, avoiding the edges and the average value of the gray levels of the pixels belonging to the ROI (Tab. 1.1) was measured.
Monitor Units (MU) Dose (cGy) Mean value of Gray Level <LG>
0 0 44167 5 4.7 43714 20 18.9 42626 40 37.8 41439 60 56.7 40219 80 75.6 38833 100 94.5 37817 120 113.4 36680 140 132.3 35664 160 151.2 34752 180 170.0 33854 200 188.6 33045 250 236.2 30989 300 283.4 29014 350 330.6 27540 400 377.9 26126
Tab. 1.1: monitor units delivered by the accelerator, corresponding dose values determined by the ionization chamber and mean value of gray levels.
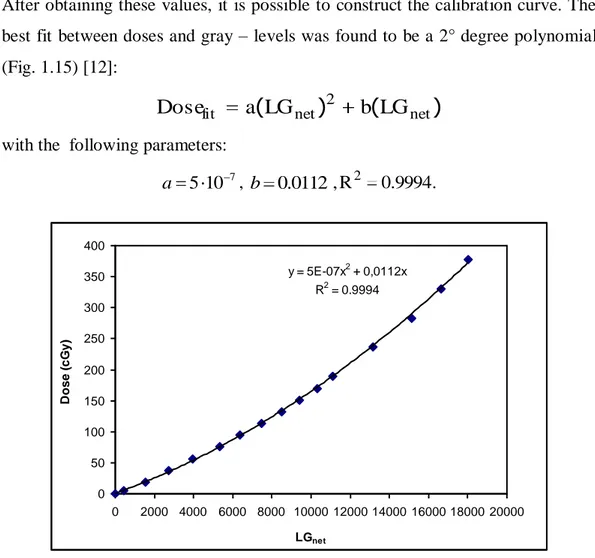
After obtaining these values, it is possible to construct the calibration curve. The best fit between doses and gray – levels was found to be a 2° degree polynomial (Fig. 1.15) [12]:
)
(
)
(
2 net net fita
LG
b
LG
Dose
with the following parameters:
7 10 5 a , b 0.0112,R2 0.9994. y = 5E-07x2 + 0,0112x R2 = 0.9994 0 50 100 150 200 250 300 350 400 0 2000 4000 6000 8000 10000 12000 14000 16000 18000 20000 LGnet D o s e ( c G y )
Fig. 1.15: calibration curve of the film EBT2 (Dose vs. LG net).
Despite the advantages of EBT2 radiochromic dosimeters, they do not allow real time real time measurements and they require, as shown, a complex calibration. Moreover, their response in not linear with dose and depends on scanner orientation.
1.5.4 A comparison between the accuracy EBT2 and that of ionization chambers 2D array
After EBT2 film calibration, a comparison between its accuracy and that of an ionization chambers 2D array was performed on an IMRT prostate treatment plane [12].
The 2D array dosimeter used is a matrix of 27 × 27 (729) ionization chambers, which cover an active area of 27 cm × 27 cm (Fig. 1.16). In the 2D array center, there is an ionization chamber which has to be positioned in the beam isocenter. The ionization chambers have cubic shape, size 5 mm × 5 mm × 5 mm with a total volume equal to 0.125cm3. The sensitive material of chambers is graphite, while the material that surrounds and covers the chambers with a thickness of 5 mm is PMMA. The measurement range of this dosimeter is from 200 mGy to1000 Gy. Although the 2D array is already calibrated in absorbed dose to water, normally each measurement must be corrected for different air pressure and temperature, for the used photon quality and for possible non – water equivalent properties of the phantom. To avoid these corrections, which are time – consuming and susceptible to errors, a simple calibration field with a known dose was applied.
Fig. 1.16: PTW 2D ionization chambers 2D array in solid phantom at a distance between its centre and the beam source equal to 100.0 0.2 cm.
The advantage of using 2D array is that, contrary to single ionization chamber, they allow to acquire planar data in very quick times.
The dosimetric check consists in comparing the dose distribution calculated by the Treatment Planning System (TPS) with that measured by radiochromic film EBT2 or 2D array. TPS calculates the dose in the phantom corresponding to the contribution of each beam which is turned on separately after the dose calculation is finished.
In order to make the comparison, it was necessary to determine the calibration curve through the application FilmCal of PTW Mephysto mc2 program, for EBT2 film. Then, it was possible to calculate the doses corresponding to the gray levels of the plane treatment on EBT2 film using the calibration curve and the Film Analyze application of PTW Mephysto mc2 program. After that, the image of the prostate plane tratment with the dose values was saved has .tiff and sent to Verisoft. Finally using the application Compare of Verisoft program in γ index mode [13, 14], the degree of agreement between the calculated dose distribution and that measured by radiochromic film was obtained and resulted about 95% (Fig. 1.17). Both cold and hot spots were present (Fig. 17c).
The application Compare was also used for the quantitative assessment of the agreement between the dose distribution calculated by TPS and that measured with 2D array (Fig. 1.18). The degree of agreement resulted about 94%; cold spots were present (Fig. 1.18 c).
The dosimetrical accuracy of GAFChromic EBT2 film is comparable with that of 2D array. There is not a significant difference in the agreement degree between the dose distribution calculated by TPS and that measured with 2D array and the TPS dose distribution and that measured with GAFChromic EBT2.
F ig. 1 .17 : (a ) dos e dis tr ibut ion mea sur ed by r adioc hr omi c fil m, ( b) dos e dis tr ibut ion c alcula ted by T P S , (c ) map o f va lues of γ index . F ig . 1 .18 : (a ) dos e dis tr ibut ion mea sur ed by ioni za tion cha mber s 2D ar ra y , (b) dos e dis tr ibut ion ca lcula ted by T P S, ( c) map of va lues of γ index.
Moreover, GAFChromic EBT2 films require an expensive calibration procedure (paragraph 1.5.3), and do not give a real time measurement. On the contrary, 2D arrays are ease to use and do not require an expensive calibration and a delay between irradiation and read – out of the dosimeter. Ion chambers arrays offer the best combination of accuracy, spatial resolution, and ease of use. For this reasons, Malcolm R. McEwen thesis [15], that is better to use ion chamber arrays for IMRT quality assurance, have to be supported.
1.6 Thermoluminescence dosimeters
A thermoluminescence dosimeter (TLD) [4, 16] is a crystalline dielectric material containing suitable activators to make it perform as a thermoluminescent phosphor. The activators provide two kinds of centers, or crystal-lattice imperfections:
traps for electrons and “holes”, which can capture and hold the charge carriers in an electrical potential for usefully long periods of time;
luminescence centers located at either the electron traps or the hole traps, which emit light when the electrons and holes are permitted to recombine at such a centre.
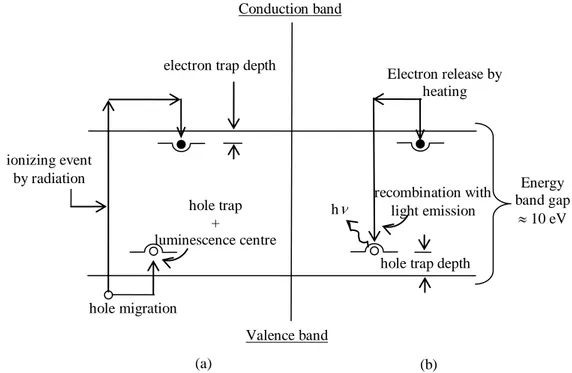
A useful phenomenological model of the thermoluminescence (TL) mechanism is provided in terms of the band model for solids and it can be illustrated with the energy-level diagram, represented in Fig. 1.19. In particular, the left side of this figure shows an ionization event elevating an electron into the conduction band, where it migrates to an electron trap. The hole left behind migrates to a hole trap. At the temperature existing during irradiation, for example room temperature, these traps should be deep enough in terms of potential energy to prevent the escape of the electron or hole for long periods of time, until deliberate heating release either or both of them. In Fig. 1.19 b the effect of such heating is shown.
Assuming that the electron trap in the phosphor is “shallower” than the hole trap, the electron again enters the conduction band and migrates to a hole trap, which can either act as a luminescence centre or to be closely coupled to one. In that case recombination is accompanied by the release of a light photon.
Fig. 1.19: energy-level diagram of the termoluminescence process: (a) ionization by radiation and trapping of electrons and holes; (b) heating to release electrons, allowing luminescence production.
The recombination probability depends on temperature; for this reason, the emission of light is function both of temperature and heating time.
To count the released light which is proportional to trapped electrons and so to the absorbed dose, it is necessary to use photomultiplier tubes. In particular, a basic TLD reading system consists of a planchet for placing and heating the TLD dosimeter; a photomultiplier tube (PMT) to detect the TL light emission, convert
ionizing event by radiation Conduction band Valence band hole trap + luminescence centre electron trap depth
hole trap depth
Energy band gap 10 eV hole migration Electron release by heating recombination with light emission h (a) (b)
it into an electrical signal, and amplify it; and an electrometer for recording the PMT signal as charge or current. A basic schematic diagram of a TLD reader is shown in Fig. 1.20.
Fig. 1.20: schematic diagram of a TLD reader.
TL dosimeters most commonly used in medical applications are LiF:Mg,Ti, LiF:Mg,Cu,P and Li2B4O7:Mn, because of their tissue equivalence. Other TLDs, used because of their high sensitivity, are CaSO4:Dy, Al2O3:C and CaF2:Mn. TLDs are available in various forms (e.g., powder, chips, rods, ribbon, etc.). Before they are used, TLDs have to be annealed to erase the residual signal. Well-established reproducible annealing cycles should be used including the heating and cooling rates.
A thermoluminescence dosimeter presents some advantages such as response with a low dependence on photon energy, low cost, small size, the possibility to perform in vivo measurements. Moreover, the dose response is linear over a wide range of doses used in radiotherapy, although it increases in higher dose region exhibiting supralinear behavior before it saturates at even higher doses. The disadvantages include sensitivity to environmental conditions, fading due to
heater PMT TLD HV power supply TL ~ charge
temperature or light effects. Indeed, TL signal decreases in time after the irradiation due to spontaneous emission of light at room temperature. Moreover, TL dosimeters have to be calibrated before they are used (thus they serve as relative dosimeters), require annealing procedures and can not considered real time dosimeter, since the reading time is about 2 min.
1.7 Semiconductor silicon diodes
Semiconductor silicon diode dosimeter [4, 17] is a p-n junction diode. The diodes are produced by taking n-type or p-type silicon and counter-doping the surface to produce the opposite type material.
At the transition from p- to n-type material, a charge-free “depleted region” is formed, over which an electrostatic potential difference of about 0.7 V is created. When ionizing radiation passes through the dosimeter, it produces electron-hole (e-h) pairs. The minority carriers (electrons on the p side and holes on the n side) diffuse into the depleted region. Those carriers within approximately one diffusion length from the junction edge are able to reach it before they recombine. They are then swept across the junction under the action of the electric field due to the intrinsic potential. In this way a current, proportional to the number of charges created, is generated in the reverse direction in the diode and it can be read by an electrometer (Fig. 1.21).
The charge collection in a semiconductor diode is very different than in an ionization chamber. While an ionization chamber requires a high voltage supply, the high electric field across the pn junction makes charge collection possible for the diode without external bias; for this reason they are widely used in routine in-vivo dosimetry on patients. This is not the only advantage. Diodes are more sensitive and smaller in size compared to typical ionization chambers. They are real time dosimeter and exhibit a linear response to dose. The disadvantages
include the dose response dependence on temperature (particularly important for long treatments), on the dose rate and on energy even for small variation in the spectral composition of radiation beams. Moreover, their sensitivity changes with repeated use due to radiation damage; for this reason they are relative dosimeters and require a periodic calibration.
Fig. 1.21: principle of diode detection without external bias (in short-circuit mode).
1.8 MOSFET dosimeters
Like silicon diode dosimeters, Metal Oxide Semiconductor Field Effect Transistor (MOSFET) dosimeters [18, 19] belong to the category of the semiconductor detectors. The basic MOSFET structure is depicted in Fig. 1.22. The type shown is a p-type MOSFET which is built on a negatively doped silicon substrate (n type). Two terminals of the MOSFET called the source and the drain are situated on the top of a p-doped silicon region. The third terminal shown is the gate. Underneath the gate is an insulating silicon dioxide layer and underneath this
Electrometer + + + + + + + p n E + I Diode
layer is the silicon substrate. The region of the substrate immediately below the oxide layer is known as the channel region.
Fig. 1.22: schematic representation of a p-channel MOSFET showing the oxide, the substrate, the source, the drain and the gate.
When a sufficiently large negative voltage is applied to the polysilicon gate a significant number of minority carriers (holes) will be attracted to the oxide/silicon surface from both the bulk silicon substrate and the source and drain regions. Once a sufficient number of holes accumulated there, a conduction channel is formed, allowing the current Ids to flow between source and drain. The voltage necessary to initiate current flow is known as the device threshold voltage (VTH).
When a MOSFET device is irradiated, three things happen within the silicon dioxide layer (sensitive region): a build-up of trapped charge in the oxide; the increase in the number of interface traps; and the increase in the number of bulk oxide traps.
Electron-hole pairs are generated within the silicon dioxide by the incident radiation. Electrons, whose mobility in SiO2 at room temperature is about 4 orders