The 55% tax reductions for building retrofitting in Italy: the results
of the ENEA’s four years activities
Giampaolo Valentini, Patrizia Pistochini
ENEA, Italian National Agency for New technology, Energy and the Sustainable Economic Development
Abstract
The tax deductions of 55%, in force since January 2007, represents the most generous system of incentives ever established by the Government to promote energy efficiency and sustainable economic development in the Italian real estate system. By the Finance Act 2007 and the subsequent implementation all efforts were addressed to limit the energy consumption during winter heating period.
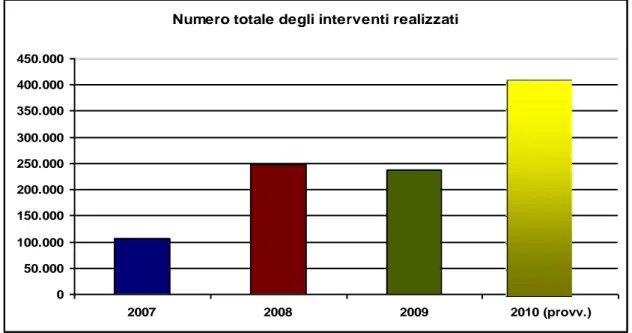
The results have been successful. Since 2007, 106,000 requests for deduction have been submitted. In the following years the public acceptance for this type of incentives has been further confirmed and strengthened. In late 2008, about 248,000 people had taken advantage of deductions. In 2009 the situation stabilized with 238,000 interventions, confirming the validity of the measure and the users’ satisfaction. In 2010, finally, the expectations have been achieved at the same levels of the previous years.
During the first three years about 8 billion € spent by taxpayers, over 4,400 GWh of energy saved per year, roughly one million tons of CO2 emissions avoided. The validity of the incentives has been
extended until the end of December 2011. The ENEA working group, appointed to manage the incentives, has supported the its renewal as represents benefits for the citizens and for the government in terms of tax return, energy saved and employment.
The results
The tax deductions of 55%1, in force since January 2007 represents the most generous system of incentives ever established by the Government to promote energy efficiency and sustainable economic development in the Italian real estate system. By the Finance Act 2007 and the subsequent implementation2, all efforts were addressed to reduce energy waste by allowing specific works including: the overall redevelopment of buildings and installation of new biomass boilers, the insulation of horizontal and vertical walls, replacement of windows and entrance doors, installation of thermal solar panels, replacement of heating systems with condensating furnaces or high efficiency heat pumps. All these measures have been established to limit the energy consumption during the winter heating period.
The results have been successful. After a period of several months during which users facing with such generosity felt incredulous, since autumn 2007, the requests for deductions – referred to implemented efficiency measures - are literally taken off, reaching 106,000 units only in the last quarter of the year.
In 2008 the public acceptance for this type of incentive was further confirmed and strengthened. At the end of the year, about 248,000 people took advantage of deductions. The relevant number of requests surprised even the Ministry of Economy and Finance, who, getting worried about the lost revenue that was taking shape, was considering stopping the incentives. That initiative was rejected immediately after loud protests by all stakeholders and especially by people who had already taken action.
1
The system allows for the tax cuts on personal income tax (income tax) and tax on corporate income tax (IRES) for end-users carrying out energy saving measures for winter heating in existing buildings
2
Other numbers referring to the first three years are relevant. About 8 billion € spent by taxpayers, over 4,400 GWh of energy saved per year, roughly one million tons of CO2 emissions avoided. The
incentives were planned to stay in force until the end of December 2010. The validity of the incentives has been extended until the end of December 2011. The ENEA working group, appointed to manage the incentives, has supported the renewal as represents benefits for the citizens and for the government in terms of tax return, energy saved and employment. A special section in the ENEA web site is dedicated for the management of the 55% tax deduction [1]
The situation has stabilized - still at high levels - in 2009: 238,000 interventions, confirming the validity of the measure and the satisfaction of citizens. In 2010, finally, the trend has not changed: more than 180,000 works ended in mid-December, exceeding the quota reached at the same date in the previous years. A further spike in demand is expected in vision of the work done in the last part of the year, especially considering the uncertainty of the extension of the deductions beyond December 2011. That fear forced many users to anticipate the renovations planned for the current and the following years, in order not to miss the given opportunity.
The results up to now have been very flattering and probably well beyond the expectations of the Ministery: about 800,000 people have taken advantage of them until mid-December 2010, proving an unforeseen success. In this regard, it also acknowledges the results achieved by the ENEA Working Group "Energy Efficiency" that relying only on very few human resources, has proved its competence and engagement to spread information and advice to the public and professionals3.
A closer look at Figure 1 shows in detail the results of the number of interventions realized in 2007-2009. Data related to 2010 are not yet available, but are not expected to be qualitatively very different from the previous ones. After a slight growth in 2008, when they doubled compared to 2007, in 2009 the number of interventions has remained nearly unchanged. In 2010 we might estimate an increase by 71,3%. The total of the realized works could amount to 1 million.
Figure 1 – Number of realized interventions per year (2010 estimated)
Similarly, the graph in Figure 2 shows the total cost incurred during the four years of operations. The trend is obviously similar to the previous one. 2008 was characterized by an increase in work still
3
This work is still going on by the link "Contact Us" in the mentioned site, through various forms: consulting via e-mail and by phone, interventions in courses, seminars, conferences and in trade fairs.
Numero totale degli interventi realizzati
0 50.000 100.000 150.000 200.000 250.000 300.000 350.000 400.000 450.000 2007 2008 2009 2010 (provv.)
2008.
Figure 2 – Investments supported per year (2010 estimated)
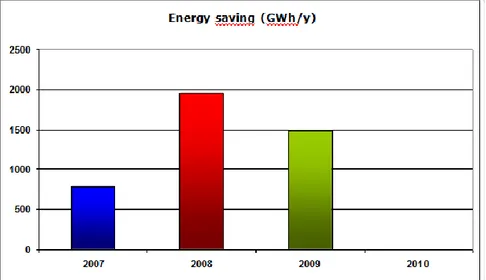
Figure 3 describes the results of operations made in terms of energy savings achieved; cost savings have increased from 787 GWh in 2007, to nearly 2000 GWh in 2008 and about 1700 GWh in 2009. According to AEEG (Italian Authority foe Electric Power and Gas), 1 toe saved can be valorized in about 350 €. and, consequently, 1 GWht =>30,000 €. So energy saving can be valorized in 23.6 M€ for 2007, 58.8 M€ for 2008 and 44.6 M€ (final datum) for 2009.
Figure 3 – Energy savings per year (2010 non available)
Figure 4 shows the distribution of the requests sent in by regions and referring to interventions subject to tax break in 2008. The most virtuous region in terms of number of tax deduction requests was Lombardy, Veneto, Piemont and Emilia Romagna come equal third. The Molise region and more generally the South have a rather marginal position.
Figure 4 – Number of requests per Italian regions and %
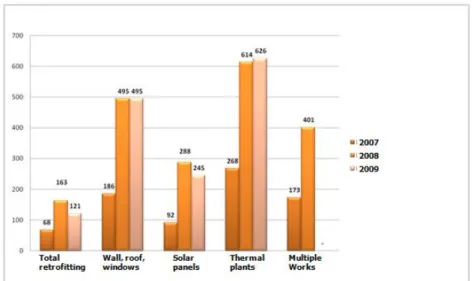
Figure 5 shows the total number of interventions by type. What emerges is the clear dominance of the replacement of windows and insulation in walls and roofs (Section 345 of the 2007 Budget: about 55% of all jobs): of these, however, note the overwhelming majority of its replacement windows (it's the easiest thing to do and less invasive) with over 91% of these measures (which is approximately half of all), while only 3% is for the isolation of the vertical and horizontal opaque structures do not reach the 6%. Here is the ranking in replacement of heating systems (paragraph 347) with 27% of the total, the installation of solar panels (paragraph 346, over 14%) and the overall redevelopment of the building (paragraph 344) with just over 3%. And it's understandable: a comprehensive redevelopment of the building work is expensive and complicated, but gives excellent results in terms of energy savings and reduction of CO2 emissions.
Figure 5 – Number of interventions per paragraph
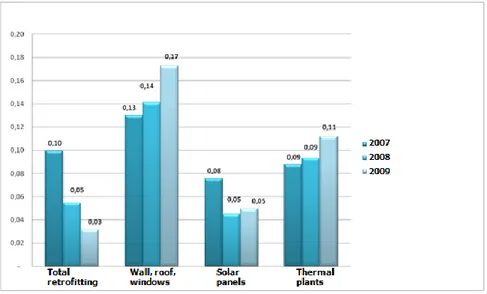
To complete the picture, it’s important to take a look at the performances obtained. Figure 6 shows the average cost of a saved kWh depending on the paragraph referred to and taking into account the
retrofitting of the building (p. 344) are far more convenient and the payback time is faster. It is important to be aware that paragraph 345 includes both the replacement of fixtures and the insulation of walls and garrets. Consequently the following elaboration presented by Figure 7 considers the individual types of intervention, identifying the average annual savings in MWh that each intervention can reach. The insulation of opaque horizontal structures (roofs, garrets and floors) give the best results in terms of energy efficiency recovery.
Figure 6 – Average cost for a saved kWh in 2007-2009 (considering the useful lifetime of plants)
Figure 7 – Energy Savings achieved per type of intervention (MWh)
Among the five types of intervention incentivized, the best results were obtained with the insulation of floors, roofs and garrets (an average of 20.6 MWh saved per intervention/year, valued about € 1645, assuming a cost of kWh produced by conventional boiler powered with gas equal to 0.08 €). These are followed by the replacement of thermal insulation of walls, installation of solar panels and replacement of fixtures (2.56 MWh savings on average for the latter action equivalent to 164 € / year assuming the above). The above remarks highlight a ratio of 1 to 10 between the most and the less efficient interventions promoted. It 'clear, however, that the costs for achieving each of these works are very different and are usually directly proportional to the energy savings achieved.
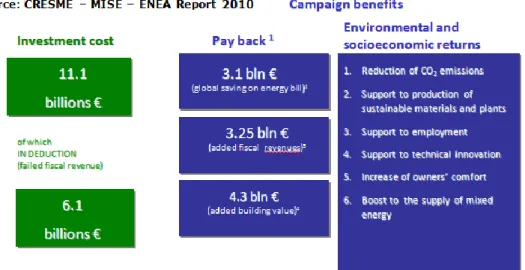
Finally, we propose some considerations for the estimation of the effects of incentives. Referring to Figure 8 we can come-up with some results arising from a recent report prepared by the Working Group “Energy Efficiency” in collaboration with Cresme [2] covering the period 2007-2010. Granted that the 2010 data are only estimated, it can be seen that the total cost of the investment by users in four years would be € 11.1 billion. Out of these the 55%, amounting to 6.11 billion, is paid by the State. Given this expenditure, however, we have the following monetary returns: 3.1 billion of savings on energy bills of consumers due to lower consumption of energy during the lifetime of the plant; 3.25 billion in additional tax revenues on VAT, IRES, income tax paid by enterprises and professionals engaged in the rehabilitation projects, drawing their incomes; 4.31 billion for the increase in real estate income for the revaluation of reclassified buildings.
Figure 8 – Costs and benefits to 2015 of interventions performed from 2007 to 2010 These data amount to a total of € 10.66 billion which exceeded just by themselves the tax burden charged to the State. In addition there are other benefits, not quantified in detail, such as environmental and socio-economic returns, as of the reduction of CO2 emissions resulting from
reduced health and social costs, the support to industrial production of plants and sustainable technologies, backing to employment, overall youth, the drive for technological innovation and, last but not least, the increased comfort of the users of buildings and the improvement of the national energy supply mix.
Conclusions
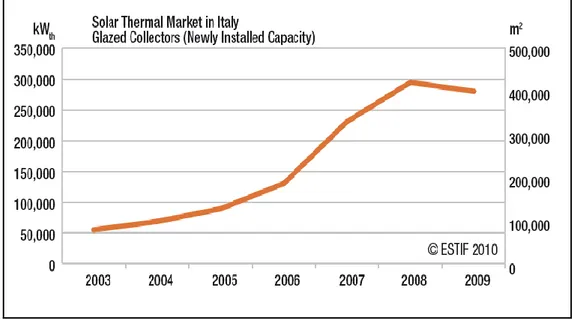
After the presentation of the results of four years of tax deductions, we can point out that, compared to a certain remarkable loss of state income, benefits are certainly not less significant. In general, since 2007 a real boom in Italy in the energy efficiency market occurred, both in terms of industrial production, and in terms of employment for the workers involved, not only employees but also professionals. Just as an example, we can draw your attention to what has happened in the solar thermal market in 2009 (Fig. 9).
Figure 9 – Solar Thermal Market in Italy (2003 – 2009) – source: Assosolar
During this year the Italian market [3] is growing continuously and has consolidated its second position in Europe, after Germany, with 280 MWt installed during the year. The curve of the increase in power has soared just from 2007 as showed in Figure 8 [4], when the deductions started. From 2006 to 2008 the turnover of solar thermal quintupled, creating the opportunity for new jobs, estimated as one job every 80 kWt of new installed power. Considering that Italy is only at the 14th place among European countries in terms of installed capacity per capita, we realize the enormous exploitable capacity still available.
But beyond the solar thermal energy success, what could be the strategy to be pursued in the future to achieve maximum results and minimum charges from the system of incentives? Probably the best solution could be found in a mix of measures, by modulating different rates of deduction and in the identification of products/plants object to the incentive systems referring to their expected results and tasks of the Government in accordance with the international agreements and treaties. Some distortions arising from an examination of the interventions and in some cases of improper use of incentives can be easily corrected with targeted controls by using the database held by ENEA, or imposing more limited expenditure targeted for each job respect to the present ones that many times may seem abundant.
This system would be maintained and eventually stabilized and implemented, for example with an appropriate service of information and assistance to users. The contribution given by the working Group of ENEA has been deeply appreciated by the press, the operators and policy-makers as it has hit the target for energy efficiency and reduction of greenhouse gases. The Italian Government is hoped both to provide assurance in the medium - long term to end-users and to the Italian business system, in order to contribute to achieve the energy-environment targets signed by Italy at European level.
Controlling are demanded both to professional technicians who have to confirm declared savings in a preventive way and to Agenzia delle Entrate (National Revenue Agency)in a final way by asking proof of performed works to applicant. Popularity of the system is due to extreme generosity of the incentive, its simplicity (no authorizations or licenses required) and universality towards all social subjects. In 2010 we had an increase of requests of about 71% on 2009.
References
[2] Enea-MSE-Cresme: “Analisi sull’impatto socio-economico delle detrazioni fiscali del 55% per la riqualificazione energetica del patrimonio edilizio esistente”. Roma, July 2010
[3] ESTIF (European Solar Thermal Industry Federation) 2010 [4] European Solar Thermal Industry Federation