4512
http://dx.doi.org/ 10.3168/jds.2013-7798
© American Dairy Science Association®, 2014 .
ABSTRACT
Milk coagulation is based on a series of physico-chemical changes at the casein micelle level, resulting in formation of a gel. Milk coagulation properties (MCP) are relevant for cheese quality and yield, important fac-tors for the dairy industry. They are also evaluated in herd bulk milk to reward or penalize producers of Protected Designation of Origin cheeses. The economic importance of improving MCP justifies the need to ac-count for this trait in the selection process. A pilot study was carried out to determine the feasibility of including MCP in the selection schemes of the Italian Holstein. The MCP were predicted in 1,055 individual milk samples collected in 16 herds (66 ± 24 cows per herd) located in Brescia province (northeastern Italy) by means of Fourier transform infrared (FTIR) spec-troscopy. The coefficient of determination of prediction models indicated moderate predictions for milk rennet coagulation time (RCT = 0.65) and curd firmness (a30 = 0.68), and poor predictions for curd-firming time (k20 = 0.49), whereas the range error ratio (8.9, 6.9, and 9.5 for RCT, k20, and a30, respectively) indicated good practical utility of the predictive models for all param-eters. Milk proteins were genotyped and casein haplo-types (αS1-, β-, αS2-, and κ-casein) were reconstructed. Data from 51 half-sib families (19.9 ± 16.4 daughters per sire) were analyzed by an animal model to estimate (1) the genetic parameters of predicted RCT, k20, and a30; (2) the breeding values for these predicted clotting variables; and (3) the effect of milk protein genotypes and casein haplotypes on predicted MCP (pMCP). This is the first study to estimate both genetic param-eters and breeding values of pMCP, together with the effects of milk protein genotypes and casein haplotypes, that also considered k20, probably the most important parameter for the dairy industry (because it indicates the time for the beginning of curd-cutting). Heritability
of predicted RCT (0.26) and k20 (0.31) were close to the average heritability described in literature, whereas the heritability of a30 was higher (0.52 vs. 0.27). The effects of milk proteins were statistically significant and similar to those obtained on measured MCP. In particular, haplotypes including uncommon variants showed positive (B-I-A-B) or negative (B-A1-A-E) effects. Based on these findings, FTIR spectroscopy-pMCP is proposed as a potential selection criterion for the Italian Holstein.
Key words: milk coagulation properties , Fourier transform infrared spectroscopy , prediction
INTRODUCTION
The Italian dairy market system is characterized by transformation of milk into cheese; 75% of milk is processed for cheese production. In the rest of Europe and in North America, about 50% of milk is used to produce cheese (International Dairy Federation, 2011). The European cheese market is growing, although at a declining rate, and an annual growth of 0.6% is expect-ed between 2011 and 2015. In the Unitexpect-ed States, per capita consumption of natural cheese increased by 0.16 kg in 2011, and the largest consumption increase was for Italian-type cheeses (Rabobank, 2011). Cheese mak-ing requires the coagulation of milk, a process based on a series of physicochemical changes at the level of the casein micelle, resulting in formation of a gel. The most useful strategy to test the cheese-making properties of milk is to analyze milk coagulation properties (MCP). The MCP of herd bulk milk are periodically analyzed and used to reward or penalize producers of Protected Designation of Origin (PDO) cheeses (Calamari et al., 2005; Bittante et al., 2011). The economic importance of improving MCP fully justifies the need to account for this trait in the selection process.
The most common approach to determine MCP is lactodynamography (reviewed by Bittante et al., 2012), where MCP are measured by mechanical equipment, such as the Formagraph (Foss Electric, Hillerød, Den-mark) or computerized renneting meter (CRM; Polo
Selection for milk coagulation properties predicted by Fourier transform
infrared spectroscopy in the Italian Holstein-Friesian breed
S. Chessa ,*1 O. Bulgari ,† R. Rizzi ,‡ L. Calamari ,§ P. Bani ,§ S. Biffani ,* and A. M. Caroli †
* Institute of Agricultural Biology and Biotechnology, National Research Council (CNR), via Einstein, 26900 Lodi, Italy † Dipartimento di Medicina Molecolare e Traslazionale, Università degli Studi di Brescia, 25121 Brescia, Italy ‡ Dipartimento di Scienze Veterinarie e Sanità Pubblica, Università degli Studi di Milano, 20133 Milano, Italy § Istituto di Zootecnica, Università Cattolica del Sacro Cuore, 29122 Piacenza, Italy
Received December 4, 2013. Accepted March 14, 2014.
Trade, Monselice, Italy), or with an optical instrument (Optigraph; Ysebaert, Frépillon, France). Formagraph analysis, the most frequently used method, consists of registering the behavior of small-loop pendula im-mersed in linearly oscillating cuvettes containing rennet-added milk maintained at a fixed temperature. Before gel formation, the pendula do not move, but as gel formation begins, the increase in viscosity causes synchronous motion of the pendula. The registration of such movements is translated into 2 outputs: a typical fork-shaped diagram (McMahon and Brown, 1982) and the measures of MCP parameters. The Optigraph, in-stead, uses a single near-infrared reflectance wavelength to monitor coagulation (Kübarsepp et al., 2005). This device estimates MCP by analyzing optical information acquired in real time and transforming it to simulate traditional parameters.
The 3 MCP parameters usually registered are (1) rennet coagulation time (RCT, min)—the interval from the addition of rennet to milk to the time at which the pendula start oscillating; (2) the time from RCT to a curd firmness of 20 mm (k20, min)—the interval
from the start of gel formation to the time at which the width between the 2 arms of the fork-shaped diagram becomes 20 mm; and (3) the curd firmness at 30 min after enzyme addition (a30, mm)—measured as the
dis-tance between the 2 arms of the fork-shaped diagram at that time. Different researchers (Kübarsepp et al., 2005; Pretto et al., 2011; Cipolat-Gotet et al., 2012; Cecchinato et al., 2013) have analyzed MCP using both mechanical and optical instruments, and found high correlations between the measures for RCT (0.81 phenotypic and 0.97 genetic) and a30 (0.73 phenotypic and 0.92 genetic; Cecchinato et al., 2013).
Optical technologies can also be used to predict MCP directly from milk without inducing coagula-tion. Mid-infrared reflectance spectroscopy (MIRS) was used to indirectly predict the MCP of milk using appropriate calibration algorithms (Dal Zotto et al., 2008) and a mathematical pretreatment of spectra (De Marchi et al., 2009). Cecchinato et al. (2009) found moderate phenotypic correlations between measured and predicted MCP (pMCP; 67 and 51% for RCT and a30, respectively) but high genetic correlations (93% for RCT and 77% for a30, respectively). Thus, because MCP measures can be predicted by analyzing the spectra obtained from current milk recording for milk, fat, and protein analyses without further mea-surements (Barbano and Lynch, 2006), MIRS could be routinely used to achieve genetic improvements in cheese-making properties of milk. Moreover, when better calibration and prediction models are obtained, spectra could easily be reanalyzed. For this reason, we carried out a pilot study to evaluate the possibility of
using MCP predicted by means of Fourier transform infrared (FTIR) spectroscopy as selection criteria for the Italian Holstein breed. Additionally, we evaluated the effects of β-lactoglobulin (LGB) A and B variants and of casein haplotypes on the clotting properties of milk.
MATERIALS AND METHODS Samples, Data Collection, and Genotyping
Milk coagulation properties were evaluated in 1,055 individual milk samples collected in 16 herds (66 ± 24 cows per herd) located in Brescia province (north-eastern Italy) from May 16 to June 15, 2012. Because milk tends to have better, but more variable, MCP at the beginning and the end of lactation (Cipolat-Gotet et al., 2012), only cows within 90 and 300 DIM were sampled to reduce the variability. Milk samples were immediately refrigerated at 4°C without preservative and transported to the Agrifood Laboratory of the University of Brescia (Brescia, Italy), where they were immediately subdivided into 2 aliquots: 0.02% sodium azide (NaN3) was added to one aliquot for milk pro-tein genotyping before freezing and the second aliquot was deep-frozen without preservative and sent to the Laboratory of the Istituto di Zootecnica of the Uni-versità Cattolica del Sacro Cuore (Piacenza, Italy) for prediction of MCP by FTIR spectroscopy. A subsample of 1,017 cows from 51 half-sib families (19.9 ± 16.4 cows per sire), including only families with at least 5 daughters per bulls, was then selected for the following analyses. Families included 36 sires with at least 10 daughters, of which 19 sires had at least 20 daughters.
Milk proteins were genotyped by isoelectric focusing as described by Rignanese et al. (2009); the β-CN I allele was distinguished from the A2 allele by bidirec-tional allele specific-PCR (Chessa et al., 2013).
Pedigree information together with data on cows and herds were supplied by the Italian Holstein-Friesian Cattle Breeders Association (ANAFI, Cremona, Italy) and the Italian Breeders Association (AIA, Roma, Italy).
Analysis of Milk Quality and MCP
Mid-infrared spectra (in the range 5,012–926 cm−1) from individual milk subsamples (2 replicates of each sample) were obtained using a MilkoScan FT 120 (Foss Electric, Hillerød, Denmark), and MCP (RCT, k20, and a30) were predicted by using internal calibration curves developed by the Istituto di Zootecnica of the Univer-sità Cattolica del Sacro Cuore (Piacenza). The predic-tion model was built using a calibrapredic-tion data set of 250
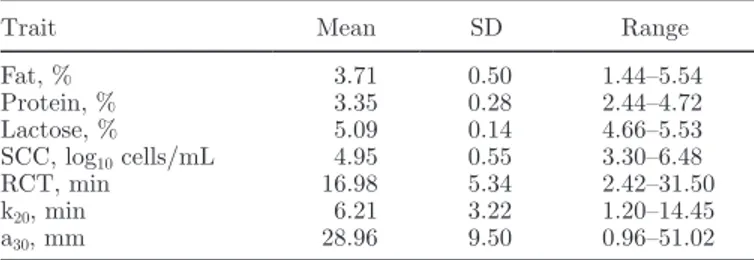
individual milk samples (without preservatives) from Italian Holstein cows, in all stages of lactation, raised in 18 herds located in the Grana Padano cheese district. The prediction model was successively validated on a validation data set built with 75 milk samples from cows in different stages of lactation raised in the same herds. The MCP on these samples were measured using the Formagraph (Foss Electric), and the results were used as reference values. For this analysis, 10 mL of milk was heated to 35°C, and 200 μL of rennet (Hansen standard 160 with 80% chymosin and 20% pepsin, Pacovis Am-rein AG, Bern, Switzerland) diluted to 1.6% (wt/wt) in distilled water was added to the milk at the start of the analysis, to obtain 0.051 IMCU (international milk clotting units)/mL. Furthermore, the contents of fat, protein, and lactose were measured on these milk samples by using the MilkoScan FT 120, and the SCC was registered (Fossomatic 180, Foss Electric). Table 1 contains the descriptive statistics of these milk samples.
In order not to use areas of the spectra that would introduce noise to the calibration, only the follow-ing areas were used to develop the prediction model: 2,971.7 to 2,432.4 cm−1, 2,272.4 to 1,716.8 cm−1, and 1,543.2 to 964.5 cm−1. The 2 areas 3,626.5 to 2,970.7 cm−1 and 1,716.8 to 1,543.2 cm−1, corresponding to the water absorption areas, were not used to calibrate milk components. The area 5,012.0 to 3,626.5 cm−1 was ex-cluded because it was considered to contain very little interesting information (Foss Electric, 2002).
For statistical analysis of RCT and a30, the total data set of 325 samples was used (12 samples did not coagulate within 30 min), whereas the analysis of k20 used only 282 samples with defined values. The infrared data were processed using the SAS statistical package (version 9.1, SAS Institute Inc., Cary, NC). The partial least squares (PLS) procedure of SAS was used to find and exclude outliers, in both predictors and responses. To check the outliers, the scores were inspected and the distance from each point to the PLS model in both the standardized predictors and standardized responses was analyzed (critical distance at the 0.05 probability
level). The points that were dramatically further from the model than the rest were considered outliers (Eriks-son et al., 2006). Outliers were not observed. The PLS was applied to the calibration data set, and the selec-tion of the optimal number of the extracted PLS factors was obtained using cross validation to prevent over-fitting. All prediction residuals were then combined to compute the root mean square error of cross-validation (RMSECV). A statistical model comparison (van der Voet, 1994) was applied to test whether the differences between the cross-validated residuals from models with a different number of extracted factors were significant. The chosen prediction model was based on the results obtained with the cross validation, and the number of factors chosen was the fewest with residuals that were not significantly larger than the residuals of model with minimum RMSECV.
The prediction model was successively applied to the spectra of 75 milk samples of the validation data set. The root mean square error of prediction (RMSEP) was calculated to identify the predictive performance of the PLS calibration model on these samples (validation data set). Range error ratios (RER) were calculated by dividing the range of RCT, k20, and a30 by their RMSEP.
Statistical Analysis
Genetic parameters and EBV of each animal in the data set for pMCP traits were obtained using 3 multi-trait animal models. Each model included the 3 clotting variables (RCT, k20, and a30) and milk yield, protein percentage, or fat percentage, respectively. Estimates were obtained using the program REMLF90 (version 1.76, Misztal et al., 2002). For all traits the following linear model was used:
yijklm = μ + HTDi + DIMj + Parityk
+ SCS + animl + εijklm, [1] where yijklm = dependent variable (RCT, k20, and a30,
milk yield, fat or protein percentage); μ = overall mean; HTDi = random effect of the ith herd × test day; DIMj = fixed effect of the jth DIM interval (1, …, 13; 12 in-tervals of 15 d from 90 to 270 DIM and the last interval of 30 d from 271 to 300 DIM); Parityk = fixed effect of the kth parity (first, second, ≥third); SCS = linear regression on SCS; animl = random additive genetic effect of an animal l; and εijkl = random residual effect.
Residuals from model [1] for the pMCP traits were used to test the hypotheses that casein haplotypes and β-LG genotypes have an additional effect on pMCP, which is not taken into account by only adjusting for
Table 1. Descriptive statistics of the 325 individual milk samples
selected for the development of the prediction model of rennet coagulation time (RCT), curd-firming time (k20), and curd firmness (a30)
Trait Mean SD Range
Fat, % 3.71 0.50 1.44–5.54 Protein, % 3.35 0.28 2.44–4.72 Lactose, % 5.09 0.14 4.66–5.53 SCC, log10 cells/mL 4.95 0.55 3.30–6.48 RCT, min 16.98 5.34 2.42–31.50 k20, min 6.21 3.22 1.20–14.45 a30, mm 28.96 9.50 0.96–51.02
fixed and random effects, correlated traits, and popula-tion structure (i.e., model [1]). A simple linear model was applied by using the general linear model procedure of SAS (SAS Institute, 2008). The models included only the effects of the 8 most diffused haplotypes expressed as 0, 1, or 2 (corresponding to as many copies of the haplotype were owned by each individual).
Casein haplotypes (in the order αS1-, β-, αS2-, and κ-CN) of the daughters, sires, and dams were recon-structed using the expectation maximization (EM) algorithm (Excoffier and Slatkin 1995; Hawley and Kidd 1995; Long et al., 1995) of the HAPLOTYPE procedures of SAS (SAS Institute, 2008) to obtain iter-atively the maximum likelihood estimates of haplotype frequencies.
All haplotypes with a frequency >1% were investi-gated to evaluate the effects of some rare haplotypes. The effects of LGB A and B variants (Caroli et al., 2009) were also tested using the same model.
RESULTS AND DISCUSSION Prediction of MCP
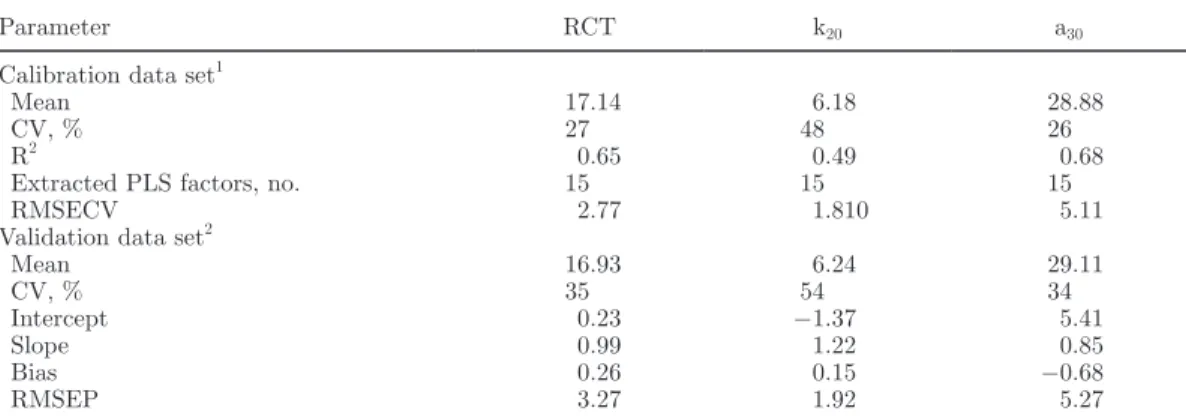
Prediction models were developed as described above. The RMSECV was 2.77, 1.81, and 5.11 for RCT, k20 and a30 respectively (Table 2). The coefficient of determination (R2) had values of 0.65, 0.49, and 0.68 for RCT, k20, and a30, respectively. According to Williams (2003), values of R2 between 0.50 and 0.65 indicate poor predictions, values between 0.66 and 0.81 indicate fairly accurate predictions, and values >0.82 reveal good predictions. Thus, the prediction model for k20 had poor prediction capability, whereas prediction
for RCT was fairly accurate, and the best prediction, also in the range of fairly accurate, was obtained for a30. The prediction model was successively validated as described above. The RMSEP was 3.27, 1.92, and 5.87, and the RMSEP to the range of reference data (RER) was 8.9, 6.9 and 9.5 for RCT, k20 and a30, respectively. Values of RER <3 indicate that the predictive model has little practical utility, values between 3 and 10 indicate limited to good practical utility, and values >10 indicate good to high utility (Williams and Norris, 2001). Because the RER of RCT and a30 were not far from 10, our predictive models showed very good util-ity (Figure 1). In direct comparisons between predicted and measured traits, genetic correlations between the 2 approaches are always higher than the corresponding phenotypic correlations (Cecchinato et al., 2009, 2011; Rutten et al., 2011) and thus the FTIR spectroscopy predictions are very valuable in terms of efficiency for genetic purposes.
Descriptive Statistics
The descriptive statistics for pMCP, milk production, and quality traits are reported in Table 3. Milk yield and fat and protein percentages were representative of the breed: milk yield averaged 34.74 ± 8.22 kg/d, fat percentage 3.61 ± 0.69, and protein percentage 3.35 ± 0.30. Data were comparable to the values reported in the National Herdbook of the Italian Holstein, where the average effective annual production amounts to 9,320 kg of milk with a protein percentage of 3.48 and a fat percentage of 3.83 (ANAFI, 2012).
The MCP in the current study were predicted by means of FTIR spectroscopy using the calibration
Table 2. Summary of partial least squares (PLS) predictions results for rennet coagulation time (RCT),
curd-firming time (k20), and curd firmness (a30) using Fourier transform infrared (FTIR) spectroscopy
Parameter RCT k20 a30
Calibration data set1
Mean 17.14 6.18 28.88
CV, % 27 48 26
R2 0.65 0.49 0.68
Extracted PLS factors, no. 15 15 15
RMSECV 2.77 1.810 5.11
Validation data set2
Mean 16.93 6.24 29.11 CV, % 35 54 34 Intercept 0.23 −1.37 5.41 Slope 0.99 1.22 0.85 Bias 0.26 0.15 −0.68 RMSEP 3.27 1.92 5.27 1
Calibration data set = 250 samples used to develop a calibration equation to predict individual RCT, k20, and a30 using FTIR spectra. RMSECV = root mean square error of cross validation calculated with PLS using the calibration data set.
2Validation data set = 75 samples used to validate the calibration equation to predict individual RCT, k20, and a30 using FTIR spectra. Bias = predicted – observed; RMSEP = root mean square error of prediction calcu-lated on the validation data set to identify the predictive performance of the PLS calibration model.
curves described above. The average pMCP values were 17.82 ± 2.38 min for RCT, 6.30 ± 1.28 min for k20, and 29.12 ± 6.63 mm for a30. Compared with the optimal values reported by Bittante et al. (2012), RCT was higher and k20 and a30 were lower (13 min, 9 min, and 35 mm, respectively), but the a30 value agreed with those reported in other studies in Holsteins (reviewed in Bit-tante et al., 2012). However, RCT and a30 values were slightly less favorable than data reported by Cassandro et al. (2008) in Italian Holstein, perhaps because of the presence of late-coagulating milk samples in the current study, which were not included in previous studies. The current study included results from late-coagulating samples because FTIR spectroscopy allows prediction of MCP in such samples. Furthermore, in the current study, only cows within 90 and 300 DIM were sampled to reduce the variability due to the lactation effect. This might explain our less favorable pMCP values because MCP tend to be favorable at the beginning of lactation (Bertoni and Calamari, 2000; Cipolat-Gotet
et al., 2012). Literature data on k20 values are limited, because many samples (from 8.4 to 32.9%; Bittante et al., 2012) do not attain a curd firmness of at least 20 mm before the end of the analysis (usually 30 min). In Italian Holsteins, the mean value reported in literature for k20 is 9.2 ± 3.1 (Bittante et al., 2012). Recently, De Marchi et al. (2013) used MIRS to predict both coagulating and noncoagulating milk in 200 individual samples and 135 selected bulk milk samples to compare milk with very high and very low RCT values. The sampling included outliers (5% for RCT, 33% for a30, and 56% for k20). Thus, their obtained results (30.55 min for RCT, 9.61 min for k20, and 26.97 mm for a30, respectively) might not be statistically representative of the Italian Holstein-Friesian population.
Although most of the data reported in literature were obtained by direct measure of MCP, the predic-tion model in the current study allowed their good approximation, especially for a30 and RCT. In the Italian Holstein-Friesian breed, already characterized by worse MCP than the Italian Brown Swiss (average values were 14.9 ± 3.87 min for RCT and 41.7 ± 8.34 mm for a30; Cecchinato et al., 2009), selection seems to have not affected or to have slightly reduced milk cheese-making properties in the last years. The pMCP values are similar to those reported in previous studies, indicating that in the last years MCP were not affected by selection.
Variance Component, Heritability, and Correlations of Milk Traits and Predicted MCP
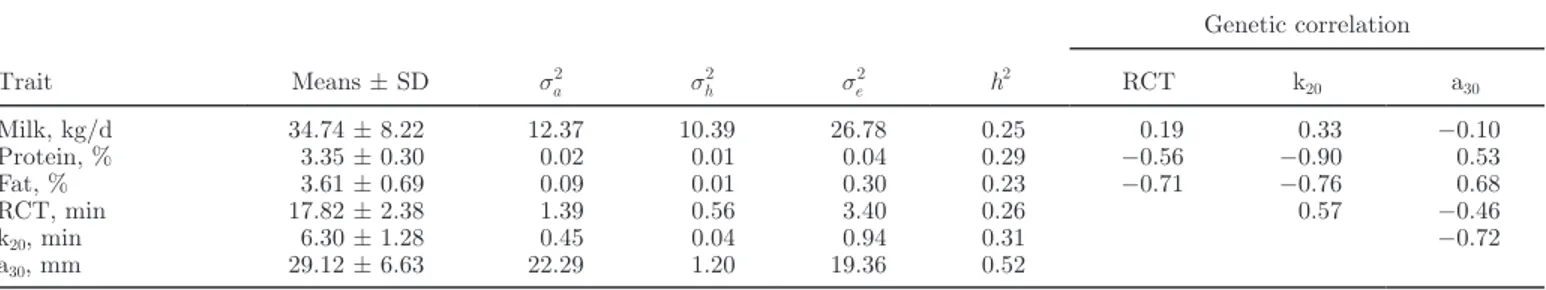
Estimates of variance components, heritability, and genetic correlation of milk traits and pMCP are re-ported in Table 3. Herd variance seemed to be effective only for milk yield and RCT, whereas its influence on both k20 and a30 was limited. Comparing the results obtained in the present work with average measured and predicted values reported by Cecchinato et al. (2009), we observed a smaller additive genetic variance
Figure 1. Scatter plot of measured (reference; y-axis) versus
pre-dicted (x-axis) rennet coagulation time (RCT) of the validation data set. Color version available in the online PDF.
Table 3. Descriptive statistics of milk traits and milk coagulation properties (n = 1,017), variances, heritability (h2), and genetic correlations
between the traits1
Trait Means ± SD σa2 σh2 σe2 h2 Genetic correlation RCT k20 a30 Milk, kg/d 34.74 ± 8.22 12.37 10.39 26.78 0.25 0.19 0.33 −0.10 Protein, % 3.35 ± 0.30 0.02 0.01 0.04 0.29 −0.56 −0.90 0.53 Fat, % 3.61 ± 0.69 0.09 0.01 0.30 0.23 −0.71 −0.76 0.68 RCT, min 17.82 ± 2.38 1.39 0.56 3.40 0.26 0.57 −0.46 k20, min 6.30 ± 1.28 0.45 0.04 0.94 0.31 −0.72 a30, mm 29.12 ± 6.63 22.29 1.20 19.36 0.52
1RCT = rennet coagulation time; k20 = curd-firming time; a30 = curd firmness;
σa2 = additive genetic variance; σh2 = herd variance; σe2 = resid-ual variance.
(1.39 vs. 4.98 for measured and 3.7 for predicted, min), herd variance (0.56 vs. 1.68 for measured and 1.48 for predicted, min), and residual variance (3.40 vs. 8.53 for measured and 4.6 for predicted, min) for predicted RCT and an increase in additive genetic variance (22.29 vs. 19.35 for measured and 17.15 for predicted, min), a consistent reduction in herd variance (1.20 vs. 9.38 for measured and 5.30 for predicted, min), and a consistent reduction in the residual variance (19.36 vs. 50.65 for measured and 19.99 for predicted, min) for predicted a30. Although we have no measured values with which to compare our results, we observed a trend similar to the predicted values of Cecchinato et al. (2009), except for a small increase in the additive genetic variance of our predicted a30 values. Thus, even if FTIR spectros-copy is not able to capture the complete genetic varia-tion of each trait and direct selecvaria-tion for MCP would be the most effective strategy, pMCP are rapidly and inexpensively estimated from milk samples already col-lected for milk recording without additional sampling and analysis, and therefore are much more suitable for phenotyping MCP than is lactodynamography.
The heritabilities of milk yield and protein and fat percentages obtained in the present study were slightly lower than those reported in the literature (0.25 vs. 0.31, 0.29 vs. 0.30, and 0.23 vs. 0.39, respectively) in Italian Holsteins (Pretto et al., 2012). Differences in es-timates might be due to the phenotypes used (test-day vs. lactation data) and to the different statistical model applied. As for the pMCP, heritabilities found in the present study were in the range of values reviewed by Bittante et al. (2012). In particular, RCT had a heri-tability of 0.26, similar to that previously described in the Italian Holstein-Friesian breed by Cassandro et al. (2008), whereas the heritability of a30 was much higher (0.52 vs. 0.15), but similar values were also reported by Cecchinato et al. (2009) for mid-infrared predicted measures of MCP. The studies on k20 heritability are scarce (only 4) and show very high variability (from 0.02 to 0.66; Bittante et al., 2012). Recently, analyzing 913 milk samples of Italian Brown Swiss cows, Cec-chinato et al. (2013) obtained a k20 value for 99.9% of the analyzed samples by prolonging the observation period to 45 min. The estimated heritability was 0.212 when measured with the Formagraph and 0.368 when measured with the Optigraph. Results from the present study represent the first attempt to estimate heritabil-ity of k20 using FTIR spectroscopy, and the data seem to support the practical use of curd-firming time, as reported by Bynum and Olson (1982).
The observed genetic correlations between milk yield and pMCP were 0.19 and −0.10 for RCT and a30, respectively. These results are different from pre-vious results in Italian Holstein-Friesian (−0.24 and
0.22 for RCT and a30, respectively, in Cassandro et al., 2008). However, as reported in the review of Bittante et al. (2012), such correlations are variable (−0.15 ± 0.18 for RCT and 0.04 ± 0.22 for a30) and sometimes contradictory. In any case, all these correlations are low and therefore selection for high milk yield should have a small effect on MCP. The genetic correlation of milk yield with k20 was a little higher (0.33), but no comparison with previous work is available. The observed correlations with protein and fat percentages were higher than those reported in the literature. In particular, the correlations of fat percentage with RCT and a30 were −0.71 and 0.68, respectively [the literature reports values of −0.05 and −0.06 (Cassandro et al., 2008) and of 0.14 and 0.13 (Bittante et al., 2012)], and the correlation of protein percentage with RCT and a30 were −0.56 and 0.53, respectively (the literature reports values of −0.08 or −0.06 and of 0.44 or 0.21). Several factors might explain the differences, such as sample size, sample selection criteria, and models and methods of estimations, but most of the results indicate that selection for milk quality would also favor MCP. In the present study, this seems especially true for k20, for which we found correlations of −0.90 and −0.76 with protein and fat percentages, respectively, but no other data are available in the literature for this parameter.
Considering correlations among pMCP, RCT and a30 were less correlated (−0.47) than has been described in literature (−0.92; Bittante et al., 2012), whereas higher correlations were found between k20 and RCT (0.57) and between k20 and a30 (−0.72). These results indicate that even if coagulation and curd firming are consecutive steps of the same process and a relationship exists between the 2 traits, different mechanisms are in-volved in the 2 coagulation phases. Vallas et al. (2010) analyzed 17,577 test-day records from 4,191 Estonian Holstein cows and found even lower genetic correlation between the 2 traits, although they measured MCP us-ing the Optigraph device and thus, their data are not fully comparable with other data from literature.
EBV for Predicted MCP
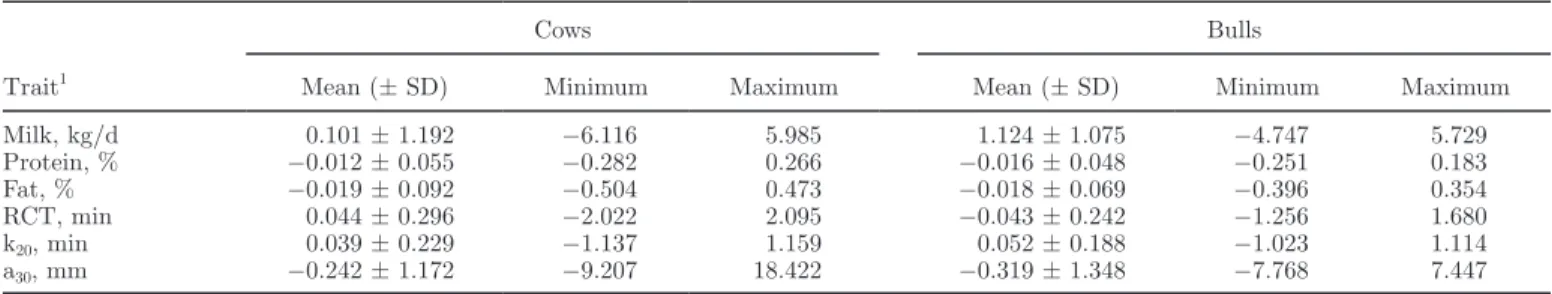
Statistics on EBV obtained with model [1] are reported in Table 4 for cows and bulls, respectively. Mean values for daily milk yield and protein and fat percentages were 0.101, −0.012, and −0.019 for cows (n = 5,184) and 1.124, −0.016, and −0.018 for bulls (n = 948), respectively. Those results clearly reflect the different selection intensities attained in the dam and sire paths for milk traits, as well as the unfavorable correlation between milk yield and milk contents. Mean EBV for pMCP were more similar between cows and bulls than were milk traits. This was expected because
no direct selection has ever been applied to those traits. However, considering the difference between minimum and maximum EBV of bulls, we found a difference of 2.9 min between the best and worst EBV for RCT, a difference of 2.1 min between the best and worst EBV for k20, and a difference of 15.2 mm between the high-est and lowhigh-est values of a30. These values indicate that significant variability does exist among MCP traits and that such variability might be exploited by using an ad hoc selection index. Recently, Pretto et al. (2012) analyzed the annual genetic response for milk traits and MCP (RCT and a30) in the Italian Holstein popu-lation under different selection indices and alternative breeding objectives, using genetic parameters for all traits similar to those obtained in the present study. The authors demonstrated that a selection index based on MIRS prediction as phenotypic records on MCP al-lowed the highest genetic response for both RCT and a30.
Milk Protein LGB Genotypes and Casein Haplotypes and Their Effects on Predicted MCP
A total of 14 of the 47 protein variants identified in cattle (Caroli et al., 2009) were found in the analyzed cows (2 αS1-CN, 5 β-CN, 2 αS2-CN, 3 κ-CN, and 2 β-LG variants) and 10 had a frequency >0.05 (Table 5). The 4 less-common variants found in the present study have previously been described in Italian Holsteins at low frequencies; namely, the C variant of αS1-CN, the A3 and I variants of β-CN, and the D variant of αS2-CN (Chessa et al., 2013). Of the 60 expected haplotypes from the possible combinations of casein variants, 16 were found in the analyzed population and only 6 had a frequency >0.05. When considering sire haplotypes, only 4 had a frequency >0.05 (B-A1-A-B and B-A2-A-B had a lower frequency in sires than in cows), and 1 haplotype, B-I-A-B, had a frequency of about 0.05 in sires (0.03 in cows). The predominant haplotype was B-A2-A-A, followed by B-A1-A-A, which together
ac-counted for more than the 70% of the haplotypes in the sample population.
It is well known that casein variants affect the cheese-making properties of milk (Caroli et al. 2009). In particular, for κ-CN, which is sensitive to chymosin action and plays a fundamental role in the stabilization of the micellar system, different variants with positive or negative effects have been described: the B variant is associated with a faster reaction to rennet, reducing RCT with respect to variant A; the G variant, identi-fied in the Pinzgauer breed (Erhardt et al., 1997), and the E variant, quite common in the Italian Holsteins, have negative effects on MCP (Caroli et al., 2009; Bit-tante et al., 2012).
Although κ-CN is crucial in renneting, interactions with other milk proteins, in particular, β-CN and β-LG were shown (Di Stasio and Mariani, 2000). In general, analyses of both single genes and composite β-κ-CN genotypes revealed that the best MCP were associated with the B variants of each of the 3 loci, although some inconsistencies were found (Caroli et al., 2009; Bittante et al., 2012; Jensen et al., 2012; Vallas et al., 2012). Because the casein genes are highly linked, haplotype effects may explain such inconsistencies. Therefore, we focused our attention on associations between casein haplotypes and pMCP in the present investigation.
The effects of β-LG and casein haplotype on random residuals of pMCP are shown in Figure 2. Positive and significant associations were found with all 3 pMCP for variant B of β-LG, as described in the cited literature (Di Stasio and Mariani, 2000; Jensen et al., 2012) for measured MCP. The most common haplotypes, B-A2 -A-A and B-A1-A-A, showed moderately unfavorable,
albeit not significant, effects on pMCP. Interesting as-sociations were found for the B-I-A-B haplotype with k20 (P = 0.05) and a30 (P = 0.06). Although the B-I-A-B haplotype had a low frequency in the analyzed indi-viduals, similar effects have been described previously (Bonfatti et al., 2010; Vallas et al., 2012). Bonfatti et al. (2010) analyzed the effects of β-κ-CN haplotypes on measured MCP in Simmental cows and found that the favorable effect of κ-CN B variant on a30 was higher when it was associated with the β-CN I variant; Vallas et al. (2012) analyzed the effect of β-κ-CN genotypes in
Table 4. Descriptive statistics of EBV for milk traits and milk coagulation properties
Trait1
Cows Bulls
Mean (± SD) Minimum Maximum Mean (± SD) Minimum Maximum
Milk, kg/d 0.101 ± 1.192 −6.116 5.985 1.124 ± 1.075 −4.747 5.729 Protein, % −0.012 ± 0.055 −0.282 0.266 −0.016 ± 0.048 −0.251 0.183 Fat, % −0.019 ± 0.092 −0.504 0.473 −0.018 ± 0.069 −0.396 0.354 RCT, min 0.044 ± 0.296 −2.022 2.095 −0.043 ± 0.242 −1.256 1.680 k20, min 0.039 ± 0.229 −1.137 1.159 0.052 ± 0.188 −1.023 1.114 a30, mm −0.242 ± 1.172 −9.207 18.422 −0.319 ± 1.348 −7.768 7.447
Estonian Holstein and observed that the deduced I-B haplotype had an increasing effect on a30 and protein percentage.
Another interesting result was the unfavorable effect of the B-A1-A-E haplotype on k20 (P = 0.05) and a30
(P = 0.02). Again, Vallas et al. (2012) described an unfavorable effect of the A1I-B E composite genotype for both RCT and a30, perhaps due to a stronger un-favorable effect of A1-E (+0.136 and −0.714 on RCT and a30, respectively, in our population) than the
favor-Table 5. Casein and β-LG allele and haplotype frequencies in the Italian Holstein-Friesian cows analyzed (n
= 1,017), and haplotype frequencies of the sires
Gene1 Allele Frequency (n = 1,017) Haplotype2 Frequency Cows Sires CSN1S1 B 0.996 B-A2-A-A 0.4887 0.4691 C 0.004 B-A1-A-A 0.2176 0.2840 CSN2 A1 0.359 B-A1-A-E 0.0678 0.0741 A2 0.544 B-A1-A-B 0.0643 0.0370 A3 0.002 B-B-A-B 0.0609 0.0617 B 0.062 B-A2-A-B 0.0506 0.0123 I 0.032 B-I-A-B 0.0324 0.0494 CSN1S2 A 0.989 B-A1-D-B 0.0093 0.0123 D 0.011 B-A2-A-E 0.0015 — CSN3 A 0.711 B-B-A-A 0.0015 — B 0.220 C-A2-A-A 0.0015 — E 0.070 C-A3-A-A 0.0015 — LGB A 0.533 B-A2-D-B 0.0010 — B 0.466 C-A2-A-B 0.0005 — C-A2-A-E 0.0005 — C-A3-D-B 0.0005 —
1CSN1S1 = αS1-casein; CSN2 = β-casein; CSN1S2 = αS2-casein; CSN3 = κ-casein; LGB = β-LG. 2
Haplotypes include, in order, αS1-, β-, αS2-, and κ-casein.
Figure 2. Effects (error bars = SE) of the β-LG B variant (LGB*B) and the 8 most frequent casein haplotypes on milk coagulation traits.
Haplotypes include, in order, αS1-, β-, αS2-, and κ-casein. RCT = rennet coagulation time (min); k20 = curd-firming time (min); a30 = curd firm-ness (mm) at 30 min after enzyme addition. ***P < 0.001; **P < 0.01; *P < 0.05; ^P < 0.1.
able effect of I-B (−0.053 and +0.806 on RCT and a30, respectively). The combination with B variants at both β- and κ-CN, considered the most favorable, was not confirmed, because the B-B-A-B haplotype did not show any significant association, and the effect on RCT was unfavorable. Last, the low frequency of B-A1-D-B haplotype did not allow a reliable estimation
of its effects, but because the haplotype appears to be unfavorable on both RCT and k20, further investigation is required.
Bonfatti et al. (2010) analyzed the effects of β-κ-CN haplotypes using 4 different statistical models. Even though most of the effects of the genetic variability exerted on MCP depended on the effects on protein composition more than on direct effects on MCP, the effects of some casein haplotypes were still significant when accounting for protein composition. Thus, be-cause specific haplotypes exert a direct effect on MCP, it is important to consider the effects of casein variants as haplotypes.
CONCLUSIONS
The present study was carried out to evaluate the possibility of MCP analyzed by FTIR spectroscopy as selection criteria to enhance the genetic milk coagula-tion properties of the Italian Holstein breed. Although the calibration curve and prediction models used to test MCP can be improved, the values obtained for RCT and a30 were similar to data from the literature, confirming the usefulness of the method to phenotype MCP rapidly and cheaply directly on milk samples already collected for milk recording through specific FTIR spectroscopy calibrations. An approximate estimation of k20 genetic parameters was also obtained. This parameter is impor-tant for the dairy industry because it represents the time at which curd-cutting should commence. Moreover, due to the high proportion of late-coagulating milk, k20 can be difficult to determine and late-coagulating milk is usually excluded from the estimation of the genetic pa-rameters, leading to a biased estimation of the genetic merit of individuals for their overall rennet coagulation properties. The moderate values of estimated heritabil-ity of RCT (0.26), k20 (0.31), and a30 (0.52), similar to or higher than that of milk fat and protein, and the relatively low correlation among pMCP indicate that different mechanisms are involved in the coagulation phases and that all 3 pMCP have to be considered for improving the cheese-making properties of milk. Data obtained in the present work confirm that the current selection index in Italian Holstein-Friesian is not sig-nificantly affecting MCP, but MCP could be improved. Finally, testing the effects of β-LG genotype and casein haplotypes on pMCP residuals showed that β-LG and
some haplotypes still have a significant effect, beside the effect of genetic variation on the amount and pro-portion of the different milk proteins. Our study showed that the effects of milk protein variants on pMCP are similar to those obtained on measured MCP; thus, the genotyping of animals would not be necessary. How-ever, because inexpensive and powerful techniques for simultaneous detection of the genetic variants are avail-able (and rarely genotyped variants such as I of β-CN, D of αS2-CN, and E of κ-CN variants can be analyzed), combining pMCP data and milk protein information might represent a cost-effective solution to improve the cheese-making properties of dairy cows with the simul-taneous assessment of milk protein genetic structure.
ACKNOWLEDGMENTS
This study was supported by Ministero delle Politiche Agricole, Alimentari e Forestali (MiPAAF, Rome, Italy; INNOVAGEN contract). We thank Gianpietro Trebeschi and the Provincial Breeders Association (APA) of Brescia (Italy) for their support in organizing and collecting milk samples and providing phenotype information, and Riccardo Negrini of the Italian Breed-ers Association (AIA, Rome, Italy), and the Italian Holstein-Friesian Cattle Breeders Association (ANAFI, Cremona, Italy) for providing pedigree information.
REFERENCES
ANAFI (National Association of Italian Friesian Breeeders). 2012. Medie Produzioni Latte/Grasso/Proteine Vacche Razza Frisona Controllate 2012. Accessed Mar. 13, 2014. www.anafi.it/MediePro-duzioni/MedieProduzioniNazionali.htm.
Barbano, D. M., and J. M. Lynch. 2006. Major advances in testing of dairy products: Milk component and dairy product attribute test-ing. J. Dairy Sci. 89:1189–1194.
Bertoni, G., and L. Calamari. 2000. Fattori ambientali ed alimentari che agiscono sull’acidità del latte e sulla caseificazione. Pages 19–42 in Atti del V Convivio Formaggi d’alpeggio: Il pascolo, l’animale, la razza, il prodotto. Anfosc-Onlus, Potenza, Italy.
Bittante, G., A. Cecchinato, N. Cologna, M. Penasa, F. Tiezzi, and M. De Marchi. 2011. Factors affecting the incidence of first-quality wheels of Trentingrana cheese. J. Dairy Sci. 94:3700–3707. Bittante, G., M. Penasa, and A. Cecchinato. 2012. Invited review:
Genetics and modeling of milk coagulation properties. J. Dairy Sci. 95:6843–6870.
Bonfatti, V., G. Di Martino, A. Cecchinato, L. Degano, and P. Carnier. 2010. Effects of β-κ-casein (CSN2–CSN3) haplotypes, β-lactoglobulin (BLG) genotypes, and detailed protein composi- tion on coagulation properties of individual milk of Simmental cows. J. Dairy Sci. 93:3809–3817.
Bynum, D. G., and N. F. Olson. 1982. Influence of curd firmness at cutting on Cheddar cheese yield and recovery of milk constituents. J. Dairy Sci. 65:2281–2290.
Calamari, L., P. Bani, M. G. Maianti, and G. Bertoni. 2005. New re-searches on the factors affecting milk acidification rate. Sci. Tecn. Latt. Cas. 56:47–55.
Caroli, A. M., S. Chessa, and G. J. Erhardt. 2009. Invited review: Milk protein polymorphism in cattle: Effect on animal breeding and hu-man nutrition. J. Dairy Sci. 92:5335–5352.
Cassandro, M., A. Comin, M. Ojala, R. Dal Zotto, M. De Marchi, L. Gallo, P. Carnier, and G. Bittante. 2008. Genetic parameters
of milk coagulation properties and their relationships with milk yield and quality traits in Italian Holstein cows. J. Dairy Sci. 91:371–376.
Cecchinato, A., C. Cipolat-Gotet, J. Casellas, M. Penasa, A. Rossoni, and G. Bittante. 2013. Genetic analysis of rennet coagulation time, curd-firming rate, and curd firmness assessed over an extended testing period using mechanical and near-infrared instruments. J. Dairy Sci. 96:50–62.
Cecchinato, A., M. De Marchi, L. Gallo, G. Bittante, and P. Carnier. 2009. Mid-infrared spectroscopy predictions as indicator traits in breeding programs for enhanced coagulation properties of milk. J. Dairy Sci. 92:5304–5313.
Cecchinato, A., M. De Marchi, M. Penasa, A. Albera, and G. Bit-tante. 2011. Near-infrared reflectance spectroscopy predictions as indicator traits in breeding programs for enhanced beef quality. J. Anim. Sci. 89:2687–2695.
Chessa, S., O. Bulgari, A. Rossoni, G. Ceriotti, and A. M. Caroli. 2013. Bovine β-casein: Detection of two single nucleotide polymor-phisms by bidirectional allele specific polymerase chain reaction (BAS-PCR) and monitoring of their variation. Open J. Anim. Sci. 3:36–41.
Cipolat-Gotet, C., A. Cecchinato, M. De Marchi, M. Penasa, and G. Bittante. 2012. Comparison between mechanical and near-infrared methods for assessing coagulation properties of bovine milk. J. Dairy Sci. 95:6806–6819.
Dal Zotto, R., M. De Marchi, A. Cecchinato, M. Penasa, M. Cas-sandro, P. Carnier, L. Gallo, and G. Bittante. 2008. Reproduc-ibility and repeatability of measures of milk coagulation properties and predictive ability of mid-infrared reflectance spectroscopy. J. Dairy Sci. 91:4103–4112.
De Marchi, M., C. C. Fagan, C. P. O’Donnell, A. Cecchinato, R. Dal Zotto, M. Cassandro, M. Penasa, and G. Bittante. 2009. Predic-tion of coagulaPredic-tion properties, titratable acidity, and pH of bovine milk using mid-infrared spectroscopy. J. Dairy Sci. 92:423–432. De Marchi, M., V. Toffanin, M. Cassandro, and M. Penasa. 2013.
Prediction of coagulating and noncoagulating milk samples using mid-infrared spectroscopy. J. Dairy Sci. 96:4707–4715.
Di Stasio, L., and P. Mariani. 2000. The role of protein polymorphism in the genetic improvement of milk production. Zoot. Nutr. Anim. 26:69–90.
Erhardt, G., E. M. Prinzenberg, J. Buchberger, H. Krick-Saleck, I. Krause, and M. Miller. 1997. Bovine κ-casein G detection, oc-currence, molecular genetic characterization, genotyping and co-agulation properties. Pages 328–329 in Proc. IDF Milk Protein Polymorphism Seminar II. International Dairy Federation, Brus-sels, Belgium.
Eriksson, L., E. Johansson, N. Kettaneh-Wold, J. Trygg, C. Witk-ström, and S. Wold. 2006. PLS. Pages 63–101 in Multi- and Mega-variate Data Analysis. Part I. Basic Principles and Applications. Umetrics AB, Stockholm, Sweden.
Excoffier, L., and M. Slatkin. 1995. Maximum-likelihood estimation of molecular haplotype frequencies in a diploid population. Mol. Biol. Evol. 12:921–927.
Foss Electric. 2002 MilkoScan FT120. Type 71200 Reference Manual. Issue 9 GB. Foss Electric, Hillerød, Denmark.
Hawley, M. E., and K. K. Kidd. 1995. HAPLO: A program using the EM algorithm to estimate the frequencies of multi-site haplotypes. J. Hered. 86:409–411.
International Dairy Federation. 2011. The world dairy situation. Bul-letin 451/2011. International Dairy Federation, Brussels, Belgium. Jensen, H. B., N. A. Poulsen, K. K. Andersen, M. Hammershøj, H. D.
Poulsen, and L. B. Larsen. 2012. Distinct composition of bovine milk from Jersey and Holstein-Friesian cows with good, poor or non-coagulation properties as reflected in protein genetic variants and isoforms. J. Dairy Sci. 95:6905–6917.
Kübarsepp, I., M. Henno, O. Kärt, and T. Tupasela. 2005. A compari-son of the methods for determination of the rennet coagulation properties of milk. Acta Agric. Scand. A Anim. Sci. 55:145–148. Long, J. C., R. C. Williams, and M. Urbanek. 1995. An E-M algorithm
and testing strategy for multiple-locus haplotypes. Am. J. Hum. Genet. 56:799–810.
McMahon, D. J., and R. J. Brown. 1982. Evaluation of Formagraph for comparing rennet solutions. J. Dairy Sci. 65:1639–1642. Misztal, I., S. Tsuruta, T. Strabel, B. Auvray, T. Druet, and D. H.
Lee. 2002. BLUPF90 and related programs (BGF90). Commun. No. 28–07 in Proc. 7th World Congr. Genet. Appl. Livest. Prod., Montpellier, France. Institut national de la recherche agronomique (INRA), Castanet-Tolosan, France.
Pretto, D., T. Kaart, M. Vallas, I. Jõudu, M. Henno, L. Ancilotto, M. Cassandro, and E. Pärna. 2011. Relationships between milk coagulation property traits analyzed with different methodologies. J. Dairy Sci. 94:4336–4346.
Pretto, D., N. López-Villalobos, M. Penasa, and M. Cassandro. 2012. Genetic response for milk production traits, somatic cell score, acidity and coagulation properties in Italian Holstein–Friesian population under current and alternative selection indices and breeding objectives. Livest. Sci. 159:59–66.
Rabobank. 2011. The European Cheese Market. Rabobank’s Global Dairy Outlook Publications. Rabobank, Utrecht, the Netherlands. Rignanese, D., S. Chessa, G. Ceriotti, B. Castiglioni, G. Pagnacco, and
A. Caroli. 2009. Approccio genomico e proteomico allo studio delle lattoproteine. Sci. Tecn. Latt. Cas. 60:169–177.
Rutten, M. J. M., H. Bovenhuis, J. M. L. Heck, and J. A. M. van Ar-endonk. 2011. Predicting bovine milk protein composition based on Fourier transform infrared spectra. J. Dairy Sci. 94:5683–5690. SAS Institute. 2008. SAS/STAT User’s Guide. Release 9.2. SAS
Insti-tute Inc., Cary, NC.
Vallas, M., H. Bovenhuis, T. Kaart, K. Parna, H. Kiiman, and E. Pärna. 2010. Genetic parameters for milk coagulation properties in Estonian Holstein cows. J. Dairy Sci. 93:3789–3796.
Vallas, M., T. Kaart, S. Värv, K. Pärna, I. Jõudu, H. Viinalass, and E. Pärna. 2012. Composite β-κ-casein genotypes and their effect on composition and coagulation of milk from Estonian Holstein cows. J. Dairy Sci. 95:6760–6769.
van der Voet, H. 1994. Comparing the predictive accuracy of models using a simple randomization test. Chemom. Intell. Lab. Syst. 25:313–323.
Williams, P., and K. Norris. 2001. Near-Infrared Technology in the Agricultural and Food Industries. American Association of Cereal Chemists, St. Paul, MN.
Williams, P. C. 2003. Near-infrared technology getting the best out of light. Page 109 in A Short Course in the Practical Implementation of Near Infrared Spectroscopy for the User. 1.1 ed. PDKProjects Inc., Nanaimo, BC, Canada.