EUI WORKING PAPERS
D e p a r t m e n t o f E c o n o m i c s
Acquisition of Information and Share Prices: An
Empirical Investigation of Cognitive Dissonance
ELENA ARGENTESI, HELMUT LÜTKEPOHL
and MASSIMO MOTTA
EUROPEAN UNIVERSITY INSTITUTE
D
EPARTMENT OFE
CONOMICSAcquisition of Information and Share Prices:
An Empirical Investigation of Cognitive Dissonance
E
LENAA
RGENTESI,
H
ELMUTL
ÜTKEPOHLand
This text may be downloaded for personal research purposes only. Any additional
reproduction for such purposes, whether in hard copy or electronically, requires the consent of
the author(s), editor(s). If cited or quoted, reference should be made to the full name of the
author(s), editor(s), the title, the working paper or other series, the year, and the publisher.
The author(s)/editor(s) should inform the Economics Department of the EUI if the paper is to
be published elsewhere, and should also assume responsibility for any consequent
obligation(s).
ISSN 1725-6704
© 2006 Elena Argentesi, Helmut Lütkepohl and Massimo Motta Printed in Italy
European University Institute Badia Fiesolana
I – 50016 San Domenico di Fiesole (FI) Italy
Acquisition of information and share prices: An
empirical investigation of cognitive dissonance
∗
Elena Argentesi
†Helmut Lütkepohl
‡Massimo Motta
§This draft: 1 September 2006
First draft: 23 March 2005
Abstract
This paper deals with the determinants of agents’ acquisition of infor-mation. Our econometric evidence shows that the general index of Italian share-prices and the series of Italy’s financial newspaper sales are coin-tegrated, and the former series Granger-causes the latter, thereby giving support to the cognitive dissonance hypothesis: (non-professional) agents tend to buy the newspaper when share prices are high and not to buy it when share prices are low. Instead, we do not find support for the hypothesis that the agents acquire information in order to trade in the stock-market: we find no relationship between quantities exchanged in the market and newspaper sales, nor between stock market volatility and newspaper sales.
∗We are grateful to Armando Carcaterra, Claudio Mazzoli (Brainpower) and Hammad
Nasar for their help with Italian stock-market data, to Sibilla Guzzetti (ADS) for help with the newspapers sales data, and to Andrea Beltratti, Giuseppe Bertola, Laura Bottazzi, Antonio Cabrales, Juan Carrillo, Stefano DellaVigna, Luigi Guiso, Elisabetta Iossa, Tullio Jappelli, Bruno Jullien, Gregor Langus, Annamaria Lusardi, Marco Pagano, Ludovic Renou, Riccardo Rovelli, Karl Schlag, and seminar participants at the EUI (Florence), Bologna, WZB (Berlin), and ESEM 2006 (Vienna) for useful discussions.
†University of Bologna. Address: Department of Economics, Piazza Scaravilli 2, I-40126
Bologna. E-mail: [email protected].
‡European University Institute, Florence. Address: EUI, Department of Economics, Via
della Piazzuola 43, I-50133 Firenze.
§European University Institute, Florence and Universitat Pompeu Fabra, Barcelona.
1
Introduction
In ‘standard’ economic theory, an agent will normally be better off by having
more information, if the latter was free.1 This is because utility depends on
out-comes, and information (if it has any relevance) should help an agent take better decisions, in turn improving outcomes. In recent years, however, a growing liter-ature has integrated psychology into economics, suggesting various reasons why agents might want not to acquire available information. Different ways to model this phenomenon have been proposed, including strategic behavior by agents, as well as the incorporation of beliefs in the utility function of individuals (see below for references).
To investigate empirically whether information acquisition is driven by psy-chological considerations, we look at the relationship between non-professional investors’ acquisition of information about financial markets - in the particular form of their purchase of Italy’s main financial newspaper, Il Sole 24Ore - and data on the evolution of the Italian stock exchange market.
Our hypothesis is that this relationship is consistent with the theory of cog-nitive dissonance (Festinger, 1957), very influential in social psychology, and supported by a number of anecdotal and experimental findings, in very different
domains and contexts.2 This theory postulates that two cognitions (or elements
of knowledge) are dissonant if the opposite of one cognition follows from the other. Dissonance makes an agent uncomfortable, and in order to reduce it the agent may either avoid any information likely to create dissonance or process the available information so as to reduce it. In our context, an agent who learns that the price of the shares she holds decreases will experience dissonance: the cognition that a share is ‘doing badly’ is dissonant with the cognition that she holds that share in her portfolio. In order to reduce dissonance the agent can
1The idea that in single-person decision problems agents prefer more information to less
was formalized by Blackwell (1951, 1953). This may not be the case in a multiple-agent setting (see Hirshleifer, 1971). In game theory, there are many situations in which players are worse off with more information (see also Osborne, 2004 p. 283 for examples).
2Two economics papers which report evidence on cognitive dissonance and the related
keep her behavior unchanged (i.e., continue to hold the share) while eliminating
the dissonant knowledge by ignoring information about the share price.3
There-fore, at an aggregate level this theory suggests that agents acquire information when the share-price index increases (that is, they buy the financial newspaper when they expect to see that the particular shares they hold are doing well), but prefer to ignore information when the share-price index decreases (that is, they do not buy the newspaper when they expect to learn from it that their shares are not doing well). We assume that expectations are correct on average, as the agent is exposed to some rumour about the general price level, but it is only after buying a newspaper that she will have precise information on her
shares (see also Karlsson et al., 2004 for a similar justification).4
By using cointegration techniques, we find that our data (we have monthly observations from 1978 to 2003) lend support to the cognitive dissonance hy-pothesis. The share-price series and the series of the financial newspaper sales are cointegrated (i.e., they move together), and the former causes (in the sense
of Granger, 1969) the latter.5
We also analyse whether more “standard” hypotheses about information acquisition are consistent with the data. For instance, agents may buy
newspa-3Another way in which dissonance may be reduced if negative news on the share-price index
appear, could be to sell her shares. However, this remedy to dissonance is certainly more costly (selling shares would entail a transaction cost, plus the agent should take another decision on how to invest the money realized from the sale) than simply ignoring information (note also that information here is costly: not buying the newspaper entails a saving). Furthermore, this behaviour would also contrast with prospect theory (itself supported by some empirical evidence): people tend to hold on their shares when they are doing badly (with respect to some benchmark). This behaviour, known in the finance literature as the “disposition effect”, is a well documented empirical regularity (see Odean, 1998, and the subsequent literature).
4Another way to formalise this idea is that, if share prices are correlated over time (as it
is argued by the financial literature on ‘mean reversion’, see for instance Fama and French, 1988), then the agent may buy the newspaper for one or more days, but after having observed a drop in the asset prices would not buy it any longer for some time after, since she expects it would still report low prices.
5We posit here (and find) a casual link from asset prices to newspaper sales. Dyck and
Zingales (2003) analyze a somewhat opposite causal link, by asking whether media coverage affect asset prices. However, what could affect stock-exchange performance are particular news about companies and sectors (for instance, expectation and announcements of earnings, news about demand and cost evolution). It is difficult to find a reason why the number of copies sold of a financial newspaper should affect positively the stockmarket prices. There may be of course events that both increase sales of the newspaper(s) and affect the stock-exchange prices, but one can reasonably expect that some of these events will negatively affect prices, while others will positively affect them.
pers to acquire information about the stock market, in order to improve their trading in the market, or reoptimise their portfolio (the newspaper may report detailed information about share prices, useful to better calculate own portfolio allocation). According to this view, one should expect to find that the financial
newspaper sales increase with the volumes traded in the market.6 ,7
Another prediction of the rational model is that the proportion of informed individuals increases with price noise (see for example Grossman and Stiglitz, 1980). This is due to the fact that the higher the level of noise, the less infor-mative the price system is, and therefore the more valuable information is to traders.
However, we find that the volumes traded in the stock exchange are not cointegrated with the financial newspaper sales, nor is there any evidence of a causal relation between stock market volatility and newspaper sales. Therefore our analysis does not lend support to these two particular “rational” explana-tions of information acquisition in financial markets.
Our paper is related to the recent and fertile literature on economics and
psy-chology.8 More particularly, a number of distinct models have been developed
which are able to explain biases in the acquisition of information.9
Among the more recent contributions,10 Rabin and Schrag (1999) explain
6The fact that more infomation is collected by investors does not necessarily imply that
more trade will follow (for instance, because information may just suggest that it is optimal not to trade). However, under a neoclassical hypothesis one should presume that if the volume of trade in the market increases, investors should have previously collected all the available information.
7The idea that more informed individuals trade more is an implication of rational models
on the determinants of investment in financial information. For example, in Peress (2004)’s model, information is more valuable to agents with a riskier portfolio (who are also wealthier investors). These agents therefore acquire more information, which increases the precision of their signal. In turn, a higher precision induces more informed agents to hold more stocks. Guiso and Jappelli (2005) propose an alternative model which yields the same prediction as the rational model, i.e. more informed agents trade more. However, in their model, the driving force is a behavioral motivation: agents are overconfident about the quality of the information, and therefore trade more in response to the information collected.
8See for instance Rabin (1998, 2002), Brocas and Carrillo (2003, 2004), and Camerer,
Loewenstein and Rabin (2004).
9It is not surprising that the same phenomenon is explained by distinct approaches, since
the theory of cognitive dissonance has given rise to a large variety of interpretations and ap-plications. See Harmon-Jones and Mills (1999) for a review of the social psychology literature.
1 0See Akerlof and Dickens (1982) for the first formalization of cognitive dissonance within
the existence of distortions in agents’ information through cognitive mistakes, and Carrillo and Mariotti (2000) explain ‘anomalous’ attitudes to information through strategic decisions of agents, who choose to be ignorant in order to
discipline their future behavior.11
A third approach explains cognitive dissonance by assuming that the agent’s beliefs enter directly her expected-utility function. This approach has been pio-neered by Akerlof and Dickens (1982) and recent contributions include Köszegi
(2000), Eliaz and Spiegler (2003), Yariv (2002).12 In this approach, information
can be used by agents to improve their decisions, but it can also affect their beliefs. An agent who maximizes a standard expected-utility function would not refuse to have free information because this would allow her to take ‘better’ decisions, but an agent whose beliefs enter her expected-utility function may decide to ignore information (or to re-interpret it) so as to preserve her beliefs. ‘Anomalous’ behavior with respect to information follows from the type of be-liefs that the agent has. For instance, if the agent has a preference for consistent beliefs, her utility increases when her beliefs are confirmed, and decreases when they are invalidated: the agent may want to actively acquire information of the former type, and to ignore (or manipulate) information which leads to the lat-ter situation. Or, if the agent’s utility increases with the belief the agent holds about herself, the agent may want to ignore any information which would lead her to revise downwards the judgment of her abilities.
Although we do not venture into a theoretical model of our findings, we speculate that the third approach might naturally lead to agents’ behavior con-sistent with our empirical findings. Suppose that an agent’s expected utility includes not only the performance of the assets she holds, but also her beliefs on her abilities as an investor. Then, our agent should be eager to acquire positive news about the performance of her assets and would instead prefer not to see the negative news. In other words, she would buy the financial newspaper in times of high share prices and not buy it in times of low share prices.
1 1See also Benabou and Tirole (2002).
1 2In all of these papers, beliefs enter directly the utility function of the agent, but in some
In this stream of the literature, Karlsson et al. (2004) present a model of belief manipulation. When facing a changing environment, agents choose between two psychological states: they can be either attentive and actively
seek information, or inattentive and avoid information.13 The authors find that
for some parameter values their model gives rise to what they term ‘ostrich effect’ (and we call cognitive dissonance): in ‘bad times’, individuals choose to be inattentive (and put their heads in the sand like ostriches), while in ‘good times’ they choose to be attentive.
What makes their paper similar to ours is that they also investigate this question empirically by looking at share prices data, and find evidence that investors tend to check the value of their portfolio (i.e., to login their online accounts) more frequently when stock exchange prices increase than when they decrease.
There are two main differences between Karlsson et al. (2004) and the present paper. Firstly, we do not limit ourselves to investigating whether the data support the ‘cognitive dissonance’ (or ‘ostrich behavior’) hypothesis, but we also investigate competing hypotheses, according to which information is acquired in order to improve decision-making. Secondly, we make use of dif-ferent econometric methods. They have daily data for a relatively short period of time, and they limit themselves to simply regress the aggregate number of daily logins on the relevant share price indices; instead, we have less disaggre-gated (monthly sales) but much longer (26 years) series of data, and we use more sophisticated econometric techniques which also allow us to investigate the (Granger-)causality link between the variables at issue.
The remainder of the paper is as follows. Section 2 describes the data; section 3 presents our econometric methodology and results, and carries out a series of robustness checks; section 4 concludes.
1 3By actively seeking or not information, individuals also choose how intensely they
experi-ence changes, which in turn affect their benchmark for future utility: deviations of outcomes from a pre-specified benchmark is an important element of their model, which incorporates the main insight from prospect theory.
2
Discussion of the data
We use average monthly values from 1978 to 2003 for the Datastream price index of the Italian stock market. This index is built by taking the first 90% of all the companies quoted on the Italian stock exchange taken in decreasing order of capitalization, disregarding in this way the small companies. The trading volumes corresponding to the Datastream stock price index are only available from 1986 to date (we use total monthly volumes).
As to the sources of information on the financial market, we use data on the
sales of Il Sole 24Ore, which is by far the largest financial (daily) newspaper.14
The Italian market for financial newspapers is essentially composed of three
ti-tles: Il Sole 24Ore, Italia Oggi, and MF.15 However, Italia Oggi and MF have
a much lower circulation with respect to Il Sole 24Ore, which has historically always been the Italian financial newspaper and accounts for over 90% of this
market.16 Therefore we only consider the sales of Il Sole 24Ore for the purpose
of our analysis. In particular, consistently with the stock market data, we use
monthly average sales from 1978 to 2003.17 Note that we use sales instead of
to-tal circulation because the latter includes also subscriptions. We do not want to consider subscriptions to avoid capturing the behavior of professional investors, who typically get access to Il Sole 24Ore through annual subscriptions. (In Italy, subscriptions account for a very small part of newspapers sales anyway.)
1 4The source of these data is the ADS (Accertamenti Diffusione Stampa) dataset, which is
publicly available (on paper) since 1976. ADS collects and certifies the publishers’ declarations on the number of copies sold and printed and on the number of subscriptions.
1 5There are also two minor publications whose circulation is negligible (see figures quoted
in two decisions of the Italian competition agency, Provv. n. 3336 Class Editori / Il Sole 24 Ore (19/10/1995) and Provv. n. 4822 Italia Oggi Editori / Il Sole 24 Ore (27/3/1997)).
1 6Italia Oggi and MF were founded in 1986 and 1989 respectively, so they were not present
on the market in the first part of our sample period. Since MF is not present on the ADS dataset (because they chose not to report their data to this agency), the information available on this publication amounts to the figures provided by the Italian antitrust competition agency in two decisions (Provv. n. 3336 Class Editori / Il Sole 24Ore (19/10/1995) and Provv. n. 4822 Italia Oggi Editori / Il Sole 24Ore (27/3/1997)), according to which MF had a share of 2-3% in 1993 and in 1995. As to Italia Oggi, its market share was on average 6-7% over the whole period. Therefore Il Sole 24Ore had a market share of around 90% or higher in the period under consideration.
1 7Daily observations are not available in our dataset, and in any case they would probably
not be suitable for the purpose of our econometric analysis, since they would add much more noise to our series.
It could reasonably be argued that a financial newspaper is not the only way to acquire information on the stock market. Other financial publications, national newspapers, and internet services could to some extent be substitute channels of information acquisition with respect to Il Sole 24Ore. However, there are good reasons to think that these alternative information sources are not crucial for the purposes of our analysis. First of all, national newspapers of general information do not seem to be close substitutes for Il Sole 24Ore, because
of their lower coverage and level of in-depth analyses on financial information.18
With the advent of internet, online news have become an alternative chan-nel with respect to written publications. However, since our data go back to 1978, internet was not even existing or widespread for most of the period under consideration. The development of internet access is a relatively recent phe-nomenon in Italy, and internet usage was fairly limited even until five years ago.19 ,20 In the next Section, we also perform the econometric analysis on a
reduced sample where we have deleted the last three years of observations, in order to eliminate the period where internet started to be an alternative source of financial information.
Another source of information on financial markets is provided by private agencies (e.g. Reuters or Bloomberg) which charge a subscription fee for their service. Therefore they are generally targeted to professional investors who need to have constant and detailed information about instantaneous variations in the stock prices. The target readership of a financial newspaper like Il Sole 24Ore is instead mainly composed of individual investors who want to find more detailed information about the financial assets they hold, obtain relevant news, and read
1 8The view that the market for daily financial newspapers can be defined as a separate
market is taken also by the Italian competition agency in the two above-mentioned decisions.
1 9The share of internet users over the total population was around 1% in 1997, and started
to increase sharply only after the year 2000, when it reached 22% of the population (source: Computer Industry Almanac). However, high-speed connections are not widespread even nowadays, and prices for internet access still limit the frequency of usage.
2 0Furthermore, even if individual investors can find free information about the general
performance of the stock market in many websites, there are several reasons why printed media still provide a valuable service (see Dyck and Zingales, 2003). They include credibility of information as well as sound and in-depth analyses of the determinants and prospects of stock exchange performance.
experts’ analyses. Since individual, non-professional investors are more likely to exhibit a ‘cognitive dissonant’ behavior, we focus therefore on Il Sole 24Ore, which is probably the main source of information for this type of investors (and - as said above - we do not consider subscriptions, to focus on non-professional investors’ decisions).
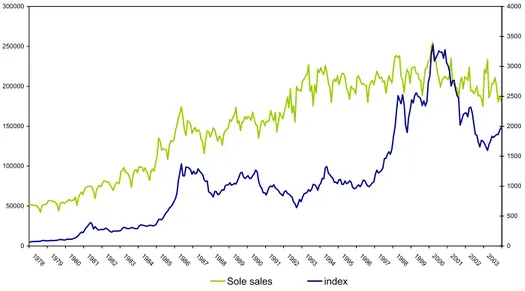
In order to get a first glance at the data, in Figure 1 below we plot the series of sales of Il Sole 24Ore against the series of the Datastream index. In order to interpret the increasing trend of the stock market index, it should be taken into account that the Italian stock exchange has grown considerably in the 1980s and even more in the 1990s. Mutual funds were introduced in 1983, but it is only from the second half of the 1980s that they started to become a widely held financial instrument. Household participation in equity markets increased from 26.43% in 1985 to 38.19% in 1995 and to 48.24% in 1998 (source: Pelizzon and Weber, 2004, based on information from a Bank of Italy SHIW survey).
A first look at the raw data series seems to confirm the results that we illustrate in the next section: this graph suggests that there is some kind of relation between the sales of Il Sole 24Ore and the stock market index. The investigation of the existence and the direction of this relationship is the object of the next section.
0 50000 100000 150000 200000 250000 300000 1978 1979 1980 1981 1982 1983 1984 1985 1986 1987 1988 1989 1990 1991 1992 1993 1994 1995 1996 1997 1998 1999 2000 2001 2002 2003 0 500 1000 1500 2000 2500 3000 3500 4000
Sole sales index
Figure 1: Sales of Il Sole 24Ore and stock market index (Note: the scale for Sole is on the left axis and the scale for the index is on the right axis).
3
Econometric Methodology and Results
3.1
Main findings
As explained earlier, the focus of interest is the relation between the Sole 24Ore sales and the stock price index. First, we perform a cointegration analysis. This is important because if two variables are cointegrated then they are trending together (are driven by the same stochastic trend) and hence there is a strong relation between them. Indeed, it can be shown that two cointegrated variables must be Granger-causally related at least in one direction. Then, we carry out Granger-causality tests based on VAR processes, in order to investigate the
direction of causality (Granger, 1969).21
Since our methods depend on the unit root or integration and cointegration properties of the variables, we first perform unit root tests. We find support
2 1Two time series variables x and y are Granger-causally related if one variable contains
information for improving the forecasts of the other variable. More precisely, x is Granger-causal for y if the forecasts of y can be improved by taking into account past and present information in x.
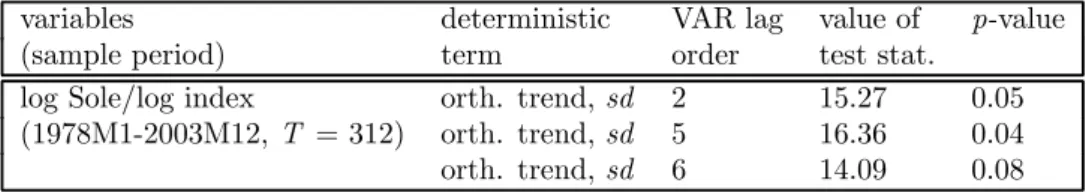
Table 1: Johansen Trace Tests for one Cointegration Relation
variables deterministic VAR lag value of p-value
(sample period) term order test stat.
log Sole/log index orth. trend, sd 2 15.27 0.05
(1978M1-2003M12, T = 312) orth. trend, sd 5 16.36 0.04
orth. trend, sd 6 14.09 0.08
Note: sd - seasonal dummies.
for classifying both variables as integrated of order one (I(1)), suggesting that they have a stochastic trend (see Appendix for a discussion of the unit root properties of the variables).
Cointegration is explored with Johansen’s likelihood ratio trace tests (Jo-hansen, 1995). These tests check the number of cointegration relations in a VAR framework and use the full information in all the time series involved. Since only two I(1) variables are considered, the only null hypothesis of interest is no cointegration relation between them. If that hypothesis is rejected, we
conclude that there is a cointegration relation.22
The results are given in Table 1 and they suggest a cointegration relation between (log) Sole 24Ore sales (“log Sole”) and the (log) stock market price index (“log index”). We are using different lag orders in the tests because the test results are known to be sensitive to the number of lags included in
the underlying VAR model.23 For all three lag orders reported in Table 1, a
cointegration rank of zero and, hence, the lack of cointegration can be rejected at least at the 10% level for the log Sole/log index system. Therefore there is evidence of a cointegration relation between the Sole sales and the stock market index, which is consistent with the “cognitive dissonance” hypothesis.
Since cointegration is a sufficient but not a necessary condition for Granger-causality, we next investigate the direction of causality between the variables
using Wald tests for Granger-causality.24 Test results based on VAR models with
2 2The tests are based on a model where no deterministic linear trend is allowed in the
cointegration relation, that is, the linear trend (if it exists) is orthogonal to the cointegration relation. Notice that the variables may still have a linear trend individually.
2 3Our choice of the lag orders is based on the three standard model selection criteria AIC,
HQ and SC (e.g., Lütkepohl, 2005, Section 4.3).
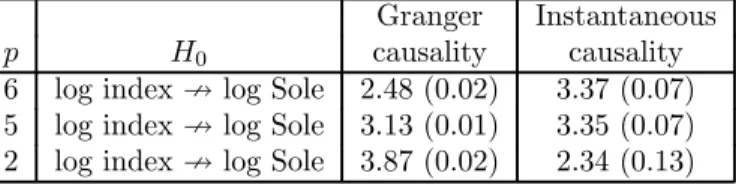
Table 2: Causality Tests Based on VAR Models in Levels with p Lags, Sample Period as in Table 1
Granger Instantaneous
p H0 causality causality
6 log index 9 log Sole 2.48 (0.02) 3.37 (0.07)
5 log index 9 log Sole 3.13 (0.01) 3.35 (0.07)
2 log index 9 log Sole 3.87 (0.02) 2.34 (0.13)
Note: p-values in parentheses.
different lag orders and an intercept term as well as seasonal dummy variables
as deterministic terms are presented in Table 2.25 ,26 These test results present
a strong case in favor of a Granger-causal relation from the log stock market index to the log Sole sales. More precisely, the null hypothesis of no Granger-causality from log index to log Sole (log index 6→ log Sole) is clearly rejected at common significance levels. We have also checked that the existence of the inverse causality relationship is not confirmed by the data (see Appendix).
In Table 2 we also present results of tests for what is usually called instan-taneous causality in the literature, and may be viewed as a measure for the in-stantaneous relation between the two variables when all intertemporal relations have been accounted for. The table shows that there is a (weak) instantaneous relation between the variables. Thus, the results of the instantaneous causal-ity tests are consistent with the previous conclusion in favor of the cognitive dissonance hypothesis.
To check the robustness of our results, we have also deleted the data asso-ciated with the last three years of our sample and we have repeated the tests. By deleting the data after the year 2000 eliminates much of the long lasting downward movement in the stock market which some may regard as an unusual period. Moreover, the past few years also coincide with the advent of internet
are problematic in general (Toda and Phillips, 1993). In the present situation it can be shown, however, that they have their usual asymptotic χ2- or approximate F -distributions. The log
Sole/log index system is one with two I(1) variables and one cointegration relation for which the Wald statistic for Granger-causality has standard properties (see Toda and Phillips, 1993 and Lütkepohl and Reimers, 1992).
2 5The lag orders are again chosen by the three most common criteria in applied work (AIC,
HQ, SC).
2 6Here the F -version of the Wald test is applied which corrects at least partly for the
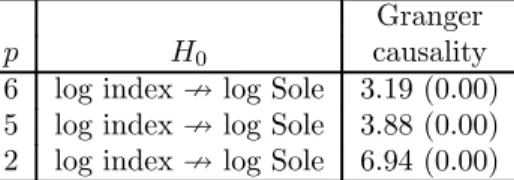
Table 3: Causality Tests Based on VAR Models in Levels with p Lags, Sample Terminated in 2000M12
Granger
p H0 causality
6 log index 9 log Sole 3.19 (0.00)
5 log index 9 log Sole 3.88 (0.00)
2 log index 9 log Sole 6.94 (0.00)
Note: p-values in parentheses.
websites as an alternative source of financial information, which may weaken the relationship between stock market variables and Sole 24Ore sales. The re-sults for the reduced sample are shown in Table 3. With respect to the rere-sults for the full sample, they show even stronger evidence of a causality relationship between the stock market index and Sole 24Ore sales.
We also performed an impulse response analysis, which confirms the positive relationship between the two series: when the stock market index goes down the Sole 24Ore sales will also go down, and vice versa.
3.2
Alternative explanations and robustness checks
An alternative motivation for searching information on financial markets follows a more “standard” explanation, according to which investors may buy financial newspapers in order to improve their trading in the market. According to this view, one should expect to find that the financial newspaper sales increase with the volumes traded in the market.
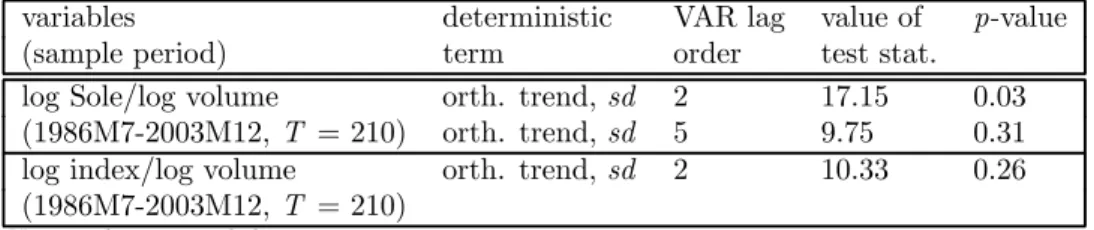
However, the results reported in Table 4 do not suggest the existence of cointegration between newspaper sales (“log Sole”) and traded volumes (“log volume”). The test results for these two variables depend strongly on the lag or-der chosen and the null hypothesis of no cointegration is not rejected at common significance levels for lag order 5.
Note also an important implication of a cointegration relation between the two pairs of variables. If both the stock price index and the volume were cointe-grated with the newspaper sales, then they must necessarily also be cointecointe-grated with each other (e.g., Lütkepohl, 2005, Section 6.3). Therefore cointegration
be-Table 4: Johansen Trace Tests for one Cointegration Relation
variables deterministic VAR lag value of p-value
(sample period) term order test stat.
log Sole/log volume orth. trend, sd 2 17.15 0.03
(1986M7-2003M12, T = 210) orth. trend, sd 5 9.75 0.31
log index/log volume orth. trend, sd 2 10.33 0.26
(1986M7-2003M12, T = 210)
Note: sd - seasonal dummies.
Table 5: Causality Tests Based on VAR Models in First Differences with p Lags
Granger causality Granger causality
p H0 Sample period as in Table 1 Sample period as in Table 3
1 ∆ log volume 9 ∆ log Sole 0.04 (0.85) 0.19 (0.66)
4 ∆ log volume 9 ∆ log Sole 1.84 (0.12) 0.45 (0.77)
Note: p-values in parentheses.
tween log index and log volume is also checked in Table 4 where it is seen that the rank zero hypothesis cannot be rejected. This implies that there exists no cointegration relation between Sole 24Ore sales and the stock market volume.
We next investigate the direction of Granger-causality between the stock market volume and Sole 24Ore sales. The system (log Sole/log volume) consists of two I(1) variables which are not cointegrated. Hence, a stationary VAR in first differences may be considered and used as the basis for Granger-causality
tests.27 The test results presented in Table 5 show that in both sample periods
there is no evidence for a Granger-causal relation from the stock market volume to Sole 24Ore sales, since the null hypothesis of no Granger-causality cannot
be rejected at usual significance levels.28 (The Appendix shows that there is no
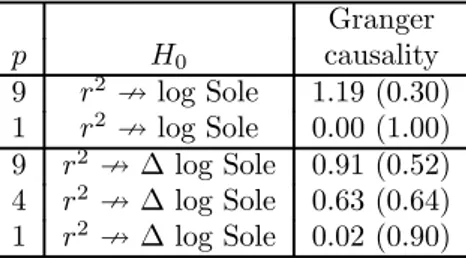
causality link going from Sole 24Ore sales to stock market volumes, either.) As we have said in the Introduction, some neoclassical models predict that the greater the magnitude of the noise in the stock market index, the higher the incentive to acquire information. However, we show that there is no evidence of a causal relation between stock market volatility and newspaper sales.
2 7In stationary VARs the usual Wald tests are known to have standard asymptotic
proper-ties, however (Lütkepohl, 2005, Section 3.6).
2 8Results of the instantaneous causality tests are in line with those of Granger-causality
Table 6: Causality Tests Based on VAR Models for Market Volatility and log Sole, Sample Period as in Table 1
Granger p H0 causality 9 r2 9 log Sole 1.19 (0.30) 1 r2 9 log Sole 0.00 (1.00) 9 r2 9 ∆ log Sole 0.91 (0.52) 4 r2 9 ∆ log Sole 0.63 (0.64) 1 r2 9 ∆ log Sole 0.02 (0.90)
Note: p-values in parentheses.
In order to explore this relationship, we have performed Granger-causality tests for a series of squared, mean-adjusted stock index returns and log Sole.
More precisely, the new variable is r2
t = (∆ log indext− ˆµ)2, where ˆµ =
T−1PT
t=1∆ log indext. This series may be viewed as a measure of market
volatility. The series does not have a unit root and one could argue that
check-ing Granger-causality between r2
t and the changes in log Sole is preferable to
using log Sole in levels. Therefore both types of tests are reported in Table 6. Clearly, there is no evidence of a causal relation from market volatility to the newspaper sales.
Therefore our analysis does not lend support to these two particular “ratio-nal” explanations of information acquisition in financial markets.
We have also performed a series of robustness checks which are reported in the Appendix. In particular, we find no evidence of the existence of reverse causality relations between the variables. We have also performed lag augmenta-tion tests à la Dolado and Lütkepohl (1996), whose results confirm our findings. Finally, we show results of causality tests for the levels VAR models for the log Sole/log index system with a deterministic linear trend term in addition to seasonal dummy variables. Again they confirm the results obtained with a constant and seasonal dummies only.
One could argue that our finding of a relationship between the stock mar-ket index and the financial newspaper sales may be due to an omitted factor rather than to the cognitive dissonance explanation. For example, one could
think that when the stock market goes up, people feel richer and increase their consumption, including the purchase of any type of newspaper. If this is the case, we should therefore find a relationship between the stock market index and the sales of non-financial newspapers. We therefore performed a cointe-gration analysis between the stock price index and the sales of Italian sports newspapers (which are probably the class of newspapers more distant from the financial ones), whose details are shown in the Appendix. Our analysis shows that there is no evidence of cointegration between these variables, nor evidence of a causal relation between them. This supports the idea that there is no spuri-ous correlation between the newspaper sales and the stock market index, which somewhat lends more support to the behavioral explanation.
Another variable which might be used to check whether the relation of inter-est is spurious is an index of economic activity. In the Appendix, we show results of a causality analysis between Italian industrial production (used as a proxy for economic activity) and Sole 24Ore sales. The two series are not cointegrated nor there is trace of a causal relation (neither Granger nor instantaneous) between them.
4
Conclusions
In this paper we have tested a prediction about (non-professional) agents’ atti-tude toward information acquisition according to which individuals may display a ‘cognitive dissonant’ behavior by refusing to acquire available information which might contrast with their maintained beliefs.
We analyze this issue by looking at the relationship between the stock market and the demand for financial information in Italy. If agents’ behavior is driven by psychological considerations, we should expect them to purchase the newspaper (and therefore to acquire information) when the stock market performs well (because they are more likely to find that their shares are doing well) and not to purchase it when the stock market is in a negative phase. Therefore according to this hypothesis we should find that an increase in the stock market price
increases the sales of the financial newspaper.
A cointegration analysis on the series of the Italian stock exchange price index and of the Italian main financial newspaper’s circulation shows that the two series are indeed cointegrated. The Granger-causality relation between the two variables has the expected direction: we find evidence of a causality relation that goes from the stock market index to the sales of the newspaper, which is consistent with the ‘cognitive dissonance’ hypothesis.
According to ‘standard’ economic theory, agents should be eager to search for (relevant) information in order to improve their decision-making. If agents behave according to standard economic theory, they should acquire information on the financial market for transactional reasons (for instance, with a view to reoptimise their portfolio allocation). However, we do not find any evidence of a cointegration relation between the volumes of transaction on the stock market and the demand for information (that we measure in terms of sales of the main Italian financial newspaper), nor evidence of a Granger-causal relation.
We also test another prediction of the rational model according to which the demand for financial information increases with stock price noise, but we do not find support for this hypothesis. Therefore our analysis does not lend support to these two ‘rational’ explanations of information acquisition in financial markets.
References
[1] Akerlof, G.A. and W.T. Dickens (1982), “The Economic Consequences of Cognitive Dissonance”, American Economic Review, 72(3): 307-319. [2] Benabou, R. and J. Tirole (2002), “Self-Confidence and Personal
Motiva-tion”, Quarterly Journal of Economics, 470: 871-915.
[3] Blackwell, D. (1951), “Comparison of Experiments”, in Proceedings of the Second Berkeley Symposium on Mathematical Statistics and Probability, University of California Press, Berkeley, CA, 93-102.
[4] Blackwell, D. (1953), “Equivalent Comparison of Experiments”, Annals of Mathematical Statistics, 24: 265-272.
[5] Brocas, I. and J.D. Carrillo (eds.) (2003), The Psychology of Economic Decisions, Vol.1, Oxford University Press.
[6] Brocas, I. and J.D. Carrillo (eds.) (2004), The Psychology of Economic Decisions, Vol.2, Oxford University Press.
[7] Camerer, C.F., G. Loewenstein, and M. Rabin (eds.) (2004), Advances in Behavioral Economics, Princeton University Press.
[8] Carrillo, J.D. and T. Mariotti (2000), “Strategic Ignorance as a Self-Disciplining Device”, Review of Economic Studies, 67: 529-544.
[9] Dolado, J. J. and H. Lütkepohl (1996), “Making Wald Tests Work for Cointegrated VAR Systems”, Econometric Reviews, 15: 369—386.
[10] Dyck, A. and L. Zingales (2003), “The Media and Asset Prices”, mimeo. [11] Eliaz, K. and R. Spiegler (2003), “Anticipatory Feelings and Choices of
Information Sources”, mimeo, NYU and Tel Aviv University.
[12] Fama, E.F. and K.R. French (1988), “Permanent and Temporary Compo-nents of Stock Prices”, Journal of Political Economy, 96: 246-273.
[13] Festinger, L. (1957), A theory of cognitive dissonance, Evanston, IL: Row, Peterson.
[14] Granger, C. W. J. (1969), “Investigating Causal Relations by Econometric Models and Cross-spectral Methods”, Econometrica, 37: 424—438.
[15] Grossman, S.J. and J.E Stiglitz (1980), “On the Impossibility of Informa-tionally Efficient Markets”, American Economic Review, 70(3): 393-408. [16] Guiso, L. and T. Jappelli (2005), “Rational or Behavioral Households?
[17] Harmon-Jones, E. and J. Mills (eds.) (1999), Cognitive Dissonance: Progress on a Pivotal Theory in Social Psychology, American Psychological Association.
[18] Hirshleifer, J. (1971), “The Private and Social Value of Information and the Reward to Inventive Activity”, American Economic Review, 61(4): 561-574.
[19] Johansen, S. (1995), Likelihood-based Inference in Cointegrated Vector Au-toregressive Models, Oxford University Press, Oxford.
[20] Karlsson, N., G. Loewenstein, and D. Seppi (2004). “The ‘Ostrich Effect’: Selective Exposure to Information About Investments”. Mimeo.
[21] Köszegi B. (2000), “Ego Utility and Information Acquisition”, mimeo, UC Berkeley.
[22] Lütkepohl, H. (2005), New Introduction to Multiple Time Series Analysis, Springer-Verlag, Berlin.
[23] Lütkepohl, H. and M. Krätzig (eds) (2004), Applied Time Series Econo-metrics, Cambridge University Press, Cambridge.
[24] Lütkepohl, H. and H.-E. Reimers (1992), “Granger-causality in Cointe-grated VAR Processes: The Case of the Term Structure”, Economics Let-ters, 40: 263—268.
[25] Odean, T. (1998), “Are Investors Reluctant to Realize their Losses?”, The Journal of Finance, 53: 1775-1798.
[26] Osborne, M.J. (2004), An Introduction to Game Theory, Oxford University Press, New York.
[27] Pelizzon, L. and G. Weber (2004), “Are Household Portfolio Efficient? An Analysis Conditional on Housing”, mimeo, University of Padua, previously published as CEPR Discussion Paper n. 3890, 2003.
[28] Peress, J. (2004), “Wealth, Information Acquisition, and Portfolio Choice”, Review of Financial Studies, 17(3): 879-914.
[29] Rabin, M. (1998), “Psychology and Economics”, Journal of Economic Lit-erature, 36: 11-46.
[30] Rabin, M. (2002), “A Perspective on Psychology and Economics”, European Economic Review, 46: 657-685.
[31] Rabin, M. and J.L. Schrag (1999), “First Impression Matters: A Model of Confirmatory Bias”, Quarterly Journal of Economics, 114: 37-82.
[32] Toda, H. Y. and P. C. B. Phillips (1993), “Vector autoregressions and causality”, Econometrica, 61: 1367—1393.
[33] Yariv, L. (2002), “I’ll See It When I Believe It: A Simple Model of Cognitive Consistency”, mimeo, UCLA.
Appendix
Unit root properties of the variables
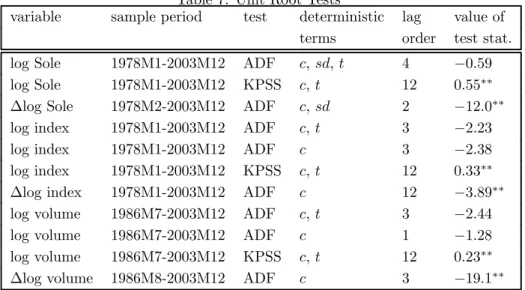
We have used augmented Dickey-Fuller (ADF) and KPSS tests (see Lütkepohl and Krätzig, 2004, Section 2.7) to formally investigate the unit root properties
of the variables. Some results are presented in Table 7 below.29 They suggest
that all three series may indeed be classified as I(1). ADF tests of the levels of all series cannot reject the null hypothesis of a unit root while KPSS tests of stationarity clearly reject. Furthermore, ADF tests of the first differences clearly reject a unit root and thereby confirm that higher order integration can be excluded.
Table 7: Unit Root Tests
variable sample period test deterministic lag value of
terms order test stat.
log Sole 1978M1-2003M12 ADF c, sd, t 4 −0.59
log Sole 1978M1-2003M12 KPSS c, t 12 0.55∗∗
∆log Sole 1978M2-2003M12 ADF c, sd 2 −12.0∗∗
log index 1978M1-2003M12 ADF c, t 3 −2.23
log index 1978M1-2003M12 ADF c 3 −2.38
log index 1978M1-2003M12 KPSS c, t 12 0.33∗∗
∆log index 1978M1-2003M12 ADF c 12 −3.89∗∗
log volume 1986M7-2003M12 ADF c, t 3 −2.44
log volume 1986M7-2003M12 ADF c 1 −1.28
log volume 1986M7-2003M12 KPSS c, t 12 0.23∗∗
∆log volume 1986M8-2003M12 ADF c 3 −19.1∗∗
Notes: c - constant, t - linear time trend, sd - seasonal dummies.
Asterisks∗ and∗∗indicate that the null hypothesis of a unit root can be rejected at the 5% and 1% levels, respectively.
Order selection for ADF test by HQ criterion with maximal lag 24.
2 9All computations were performed with the software JMulTi (Lütkepohl and Krätzig,
Table 8: Causality Tests Based on VAR Models in Levels or First Differences as Appropriate with p Lags, Sample Periods as in Table 1
Granger instantaneous
p H0 causality relation
6 log Sole 6→ log index 2.78 (0.01) 3.37 (0.07) 5 log Sole 6→ log index 1.53 (0.18) 3.35 (0.07) 2 log Sole 6→ log index 2.00 (0.14) 2.34 (0.13) 1 ∆log Sole 6→ ∆ log volume 0.50 (0.48) 1.00 (0.32) 4 ∆log Sole 6→ ∆ log volume 0.60 (0.66) 2.80 (0.09)
Note: p-values in parentheses.
Additional causality tests
We have also checked that the existence of the inverse causality relationships is not confirmed by the data. Table 8 shows that there is no evidence of a causality direction going from log Sole to log index (at least for lag orders p = 2 and 5) and from log Sole to log volumes.
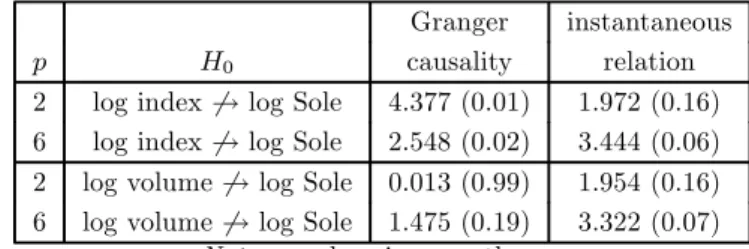
In order to check the robustness of our results, we have also used lag aug-mentation tests à la Dolado and Lütkepohl (1996) which are generally valid for integrated and cointegrated systems. The results for the full sample period are presented in Table 9 and they confirm our more refined findings. The advantage of these tests is, however, that they would also be asymptotically valid if the cointegration properties of the system were misspecified.
In Table 10 we also show results of causality tests for the levels VAR models for the log Sole/log index system which include a deterministic linear trend term in addition to seasonal dummy variables. Again they confirm our results obtained with a constant and seasonal dummies only. Given the way the time series look like, deterministic trend terms do not make much sense for models in first differences. Therefore we do not report such results.
Table 9: Lag Augmented Causality Tests, Sample Periods as in Table 1
Granger instantaneous p H0 causality relation 2 log index 6→ log Sole 4.377 (0.01) 1.972 (0.16) 6 log index 6→ log Sole 2.548 (0.02) 3.444 (0.06) 2 log volume 6→ log Sole 0.013 (0.99) 1.954 (0.16) 6 log volume 6→ log Sole 1.475 (0.19) 3.322 (0.07)
Note: p-values in parentheses.
Table 10: Causality Tests Based on VAR Models in Levels with Linear Trends and p Lags, Sample Period as in Table 1
Granger instantaneous p H0 causality relation 6 log index 6→ log Sole 2.41 (0.03) 3.44 (0.06) 5 log index 6→ log Sole 3.00 (0.01) 3.38 (0.07) 2 log index 6→ log Sole 3.86 (0.02) 2.34 (0.13)
Note: p-values in parentheses.
Causality analysis for sports newspaper sales and stock
market index
In analyzing the causal relation between the index and the sports newspaper sales we have used only data from 1987 to 2003 because there are data problems for the sports newspaper sales before 1987 (referred to as “Sports” and trans-formed in logs). We consider the aggregated sales of the three Italian sports newspapers which are available in our dataset (Corriere dello Sport, Gazzetta dello Sport, Tuttosport ).
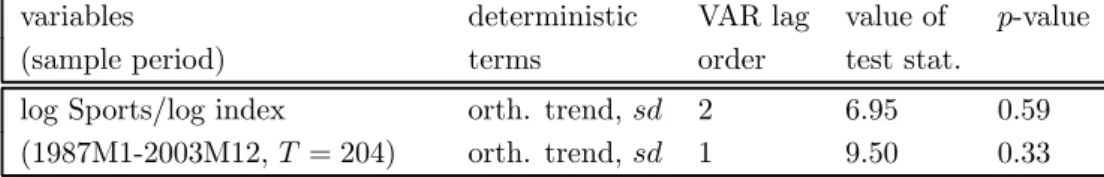
Unit root tests support a single nonseasonal unit root in the series which will therefore be treated as I(1). Thus it makes sense to consider cointegration be-tween log index and log Sports. The results of Johansen tests are given in Table 11. No cointegration is found, that is, the null hypothesis of no cointegration relation cannot be rejected.
Table 11: Johansen Trace Tests for one Cointegration Relation between log
Sports and log index (H0: no cointegration)
variables deterministic VAR lag value of p-value
(sample period) terms order test stat.
log Sports/log index orth. trend, sd 2 6.95 0.59
(1987M1-2003M12, T = 204) orth. trend, sd 1 9.50 0.33
Notes: sd - seasonal dummies.
for Granger-causality, we have also performed causality tests based on a VAR model for the first differences of the two series. The results are presented in Table 12. Clearly, there is no evidence for a causal relation in either direction.
These results support the idea that the relation between log index and log Sole is not just spurious.
Table 12: Causality Tests Based on a VAR(1) Model for log index and log Sports, Sample Period 1987M2-2003M12, T = 203
Granger
p H0 causality
1 ∆log index 6→ ∆ log Sports 0.27 (0.60) 1 ∆log Sports 6→ ∆ log index 0.26 (0.61)
Note: p-values in parentheses.
Causality analysis for economic activity and newspaper sales
Causality tests between Italian industrial production (“IP”) and Sole 24Ore sales are performed on a VAR(12) model with constant and seasonal dummies for the first differences of the logs. The two log series are not cointegrated. Table 13 shows that there is no trace of a causal relation (neither Granger nor instantaneous) in either direction between the two series.
Table 13: Causality Tests Based on VAR Models for Industrial Production and log Sole, Sample Period 1978M2-2003M12, T = 311
Granger Instantaneous
p H0 causality causality
12 ∆ log IP 9 ∆ log Sole 0.57 (0.86) 1.08 (0.30)
12 ∆ log Sole 9 ∆ log IP 0.82 (0.63) 1.08 (0.30)