SCUOLA DOTTORALE IN
GEOLOGIA DELL’AMBIENTE E DELLE RISORSE
(SDIGAR)
Ciclo XXVI
THE EVOLUTION OF TURRIALBA VOLCANO PLUMBING SYSTEM
(
COSTA RICA
)
Andrea Di Piazza
A.A. 2012/2013
Tutors: Dott.ssa Claudia Romano Prof. Franco Barberi
Coordinatore: Prof. Claudio Faccenna
“The future belongs to those who believe in the beauty of their dreams” Eleanor Roosvelt
Content
1. Introduction ………... 1 2. Turrialba Volcano ... 5 2.1. Geodynamical background ... 5 2.1.1. Regional setting ... 52.1.2. Local setting: the Turrialba volcanic system …... 9
2.2. Volcanological evolution of Turrialba Volcano ... 11
2.2.1. Chronicles of the 1864-1866 AD eruption ... 12
2.2.2. The unrest phase (1996-2013) ... 12
2.3. Field sampling ... 13
2.4. Whole rock geochemistry: results ... 16
2.4.1. Analytical methods ... 16
2.4.2. Nomenclature and classification ... 17
2.4.3. Petrography and mineral chemistry ... 18
2.4.4. Major and trace elements chemistry ... 20
2.4.5. Sr and Nd isotope geochemistry ... 26
2.5. Turrialba volcano in the geochemical framework of the volcanic front of Central America ... 27
2.5.1. Bulk rock geochemistry insights: trace elements variations along the arc …..….. 27
2.5.2. Isotope geochemistry evidences ... 30
2.5.3 The occurrence of andesites with primitive geochemical characteristics ... 33
3. Mantle source feeding the plumbing system of Turrialba volcano: insights from noble gas geochemistry ... 38
3.1. Noble gas geochemistry background ... 39
3.1.1 Helium isotopes ... 41
3.2. Sample preparation and analytical methods ... 43
3.3. Results: fluid inclusions composition ... 46
3.3.1. The effect of air contamination ... 49
3.4. Inferences on the local mantle source ... 51 3.5. Features of magma degassing at present day and inferences on the recent unrest phase
... 55
4. Geochemical study of the degassing system of Turrialba volcano ……… 59
4.1. The Turrialba fumarolic discharge ... 59
4.2. Previous studies ... 60
4.3. Methodology and sampling strategy ... 62
4.4. Results ... 64
4.4.1. The CO2 soil flux surveys ... 65
4.4.2. Soil gases concentration ... 68
4.4.3. Chemical composition of fumaroles ... 70
4.5. Discussion ... 72
4.6. Constraints on the Turrialba unrest phase ... 77
5. Textural analysis on two explosive eruptions of the last 2ka of Turrialba Volcano …... 83
5.1. Crystal and Vescle Size Distributions: brief background theory ... 83
5.1.1. Crystal Size Distribution ... 84
5.1.2. Vesicle Size Distribution ... 88
5.2. Methodology ... 93
5.3. 1.9 ka eruption of Turrialba Volcano ... 95
5.3.1. Field observations ... 95
5.3.2. Petrographic observations ... 98
5.3.3. Density and vesicularity ... 100
5.3.4. Vesicle textural observations ... 102
5.3.5. Vesicle Volume Distribution ... 103
5.3.6. Vesicle Number Density ... 104
5.3.7. Crystal Size Distribution ... 106
5.4. 1864-1866 eruption ... 108
5.4.1. Field observations ... 108
5.4.2. Petrographic observations ... 110
5.4.3. Density and vesicularity ... 111
5.4.4. Vesicle textural observations ... 112
5.4.5. Vesicle Volume Distribution ... 113
5.4.6. Vesicle Number Density ... 113
5.5. Discussion ... 117
5.5.1. The 1.9 ka andesitic eruption ... 117
5.5.2. The 1864-1866 basaltic eruption ... 124
5.6 Volcanological implications ... 126
6. The multiphase rheology of magmas from Turrialba 1.9 ka eruption ... 128
6.1. The rheology of magmatic suspensions ... 129
6.1.1. Crystal-bearing magma rheology ... 130
6.1.2. Bubble-bearing magma rheology ... 137
6.1.3. Three phase mixtures ... 139
6.2. Methods ... 140
6.2.1. Sample selection and preparation ... 140
6.2.2. Textural characterization ... 141
6.2.3. Density and porosity measurements ... 142
6.2.4. The Volcanology Deformation Rig (VDR) ... 145
6.3. Experimental Results ... 149
6.3.1. Variable Strain Rate (VSR) measurements ... 151
6.4. Discussion ... 155
6.4.1. Textural and structural observations ... 155
6.4.2. Fitting of experimental data ... 157
6.4.3. Combined effects of crystals and pores on the rheology of Turrialba 1.9ka andesites ... 159
6.5. Volcanological implications on the 1.9ka andesitic eruption ... 164
7. Conclusions ... 154
References ... 171
Acknowledgements ... 191
1
Turrialba volcano is situated on the southern tip of the 1000km-long volcanic chain that develops from Mexico to Costa Rica. It represents the second highest volcano after nearby Irazú and is upwind of the Central Valley of Costa Rica, which includes the city of San José (2 million inhabitants) and the metropolitan area around it. This volcano drew the attention of the Scientific Community after the 1996, when seismic swarms and the progressive enhancement of the gas emissions at crater fumaroles, seemed to be the precursors of a possible imminent eruption. This unrest phase, characterized by very high temperatures of gas emissions, strong degassing, microseismicity, and phreatic explosions, is still ongoing although till now no eruptions has occurred. An eruption of Turrialba could severely hamper the economy of Costa Rica, due to the geographical location of the volcano with respect to many important human activities (cities, industries, etc…).
The most recent eruption at Turrialba occurred between 1864 and 1866, and consisted of Strombolian to Vulcanian activity (Reagan et al., 2006), that produced ash-fall on the Central Valley up to the Pacific coast of Costa Rica. After this eruption, the volcano entered a quiescence period, characterized by low temperature fumarolic activity (Soto 1988; Tassi et al., 2004; Vaselli et al., 2010) that lasted ~150 years. Since 1996, an increase in seismicity and the progressive appearance of magmatic gas species (e.g. CO2, SO2 and H2S; Vaselli et al., 2010) in the fumaroles
was registered. On January 2010, the opening of a vent (65 x 20 m across) due to a phreatic explosion (OVSICORI-UNA, 2010, 2011) produced an ash and lithic fall-out to the southwest, that reached the cities of San José, Cartago and Tres Ríos. Other phreatic explosive events occurred in 2011, 2012 and more recently in May 2013 (OVSICORI-UNA, 2011, 2012, 2013). Nowadays, high temperature gases continue to escape from the phreatic vents opened in the last years and the possibility of a magmatic eruption still persists.
This unrest phase prompted an increasing number of investigations on the volcano, in particular geochemical (Tassi et al., 2004; Hilton et al., 2010; Vaselli et al., 2010; Campion et al., 2012) and geophysical studies (Martini et al., 2010; Eyre et al., 2013), all aimed at evaluating the state of activity of the volcano. Compared to the several studies on the fumarolic system, the geology and the plumbing system of the volcano are not well known. Soto (1988) was the first describing the geology of Turrialba volcano, the petrography and whole rock geochemistry of its products, and mapped the geology and the tectonic features of the edifice. Reagan et al. (2006) dated via 14C
2
the volcano. More recently, Ruiz et al. (in press) dated via 40Ar/39Ar eight lava flow units erupted in the last 250ka, and partly modified the volcano stratigraphy of Reagan et al (2006).
This thesis combines whole rock, gases and fluid inclusions geochemistry to better constrain the magmatic source feeding the plumbing system of the volcano and to evaluate the state of activity at the date of sampling. Textural analysis of selected eruptive products were performed, in order to investigate different eruptive behaviors. Uniaxial press measurements were also performed on andesite samples from the most explosive eruption of the last 10ka, to constraint the rheology of these magmas. Combination of textural analyses and rheological measurements gives us additional constraints on the expected eruptive behaviour of Turrialba volcano in the event of a renewal of magmatic activity.
Thesis structure and summary of contents
Chapter 2: This chapter contains a description of the regional and local tectonic setting and presents review of the geological knowledge on Turrialba volcano. Fifteen rock samples were collected in the March 2011 survey, all related to the last 10ka activity of the volcano; samples were used for major and trace elements geochemical analyses and to perform noble gas geochemistry on olivine and pyroxenes crystals (Chapter 4). Whole rock geochemistry will be discussed in this chapter. Samples belong to the calc-alkaline series and cover the entire compositional range of Turrialba volcano, from basalts/basaltic-andesites to dacites.
Chapter 3: In this chapter, the results of the fluid geochemistry investigation performed during the March 2011 survey are presented. A brief overview on previous works on the gas discharge system is given at the beginning of the chapter. Then results the CO2 soil degassing prospection are
presented; soil flux data were collected by accumulation chamber method, and 973 measurements with a spacing of 30m and over a surface of 0.807 km2 were carried out. Values of the CO2 soil flux
display a wide variation, ranging between 0.4 to 52090 gm-2d-1. Along with the gas flux survey, temperature measurements at a soil depth of 10 cm were also carried out, giving temperature anomalies up to 85°C. The CO2 soil flux profiles were performed at “Falla Ariete”, a peripheral
fault with respect to the top of the volcano, where fumaroles appeared in 2007. Here the highest peak in flux anomaly gave a value of 5375 gm-2d-1, whereas soil temperatures measured ranged from 9.2°C to 73.7°C. At that time, 229 measurements of soil gas concentrations were performed in the summit crater area with the aim of mapping the soil concentration of He, H2 and CO2 Finally,
3
Crater. These measurements were useful to constraint the state of activity of the volcano at the time of the investigation, and to complete the temporal data series available of the geochemistry of Turrialba gas discharge system.
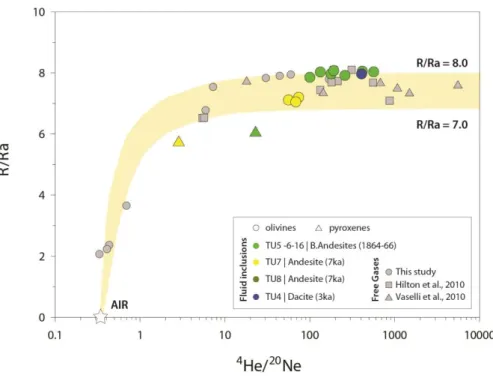
Chapter 4: This chapter presents the results of a noble gas geochemical study of fumarolic gas discharge and of fluid inclusions hosted in olivine of Turrialba rocks. Main aim of this study is to give new insights on the magmatic source, particularly on the presently degassing magma involved in the ongoing unrest phase. The 3He/4He ratio of fluid inclusions from the most mafic eruptive products (SiO2=52.5wt% and MgO=6wt%) varies from 7.86 to 8.07 Ra, while that from andesite
lavas varies from 7.03 to 7.18 Ra. In order to evaluate the extent of crustal contamination, Sr and Nd isotope analyses were performed on selected samples. This helped to constrain the geochemistry of the local mantle source. The comparison of He-isotopic compositions of fluid inclusions with that of fumaroles shed new light on the composition of magma degassing at present day and on the ongoing unrest at Turrialba volcano. The fumaroles collected in 2007-2011 show an helium isotope composition of 7.50-7.96 Ra, which is well in the range of that measured in fluid inclusions from the more mafic recently erupted rocks. On the basis of this findings, we suggest that the magma involved in the ongoing unrest phase and feeding the crater fumaroles has a geochemical affinity with the most basic basaltic-andesitic magmas analyzed in this study. In addition, monitoring of He isotope composition of fumarolic gas in the last years at Turrialba volcano, displays a progressive increase of 3He/4He ratios, which could be related to the simultaneous unrest testified by the increased seismic activity. We infer that this variation is likely related to a refill of the plumbing system by a 3He-rich magma, which should be very primitive and rising directly from the mantle. Chapter 5: Noble gas geochemistry data presented in Chapter 4 indicate that magma involved in the ongoing unrest phase may have the same composition of that erupted during the last phase of activity. For this reason, basaltic-andesitic samples of the 1864-66 eruption and of the most explosive eruption of the last 10ka (1.9ka andesitic eruption) were chosen for textural analysis. Detailed stratigraphic studies and sampling of both eruptions were performed in 2011 and 2012. For the 1.9ka eruption, it was possible to study proximal, intermediate and distal outcrops, whilst for the 1864-1866 eruption, only one key outcrop was chosen. Textural analysis of vesicles and crystals were performed on selected samples, on the basis of their density and vesicularity. This study permits to understand the eruptive style of this two eretions and to classify them on the basis of their textural parameters.
4
natural, partially crystallized magma from Turrialba volcano (1.9ka) andesitic eruption. The experiments were performed using a high-temperature uniaxial Geocomp LoadTrac II press at dry atmospheric conditions and under controlled deformation rates. Each experiments involved deforming cores of natural (i.e. crystal- and vesicle-bearing) scoriaceous sample, at various step temperatures (790 – 870°C) and variable strain rates (from 10-5 to 10-3 s-1). Objective of this study is to evaluate the multiphase rheology of these samples, and thus the effect of vesicles and crystals on the viscosity of the magma; in addition, it is useful for a general understanding of the full complexities governing the dynamics of magma transport in natural systems. Combination of textural analyses and rheological measurements were also performed to give additional constraints on the expected eruptive behaviour of Turrialba volcano in the event of a renewal of magmatic activity.
5
The unrest phase that affected Turrialba volcano since 1996 drew the attention of the Scientific Community on this previously poorly known volcano. Understanding the volcanological and petrological evolution of Turrialba is an important step to better evaluate its potential hazard and delineate possible hazard mitigation plans. This chapter contains a brief introduction on the geological and tectonic context in which this volcano lies, and an overview of the geochemistry of Turrialba rocks younger than 10-ka with the contribution of new data coming from this study. Samples were collected during a field trip performed in March 2011. Results were merged with other studies in order to complete the dataset available and to assess the evolution of magmas feeding the plumbing system of the volcano.
2.1 Geodynamical background 2.1.1 Regional setting
Costa Rica is situated to the north-east of the Middle American Trench (MAT), which marks the subduction of the Cocos Plate underneath the Caribbean Plate and Panama Microplate, running from southern Mexico to Panama (deMets et al., 1994). The Cocos plate is being subducted at a rate of 8.5–9.0 cm y-1 towards N32E (Protti et al., 1996) and this process is responsible for contemporaneous superimposed compressive, wrench and extensive fault patterns in Central Costa Rica. The convergence rate between the Cocos and Caribbean plates increases to the south-east from 60 mm/yr to ~90 mm/yr off southern Costa Rica (deMets, 2001). Moving along the southern sector of the MAT, the N-S oriented Panama Fracture Zone separate the Cocos and Nazca plates, whose edges in the Pacific Ocean correspond to the W-E oriented boundary of the Cocos-Nazca Spreading Center Plates (Fig. 2.1a). Offshore, before the MAT, the Cocos Plate is morphologically subdivided in three sectors (Fig. 2.1; von Huene et al., 2000): a) the first northernmost sector is a smooth segment of oceanic crust formed 20-25 Ma ago at the East-Pacific-Rise and Cocos-Nazca Spreading Center; b) the second sector is characterized by 15-20 Ma oceanic crust covered by seamounts (seamounts domain or seamount province); c) the third sector is the aseismic Cocos Ridge that consists of 2-km-thick low density volcanic layers (Bently, 1974), which make this crust sector more buoyant than the adjacent Early to Middle Miocene oceanic crust (Hey, 1977; Meschede et al., 1978). This geodynamically peculiar subdivision is due to the interaction of the
6
Cocos-Nazca Spreading Center with the Galapagos hotspot (Barckhausen et al., 2001), which created multiple inactive volcanic ridges, almost perpendicular to the trench and as high as 2000 m above sea bottom (Cocos ridge, Coiba ridge, Malpelo Ridge, etc.). The subduction of Nazca Plate underneath Panama, Colombia and Ecuador is nearly perpendicular to the Middle and South American Trench (Fig.2.1a).
Fig. 2.1 – A) Location of Costa Rica in the geodynamic setting of Central America (base map is a satellite image; coordinates are in WGS84). B) Regional map of Costa Rica showing the locations of the major volcanoes which are
identified with the following labels: TU, Turrialba; IR, Irazu; BA, Barva; PO, Poás; PL, Platanar; AR, Arenal; TE, Tenorio; MI, Miravalles; RI, Rincon de la Vieja; OR, Orosì; BR, Barù (base map from www.geomapapp.org/ ).
Southern Costa Rica and Panama are located on the Panama Microplate (Adamek et al., 1988), where the underthrusting of the Caribbean Plate beneath the Panama Block occurred between 69 and 52 Ma, along its northern boundary (Adamek et al, 1998; Camacho et al., 2010). Central Costa Rica is characterized by the presence of a diffuse fault system named Central Costa Rica Deformed Belt (CCRDB) that represents also the northwestern boundary of the Panama Microplate (Marshall
A
7
et al., 2000, Montero, 2001; Lewis et al., 2008). There is a large consensus that the CCRDB is a system of NW dextral and NE sinistral shears, reconstructed as an arcuate zone of diffuse strain, able to define the tectonic features of the central Costa Rica as early modeled by Alvarado Villalón (1984). Costa Rican volcanoes are the southern tail of the Quaternary volcanic front of Central America (CAVF), which extends over a length of about 1000 km from central Mexico to Central Costa Rica and comprises about 40 active or dormant volcanoes. This makes this boundary one of the volcanically most active convergent plate margin on Earth (Carr and Stoiber, 1990; de Boer et al., 1995). A volcanic gap of about 180 km in this arc extends between the active Irazú-Turrialba volcanic complex, in Central Costa Rica, and the historically active Barú complex in Panama(Fig.
2.1a). The temporal evolution of this volcanic arc is not well constrained. In Costa Rica there is an
evidence of old arc volcanism in the sedimentary record since the Albian (Calvo and Bolz, 1994). The oldest volcanic rocks are those of the Sarapiquí Arc (22.2 – 11.4 Ma) (Gazel et al., 2005), located behind the present volcanic front of Central Costa Rica. A temporal gap in volcanism is recorded between 14 and 11 Ma, possibly due to the collision of older Galapagos hotspot tracks with the Caribbean Plate (Hoernle et al., 2008). Whereas arc magmatism is continuous in northern and central Costa Rica, there are no calc-alkaline arc rocks younger than 8Ma in the Cordillera de Talamanca (Alvarado et al., 1992; de Boer et al., 1995), in the southernmost part of Costa Rica (Fig. 2.1a).
This lack of younger arc products defines the magmatic gap in that part of the region. Apparently since 8Ma, the Cocos Ridge collided with Central America, causing uplift and the formation of the Cordillera de Talamanca between 4.5 and 3.5Ma (Krawinkel et al., 2000; Meschede et al., 1998). Alkaline backarc magmatic activity also occurred about this time (Abratis & Worner, 2001). Extrusive and intrusive rocks older than 8Ma in the Cordillera de Talamanca are mostly calc-alkaline in composition, followed in volume by older tholeiitic arc rocks (Abratis & Worner, 2001). Minor centers of alkali volcanic and intrusive rocks occur scattered in the Costa Rica backarc and in one location at the forearc region (5.8 Ma to Holocene; Abratis & Worner, 2001).
The Costa Rican volcanoes are built on the Chortis Block in the north and the Chorotega Block in central and southern Costa Rica (Escalante, 1990; Linkimer et al., 2010); the boundary between these blocks is still matter of debate. In south-central Costa Rica, the Moho of the overriding plate is found at an average depth of 35 km, and toward the Talamanca Mountain Range it reaches a depth up to 50 km (Dzierma et al., 2010). Some authors (Carr 1984; Donnelly et al. 1990) consider this relatively young and thick continental crust of southern Central America less radiogenic, if compared to the crust of other continental margins. Lavas from CAVF in southeast Guatemala, El
8
Salvador, Nicaragua and northern Costa Rica are basically representative of subalkaline to calc-alkaline basalts and andesites, which do not show obvious isotopic evidence of crustal assimilation (Patino et al., 2000). Volcanic rocks from central-eastern Costa Rica and Panama are basically calc-alkaline but one of the most striking feature of this region is the presence of andesites, dacites and rhyolites with geochemical signatures indicative of partial melting of the subducted slab. Although volumetrically minor, these rocks with slab-melt geochemistries are called adakites elsewhere (Defant and Drummond, 1990; Defant et al., 1992) and are usually associated to young, relatively hot, buoyant oceanic (lithospheric) slab. Small bodies of adakite lavas and dikes occur in the Talamanca range in southern Costa Rica (Drummond et al., 1995) and are dated between 1.9 and 3.5 Ma (Abratis and Wörner, 2001) or even occur above the (subducting) Cocos Ridge. By contrast, literature does not report adakite rocks along the CAVF. Currently, a wide variety of genetic processes (and arc settings) is invoked for the genesis of these rocks and therefore the term adakite should be used with extreme caution (Castillo, 2012).
Despite a rather homogeneous major elements composition – suites can be referred to CA and HKCA suites - one of the fascinating characteristics of the whole Central America magmatism is the pronounced regional variation along the arc of several geochemical ratios that are able to give insights about slab signals. Most of the authors (see Saginor et al., 2013 and references therein) agree that the geochemical features recorded along of the CAVF reveal changes in the mantle and crust, changes in the strength of the slab signal and changes in the type of slab signal, primarily the extent of the hemipelagic sediment component. The subducted sediment component appears to be dominant beneath Nicaragua, but on the other hand Guatemala and Central Costa Rica are characterized by an enriched OIB-type component (Eiler et al., 2005; Hoernle et al., 2008). Actually, the sediment cover of the Cocos Plate appears to be entirely subducted along most of its margin. Feigenson and Carr (1993) proposed two mantle reservoirs for Central America volcanism: 1) an analogous of Depleted Mantle, similar to source of mid-ocean ridge basalts (MORB); 2) veins of enriched mantle into the DM source. Melting of this veined mantle source and its interaction with the subduction component produced magmas with a typical arc signature (Carr et al., 2003; Feigenson et al., 2004).
In Central Costa Rica lavas display an anomalous Galapagos-OIB signature (Reagan and Gill, 1989; Herrstrom et al., 2005; Feigenson et al., 2004). Many models have been proposed to constrain the presence of OIB-signature in Costa Rican magmas. Abratis and Wörner (2001) suggested the presence of a slab window in the subducting Cocos Plate, allowing Galapagos asthenosphere to rise through the window into the mantle wedge below southern Costa Rica and Panama. Feigenson et al. (2004) suggested that the OIB signature is the result of melting Galapagos-modified mantle below
9
central Costa Rica and Panama. Goss and Kay (2006) invoked the incorporation of fore-arc oceanic complexes into the mantle wedge. More recently Benjamin et al. (2007), Hoernle et al. (2008) and Gazel et al. (2009), suggested the geochemical influence of the subduction of Galapagos hot spot tracks beneath central Costa Rica. The volcanic rocks from the seamounts range in composition from tholeiitic to alkalic, but most of them are alkalic.
2.1.2. Local setting: the Turrialba volcanic system.
Turrialba massif is located in a complex tectonic zone, where the Central Costa Rica Deforming Belt meets that of North Panama (Montero, 2003). Together with the Platanar, Poás, Barva and Irazù, the Turrialba volcano forms the Cordillera Central, a large massif of overlapping lava flows and pyroclastic rocks. The main volcano-tectonic structures of Turrialba volcano are oriented NE-SW. The summit of the volcano is characterized by a scissor-shape depression, interpreted either as a collapse caldera (Alvarado, 1984; Paniagua, 1984), a tectonic caldera related to a slope failure (Soto, 1988) or a glacial circus (Reagan et al., 2006). The top of the volcano shows a 1 km-long depression, with steep inner walls (50-70°) and three nested NE-SW oriented main craters inside. The summit depression is cut by at least three main normal fault systems (Fig. 2.3), described by Soto (1988) and named Ariete, Elia, and Guácimo.
Fig. 2.3 – A) Location of Turrialba volcano and its surroundings. Red triangles are other volcanic edifices near Turrialba. B) Volcano-tectonic sketch map of Turrialba volcano. Red line are faults, red triangle are satellite pyroclastic
10
Ariete Fault cuts the entire southeastern flank of the volcano, running near to two satellite pyroclastic cones: Tiendilla (70 m high and 3.6×10⁶ m3 in volume) and El Armado (120 m high and 1.8×10⁷ m3 in volume), both coherently oriented along the main regional tectonic direction. El Armado pyroclastic cone has been dated 61.0 ± 6 ka (40Ar/36Ar method; Ruiz-Cabillo et al., 2010). On the same NE-SW tectonic system, other two volcanic edifices now inactive occur: Dos Novillos volcano and Finca Liebres, respectively (Fig. 2.3a). The first is located ~7 km NE of Turrialba summit and is a partially eroded and dissected volcanic apparatus, with an age of 100-200 ka, which is cut by a WNW tectonic structure that interrupts the Turrialba fault system. Finca Liebres is an eroded volcanic structure located ~5 km SW of Turrialba edifice and its most recent eruption has been dated 250ka (Ruiz-Cabillo et al., 2010).
The regional NE-SW oriented structure is responsible for the position of Turrialba volcano and related volcano-tectonic structures. Van Andel (1971) and Stoiber & Carr (1974) proposed that the very prominent N60E alignment Irazú – Turrialba could be related to tectonic structures created by the right lateral shear, striking N30E and reflecting a difference in subduction velocity between western and eastern Costa Rica. Seismicity extending from the surface to Moho depth (Dzierma et al., 2010), P-wave velocities and velocity ratios between P-waves and S-waves (vp/vs) imaged by tomography (Dinc, 2008), indicate that the total crust may be disrupted in this region. Güendel and Protti (1998) observed that at around lat. 83°55’W, where Turrialba and Irazú volcanoes lie, the region is characterized by a sudden arrest of the seismic activity to the south, in coincidence with the termination of the volcanic activity. They explain this with the subduction to the south of a younger crust (15Ma), which is characterized by a thermal structure that allows a more plastic behavior respect to the northern slab. These authors identify here a N30°E strike-slip tectonic regional boundary crossing the tectonic trough of the Central Valley of Costa Rica and connecting the North Panama Deformed Belt (NPDB) to the Middle American Trench. They describe this as a narrow and almost linear structure, due to the propagation of the NPDB. Fernández-Arce (2009) observed that the dominant trend of faulting, in this sector of Costa Rica, is northwest. So neither the set of sub-parallel strike-slip faults which comprises the transcurrent fault zone trending NE-SW proposed by Fan et al. (1993) nor the linear shear zone of Güendel and Protti (1998) are supported by the faulting of this area. The author suggests that the tectonic boundary previously proposed is not evident and it cannot be inferred from the observed surface faults and earthquake activity. However, the region where Turrialba volcano lies is characterized by a high seismicity due to the presence of numerous active fault systems. The most important faults are Atirro, Juan Vinas, Tucurrique (NW-SE), Turrialba, Aquiares, Pejibaye (NE-SW, normal fault), Chirripó (NE-SW,
11
inactive) and the systems related to the North Panama Deformed Belt. The latter was responsible for the occurrence of violent earthquakes in 1822, 1916 and 1991 (Alvarado, 2002). The Turrialba region was always interested by microseismicity, in particular between the zone of Tucurrique and rio Chirripó (Barquero et al., 1993), and also major earthquakes occurred here, e.g. the April 1991 ML 7.7 event and the magnitude 7.0 event of 19 November 1948 (Boschini, 1989) represent two of
the highest magnitude events recorded in historical times.
2.2 Volcanological evolution of Turrialba volcano
Previous studies of Turrialba volcano were carried out by Soto (1988), Reagan et al. (2006) and more recently by Ruiz et al. (2010).
Soto (1988) produced the first geological map of the summit cone of Turrialba, identifying Finca Liebres (~7 km SW to the summit of the volcano) and other lavas outcropping on the eastern flank of the volcano as its oldest products. He recognized 15 eruptive units produced by the activity of the present cone. All the analyzed samples are medium to high-K calc-alkaline basaltic-andesites to dacites, with a typical mineral assemblage made of abundant plagioclase, clino- and orthopyroxenes and olivine.
Reagan et al. (2006) focused on the most recent activity of the volcano, identifying at least 8 “eruptive units” in the last 10 ka and some older units, distinguished on the basis of a significant erosional period occurred between 50 and 9 ka. The most recent products, dated by radiocarbon measurements of charcoal fragments in paleosoils and fall out deposits, range in age between 9300 y BP and 644 AD. The authors recognized products related to two younger eruptions: the former occurred during an unidentified time-span after 644 AD, and the latter in the period 1864-1866 AD. All the eruptive products of Turrialba volcano belong to the calc-alkaline series and are basaltic-andesitic to dacitic in composition. A general decrease in silica content and a contemporaneous increase in explosivity, was observed with time. Effusive activity was mainly concentrated in the first phase of the last 10ka activity, then Strombolian to Vulcanian eruptions occurred, fed by basaltic to andesitic magmas, with the exception of a Plinian andesite eruption occurred at 1.9 ka. Average repose time between major eruptive units is in the order of 600 – 800 years.
Ruiz et al. (2010) distinguished three main phases of construction of the Turrialba volcano edifice: Proto-Turrialba (~1Ma – 600 ka), Paleo-Turrialba (~600 – 250 ka) and Neo-Turrialba (< 250 ka). They obtained 40Ar/39Ar geochronological data on lava flows emitted between 251±4ka and 3±3ka.
12
According to the age obtained and the areal distribution of the products, the most important constructive period of the massif was during the Neo-Turrialba stage which has passed through two important constructing episodes, around 100-60ka and 10ka – present (Ruiz et al., 2010).
2.2.1 Chronicles of the 1864-1866 AD eruption
The most recent eruptive magmatic activity which occurred at Turrialba volcano was well described by the work of González-Viquez (1910), in a study which gathers all eyewitness accounts and which is briefly summarized below. Prior to the eruption, Turrialba was characterized by a fumarolic activity which at least since 1723 A.D. On 26 February 1864, an expedition reached the summit of the volcano and found a 100 m-deep crater, with more than 100 fumaroles feeding a 200m-high gas plume. All the vegetation seemed to have been burned by acid rains. On 17 August 1864 an ash fall was registered in San José and in the Central Cordillera; this represented the first phase of the eruptive activity. Ash fell again on the Central Valley of Costa Rica throughout 16-21 September. At the end of September 1864, a new expedition reached the Turrialba summit and its components described a single vent discharging gas into the atmosphere, producing a loud noise and creating a dark plume ~400m high. Large ejected blocks were noticed on the summit area, and the vegetation appeared destroyed for many kilometers to the north-west and west of the volcano. Ash fell on San José till the end of 1864 (von Seebach, 1865). On 8 March 1865, a third expedition reached the summit of the volcano: they described the widening of the West crater, characterized by a funnel shape. Between January and February 1866, the largest eruptive events of this eruption occurred. Ash fell in the Central Valley of Costa Rica for four days in January and three days in February. Ash reached Puntarenas, located 125km W of the volcano. Phreatic explosions occurred at the end of the eruption. Merging stratigraphic data with the chronicles published in González-Viquez (1910), Reagan et al. (2006) interpreted this eruption as a series of phreatic explosions and phreatomagmatic events producing eruptive columns with ash and lapilli rains, in the summit region and downwind to the west and with the deposition of pyroclastic surges only in the summit.
2.2.2 The present unrest phase (1996 – 2013)
After the 1864-1866 eruption, no volcanic magmatic activity has been recorded. A few strong fumarolic emissions were reported in local newspapers during the year 1920 and in 1950-60 (Tassi et al., 2004b). In 1996, a progressive increase in seismic activity and in the fumarolic emission from the summit craters interrupted this period of quiescence. The outlet temperature of crater fumaroles was buffered at T= 95°C (approximately the water boiling temperature at 3000m) because of the abundant rainfall feeding the shallow aquifer (Martini et al., 2010). This stage continued until the
13
year 2001, when a further increase in fumarolic activity and in the concentration of magmatic gases (i.e. SO2, HCl and HF) was observed (Tassi et al., 2004; Vaselli et al., 2010). No significant
variation in fumarolic output temperature was measured. In June 2005, new fumaroles with outlet temperatures of ~90°C appeared along Ariete Fault (Martini et al., 2010; Vaselli et al., 2010). During spring and summer 2007, two important seismic swarms were recorded. In July, the maximum seismic activity to date, with 2000 event/day, for several days, was recorded (Martini et al., 2010). At the same time, the widening of the fumarolic field was accompanied by a strong increase in fumarolic emissions, forming a plume that rose 2km in the atmosphere (OVSICORI-UNA, 2007). In 2008, fumarolic temperatures at the bottom of the West Crater increased from 88 to >270°C and SO2 flux increased by three order of magnitude (from 1 t/d in 2002 to >1000 t/d in
2008; OVSICORI-UNA, 2008). The interaction of acid gases with steam produced acid rains, mainly in the west sector of the volcano, that burned the vegetation and strongly affected settlements and infrastructures downwind to the plume (OVSICORI-UNA, 2007, 2008; Martini et al., 2010). On 5 January 2010, a phreatic explosion occurred at the West Crater with the emission of ashes that reached a distance of 35 km WSW from the vent (OVSICORI-UNA, 2010). The explosion created a 55x20m vent in the western rim of the West Crater that emitted steam and gas with an output temperature of ~600°C (OVSICORI-UNA, 2010). In the spring of 2011, a new vent opened on the north side of the bottom of the West Crater (OVSICORI-UNA, 2012), and the temperature of the emitted gas reached more than 610°C. Phreatic explosions from a new vent produced, at the beginning of January 2012, two small ash emissions (on 12th and 18th) for several hours. Gas temperature from the new vent was in the range of 700-765°C, and at the end of 2012 it reached a value of 805°C (OVSICORI-UNA, 2013). On 21 May 2013 another intense gas discharge episode occurred from both 2010 and 2012 vents, followed by a peak in seismic activity reached in July (>600 events/day; OVSICORI-UNA, 2013). Since August 2013 a decrease in seismicity and gas temperature from the 2012 vent was registered (from ~800°C to ~600°C; OVSICORI-UNA, 2013).
2.3 Field sampling
Rock samples were collected during in March 2011. In total, 45 rock samples were collected from units belonging to the last 10ka activity, following the stratigraphic description of Reagan et al. (2006). 21 of these samples were chemically analyzed for major and trace elements. Particular attention was given to olivine-bearing rocks in order to select samples suitable for noble gas analyses in fluid inclusions hosted in crystals (see Chapter 3). In some key outcrops detailed
14
stratigraphic sections were described. Samples were collected in the summit area and also on the flanks of the volcano: Fig. 2.5 shows the location of sampling sites on the volcano; Table 2.1 shows samples characteristics and coordinates.
Fig. 2.5 – Location map of samples collected in 2011 at Turrialba volcano. Eruptive products were sampled on the flanks of the volcano (A) and at its summit area (B). The insets on the right are two of the studied stratigraphic
sequences.
In the Crater Terrace sector, samples belonging to the last eruptive phase of 1864-66 A.D. were collected (TU5 – TU6 – TU16). They are dense (TU16) or scoriaceous (TU5-TU6) bombs emitted in the Vulcanian stage of the eruption, some with breadcrust morphology. They display porphyritic texture with phenocrysts of plagioclase, clinopyroxene and olivine. The key outctrop representative of this eruption was identified in the Cerro San Carlos sector; a stratigraphic study and a textural characterization of product related to this outcrop will be presented in Chapter 5. Xenoliths were observed in some samples. Also in this sector, between Central and NE Crater, dense bombs and ashes that should be related to historical activity (i.e. Unit 3 and 2, of Reagan et al., 2006) were also collected.
15
At the edge of the craters terrace, in the NE rim sector, three different lava flows were sampled (TU9 – TU10 – TU15). Sample TU9 belongs to a porphyritic lava flow sampled along the path descending toward NE from the top of the volcano; it contains phenocrysts of plagioclase clino- and orthopyroxenes with rare olivine. Sample TU10 was collected on the edge of the NE crater rim; at is porphyritic with plagioclase as the dominant phenocryst and could belong to the ~9 ka effusive activity described by Reagan et al. (2006). The last sample collected in this area, TU15, comes from a plug of lava showing a fluidal texture and a high density of xenoliths.
In the Radio Station sector, at the end of the road climbing up to the top of Turrialba volcano, we sampled and investigated in detail the deposits of the only Plinian eruption recently occurred at Turrialba, dated 1.9 ka. A detailed stratigraphic section describing the depositional succession of the eruption is reported in Chapter 5. This is considered one of the best exposure of the deposits of this eruption and displays an alternation of layers made of clasts with different density: from pumice to scoriaceous bombs and/or dense juvenile blocks.
Tab. 2.1 – Location and description of the collected Turrialba rocks
Samples have porphyritic structure with abundant plagioclase and clinopyroxene. In the same sector a massive porphyritic lava flow was also sampled (TU 18).
Near the Ariete Fault watershed, two massive lava flows were also sampled (samples TU7 and TU8). They have a porphyritic structure with plagioclase as the dominant phenocryst phase, clinopyroxene and rare olivine. TU7 lava flow is N160° oriented, dipping toward WSW with an
Sample Sector Coordinates Altitude Typology Descripition Age Eruptive Unit
TU5 Cra ter Terra ce N10°01.191’ W083°45.732’ 3175 m Spa tter s cori a Ves i cul a ted a nd s cori a ceous bomb, porphyri c. 1864-66 A.D. 1864-66 A.D.
TU6 Cra ter Terra ce N10°01.192’ W083°45.674’ 3174 m Bomb ~150cm di a meter, porphyri c brea dcrus t bomb wi th xenol i ths . 1864-66 A.D. 1864-66 A.D.
TU16 Cra ter Terra ce N10°01.517’ W083°45.577’ 3198 m Bomb Porphyri c dens e bomb 1864-66 A.D. 1864-66 A.D.
TU14/1 Cra ter Terra ce N10°01.279’ W083°45.442’ 3226 m Bomb Scori a ceous bomb wi th phenocrys ts of pl g 1.4ka 3(1) ? TU14/3 Cra ter Terra ce N10°01.279’ W083°45.442’ 3331 m Bomb Pomi ceous bomb, hi ghl y ves i cul a ted wi th domi na nt pl g phenocrys ts < 1.4ka 2(1) ? TU9 Ri m NE N10°01.589’ W083°45.654’ 3106 m La va Al etered porphyri c l a va fl ow wi th pl g + cpx a nd ra re ol i vi nes ~9.3ka 8b(1) ?
TU10 Ri m NE N10°01.461’ W083°45.391’ 3183 m La va Porphyri c l a va wi th mm-s i ze pl g crys tal s 9 - 9.3ka 8a(1) ?
TU15 Ri m NE N10°01.517’ W083°45.483’ 3210 m La va Sl i ghtly a l tered vertica l l a va pl ug wi th ma ny xenol i ths ? ?
TU11 group Ra di o Station N10°01.084’ W083°45.572’ 3282 m Pumi ces / Bombs cm-s i ze crea my pumi ces a nd m-s i ze s cori a ceous bombs 1.9ka 4(1)
TU18 Ra di o Station N10°01.124’ W083°45.467’ 3320 m La va Ma s s i ve porphyri c l a va fl ow wi th pl g a nd cpx 9 - 50ka 9(1)
TU3/1 Fi nca Retiro N10°00.742’ W083°47.034’ 2665 m La va ma s s i ve l a va fl ow wi th a utobrecci a a t top, mm-s i ze pl g a nd cpx ~10ka ?
TU3/3 Fi nca Retiro N10°00.742’ W083°47.034’ 2665 m Scori a e Bl a ck to red s cori a e wi th dmed 1cm a nd Dma x 5 cm 3 - 10ka ?
TU4 Fi nca Retiro - - La va Ma s s i ve porphyri c l a va fl ow wi th pl g phenocrys ts a nd ol i vi nes 3±3ka(2) La Pi ca da
TU7 Ari ete Fa ul t N10°00.282’ W083°46.106’ 2800 m La va Ma s s i ve porphyri c l a va fl ow wi th cm-s i ze pl g crys tal s a nd ol 3 - 10ka ?
TU8 Ari ete Fa ul t N10°00.326’ W083°46.139’ 2787 m La va Porphyri c l a va fl ow s l i ghtly ves i cul a ted wi th pl g, cpx a nd ol crys tal s 3 - 10ka ?
(1) Eruptive Units and age by Reagan et al. (2006)
16
angle of ~5-10°. The lava shows at least three different flow units, with a scoriaceous surface at the top of the deposit. Lava flow TU8, dipping toward N, is massive and shows slight vesiculation. In Finca Retiro sector, along the western flank of the volcano (Fig. 2.5), a pyroclastic succession and a lava flow were sampled. A stratigraphic section (TU3) was measured and sampled along this very well preserved outcrop cut by the road. This succession of volcanic products overlays a porphyritic lava flow (TU3/1), containing phenocrysts of plagioclase and showing an irregular autobreccia at the top. The lava flow is covered by 10-30 cm of grey to blue thin ash beds mm- to cm-thick and interpreted as pyroclastic surge deposits. This unit is overlapped by a ~150 cm-thick sequence of alternating black to red scoriae, yellow pumices and varicolored ashes among which it is easy to recognize a layer of black and reddish scoriae with a Dmed = 1 cm and DMAX = 4 – 5 cm,
highly vesiculated, with phenocrysts of olivine. The succession continues with an alternation of ash layers and thick carbon rich paleosoils up to the products of the 1.9 ka eruption.
2.4 Whole rock geochemistry: results
2.4.1 Analytical methods
Major and trace-element analyses have been performed on whole rock at Activation Laboratories Ltd. (Actlabs - Canada) using ICP-MS technical procedures (www.actlabs.com): molten rock samples were diluted and analyzed by Perkin Elmer Sciex ELAN 6000, 6100 or 9000 ICP/MS. Three blanks and five controls (three before sample group and two after) were analyzed per group of samples. Instrument were recalibrated every 40 samples. The analytical uncertainty varies between 0.001 and 0.01% for major and trace elements. Chemical analyses on minerals were performed at High Pressure and High Temperature Laboratory of Istituto Nazionale di Geofisica e Vulcanologia (INGV), Sezione di Roma-1, by using an Electronic Probe Micro Analysis (EPMA) Jeol-JXA8200 combined with EDS-WDS (five spectrometers with twelve crystals). For glasses, a slightly defocused electronic beam with a size of 1μm was used with a counting time of 5 sec on background and 15 sec on peak. For crystals, the beam size was 5μm with a counting time of20 and 10 s on peaks and background, respectively.
Sr and Nd isotope analyses were performed on powdered whole rock at the Department of Earth Science of the University of Florence, following the methodology described in Avanzinelli et al. (2005). Samples were prepared dissolving the powder in successive HNO3-HF and HCl 6N
17
with a Triton-Ti® as spectrometer equipped (Thermo Finnigan). Typical within-run precision (2) for Sr and Nd was ±0.000005 for both isotopes. Analyses of standard SRM987 for Sr-isotope measurements give a mean value of 87Sr/86Sr = 0.710248, with 2 = ±0.000015. For Nd-isotopic ratio were used NiFi standard, that produced a mean value of 143Nd/144Nd = 0.511467, with 2 = ±0.000008.
2.4.2 Nomenclature and classification
The volcanic rocks of Turrialba form a straight calc-alkaline suite in the AFM triangular diagram of Irvine & Baragar (1971; Fig. 2.6a). Only one sample (TU3/3) shows a marked increase in FeOtot/MgO, falling in the limit between calc-alkaline and tholeitic field. We observed however that
the TU3/3 sample displays an high degree of alteration, with the highest L.O.I. value (4.27 wt %; see Tab. 2.2) and we attribute its offset position to its high degree of alteration. In order to avoid possible errors in the classification and geochemical trends, samples with L.O.I. > 2.5 wt% (including therefore sample TU3/3) were discarded. The enrichment in potassium shown by the most evolved samples, places part of Turrialba magmatic series into the high-K calc-akaline field. On the basis of SiO2 and alkali contents, these rocks show an evolution from basaltic-andesite to
dacite, with a small compositional gap between 60 to 63 wt % of SiO2 (Fig. 2.6b).
Fig. 2.6 – A) AFM classification diagram (after Irvine and Baragar, 1971) and B) Total Alkali versus Silica classification diagram (after Le Bas, 1986) for the analyzed Turrialba rocks.
18
2.4.3 Petrography and Mineral chemistry
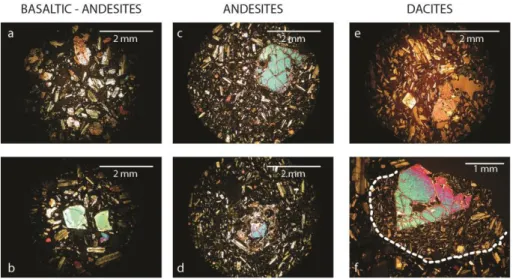
The petrography of Turrialba rocks was described by Soto (1988) and Reagan et al. (2006) but no detailed investigation on mineral chemistry of the rocks was ever published. Here for the first time, together with a petrographic characterization of the volcanic series, we present and discuss results of chemical analyses performed on minerals from selected samples. Representative microprobe analyses of the selected crystals are contained in Appendix 1. In Fig. 2.7 the textural characteristics of some selected samples representative of the magmatic series are illustrated. Classification of the analyzed minerals is shown in Fig. 2.8.
Fig. 2.7 – Microphotographs of some selected samples: a) TU5 basaltic-andesite; b) TU16, basaltic-andesite; c) TU7, andesite; d) TU8, andesite; e) TU4, dacite; f) TU15, dacite (the dotted white line indicates a mafic enclave with olivine).
Basaltic-andesites: black scoriae and bombs display vesicular to massive porphyritic structures (Fig.
2.7a,b), with plagioclase (>20 vol %), clinopyroxene (10 – 15 vol %), olivine (5-10 vol. %) and
magnetite as the main mineral phases and a microcrystalline groundmass. Plagioclase crystals display a broad range in anorthite contents (An47 to An70) (Fig. 2.8). Clinopyroxenes are augitic and have an homogeneous composition (Fig. 2.8). Olivine composition ranges from Fo70 to Fo84, the higher Fo contents being found in the cores of large crystals of scoria samples that display normal zoning, with more fayalitic rims (Fo 70 – 73; Fig. 2.8).
Residual glasses from scoriae and bombs range from trachy-andesite to rhyolite in composition, with the more evolved compositions pertaining to the more crystalline volcanic bombs.
19 Fig. 2.8 - Classification diagrams of the main mineralogical phases found in Turrialba rocks: clockwise, pyroxenes ternary diagram; olivine forsteritic mole percentage (Mg/[Mg + Fe], expressed as Fo%) and frequency of single crystals
analyzed; plagioclase ternary diagram.
Andesites: the analyzed samples are strongly porphyritic (up to 50 vol. %) massive lavas, and pumices with crystallinity of 25 - 30 vol % (Fig. 2.7c,d). Phenocrysts of plagioclase are always ehuedral and display a wide An content, ranging from anorthitic to andesine composition. All the analyzed phenocrysts display a strong chemical zonation with calcium-rich cores (An71 – An90) and less anorthitic rims (An59 – An48; Fig. 2.8). In samples TU7 and TU8 only few crystals show reverse zoning with sodic-rich cores (An51 – An61; Fig. 2.8) and more anorthitic rims (An67 – An74; Fig. 2.8). In contrast, microphenocrysts and microlites display more homogeneous anorthite contents between An53 and An64. Andesite samples contain both clinopyroxenes and orthopyroxenes in different amounts. Euhedral phenocrysts of clinopyroxenes (cpx) are diopsidic to augitic in composition (Wo39-44 En43-50 Fs8-13; Fig. 2.8); cpx occurs also as microlites in the
groundmass. Orthopyroxenes are less frequent as phenocrysts and are present essentially as microphenocrysts or microlites. Their average composition is En= 71 – 82% (Fig. 2.8), and they occur also in glomerophyric aggregates in association with clinopyroxenes and olivine. Some samples contain olivine crystals (in particular TU7 and TU8), with fractures and altered rims, sometimes with orthopyroxene crowns. Phenocrysts show normal zoning with Fo80-81 cores and Fo77-61 rims (Fig. 2.8); the smallest crystals show compositions ranging between Fo81 and Fo68.
20
In TU10 rare crystals of olivine Fo79 were found; they displayed skeletal shape and highly altered rim. Abundant magnetite occurs also as phenocryst, while apatite and ilmenite are found as inclusions within other crystal phases in certain andesites. Residual glass of andesites samples are dacitic to rhyolitic in composition.
Dacites: these lava samples are highly porphyritic (40-50 vol. %) with microcrystalline to cryptocrystalline groundmass (Fig. 2.7e,f). At times fluidal textures are observed and some analyzed samples contain xenoliths. Plagioclase is the dominant phase, with ehuedral crystals some of which displaying dense sieved textures. Phenocrysts are generally An60 – An46 in composition, but the sample TU9 contains also crystals with stronger normal zoning (cores An84 – An72; rims An 52 – An39; Fig. 2.8). Both clino- and orthopyroxene are found: crystals are generally ehuedral and in some sample they form glomerophyric aggregates. Clinopyroxene phenocrysts are augitic to diopsidic in composition (Wo40-45 En41-47 Fs10-13; Fig. 2.8), while orthopyroxenes display an
enstatitic content between 66 and 75%. TU4 dacite displays olivine xeno-phenocrysts >1 mm-size. The crystals present altered rims sometimes with orthopyroxene crowns and wide range of Fo in their cores (Fo94 – Fo76; Fig. 2.8). Sample TU15 is characterized by mafic enclaves with mm-size phenocrysts of olivine, commonly fractured and with Mg-rich cores (Fo90 – Fo82). The composition of these olivines is very rich in Mg with a narrow variation in forsterite as displayed in
Fig. 2.8. The groundmass is cryptocrystalline and made of abundant plagioclase, clinopyroxenes
and olivines.
2.4.4 Major and trace elements chemistry
18 samples of lavas, bombs and pumices erupted in the last 10 ka of activity, forming a compositional range from basaltic-andesite through andesite to dacite, have been analyzed for major and trace elements;the results are reported in Table 2.2. The analytical uncertainty varies between 0.001 and 0.01% respectively for major and trace elements.
Binary Harker variation diagrams of major elements show negative trends for TiO2, Al2O3, Fe2O3,
MnO, MgO, CaO and P2O5 and positive trends for Na2O and K2O (Fig. 2.9). Trends are always
linear except for slight variations in and K2O where andesites TU7, TU8, TU18 and TU3/1 appear
slightly depleted if compared to other samples with similar silica content. The andesites TU7, TU8, TU18 and TU3/1 also appear to have a higher alumina content with respect to the other Turrialba andesites. The implication for this anomalous behavior will be discuss in paragraph 2.5.3. Basalts display a high content in Al2O3 (16 – 18 wt %), a typical feature of volcanic arc magmas already
21 Tab. 2.2 – Whole rock analyses of major and trace elements of Turrialba volcanic rocks.
The progressive decrease of Fe2O3, MgO, CaO and MnO, from basalt-andesitic to dacitic samples is
due to the crystallization of olivine and pyroxenes (clino- and ortho-). Plagioclase crystallization results in a decrease of Al2O3 with magma evolution, while the observed decrease in P2O5 is due to
apatite crystallization. Magnetite and Ilmenite crystallization contributes to the decrease respectively of Fe2O3 and TiO2 content from mafic to felsic eruptive products.
Trace elements variation diagrams display larger variations, and different trends can be envisaged (Fig. 2.10). In particular HFSE elements (Zr and Hf, and to a lesser extent Nb) display smooth positive correlation trend if plotted against SiO2, except for a specific group of andesitic samples
(TU7, TU8, TU10/1, TU3/1a, TU18) that fall systematically outside these trends due to the lower HFSE contents. Same behavior can be observed also for Y, although in this case the scattering complicates the interpretation of the data. LILE elemenst (Rb, Ba and Cs or Pb, not shown) are characterized by steeper positive correlation, while Sr display a quite linear negative correlation, if we exclude the group of andesitic samples with higher Sr contents.
A ge 1864-66 1864-66 1864-66 1.4ka < 1.4ka ~9.3ka 9 - 9.3ka ? 1.9ka 1.9ka 1.9ka 1.9ka 9 - 50ka ~10ka 3 - 10ka 3±3ka(2) 3 - 10ka 3 - 10ka
S a m ple T U5 T U6 T U16 T U14 / 1 T U14 / 3 T U9 T U10 T U15 T U11/ 1A T U11/ 2 T U11/ 3 T U11/ 4 A T U18 T U3 / 1A T U3 / 3 T U 4 T U7 / 2 B T U8
SiO2 % 53.20 52.97 53.07 55.37 58.49 64.15 57.79 62.76 58.55 59.28 57.89 58.15 58.68 57.95 50.06 64.22 57.15 57.86 A l2O3 % 17.31 17.21 17.24 16.87 16.08 16.89 17.61 16.29 16.77 16.56 16.45 16.59 18.18 17.85 18.03 16.04 17.48 17.76 Fe2O3(T) % 8.26 8.34 8.26 7.21 6.62 4.71 6.74 5.04 6.18 6.19 6.50 6.64 6.55 6.39 9.11 4.73 6.74 6.52 M nO % 0.13 0.14 0.14 0.12 0.11 0.09 0.12 0.09 0.11 0.11 0.11 0.12 0.11 0.10 0.13 0.09 0.10 0.10 M gO % 5.83 6.17 6.09 5.20 4.84 2.07 3.89 2.90 3.63 3.59 3.82 3.74 3.53 3.78 4.92 2.18 4.31 4.13 CaO % 9.39 9.43 9.35 8.17 6.82 4.57 7.24 5.15 6.49 6.54 6.86 6.83 7.17 7.39 8.47 4.51 7.31 6.99 Na2O % 3.27 3.21 3.26 3.42 3.58 4.05 3.13 3.83 3.73 3.77 3.66 3.74 3.59 3.92 2.63 4.00 3.82 3.93 K2O % 1.47 1.44 1.43 1.60 2.17 3.15 2.10 2.76 2.35 2.38 2.31 2.35 1.62 1.18 0.80 3.35 1.38 1.40 TiO2 % 1.04 1.05 1.04 0.91 0.85 0.64 0.77 0.62 0.84 0.85 0.91 0.91 0.71 0.71 1.50 0.65 0.84 0.83 P2O5 % 0.39 0.35 0.35 0.30 0.29 0.21 0.24 0.22 0.30 0.31 0.33 0.35 0.25 0.25 0.27 0.22 0.25 0.25 To tal % 100.6 100.8 100 99.16 100.2 100.5 99.62 100.6 99.59 99.95 99.26 100.1 100.7 99.88 100.2 100.5 99.37 100.5 LOI % 0.26 -0.05 -0.20 0.00 0.35 0.00 0.00 0.89 0.64 0.37 0.40 0.69 0.26 0.36 4.27 0.51 0.00 0.76 Sc ppm 26 27 27 22 18 9 17 11 17 17 18 18 14 15 30 10 18 17 B e ppm 1 1 1 1 1 2 2 2 2 1 1 2 < 1 < 1 1 2 3 1 V ppm 229 231 230 203 171 99 173 117 162 165 175 180 160 168 195 101 181 177 B a ppm 667 654 650 669 846 1117 805 993 904 921 890 901 692 681 474 1221 767 785 Sr ppm 802 794 825 854 738 716 1014 729 740 743 790 743 1072 1000 848 610 926 902 Y ppm 23 17 18 15 15 19 15 15 17 18 18 19 11 10 21 19 16 11 Zr ppm 149 143 141 137 184 236 155 207 202 205 198 201 93 89 139 273 111 102 Cr ppm 120 140 140 110 140 20 40 70 60 60 60 60 < 20 50 90 40 60 50 Co ppm 28 30 30 26 23 12 22 15 19 19 20 20 20 21 31 14 24 24 Ni ppm 50 60 50 50 70 < 20 40 30 30 30 30 30 30 40 50 < 20 50 40 Cu ppm 70 100 100 70 90 50 80 60 80 80 80 70 50 100 120 50 110 70 Zn ppm 60 80 80 80 70 60 70 60 70 60 70 60 60 70 80 60 70 60 Ga ppm 17 18 18 18 18 18 19 17 18 18 18 17 20 19 20 17 18 18 Ge ppm 1 2 2 2 2 2 1 2 1 2 2 2 1 1 2 2 1 1 Rb ppm 27 28 29 33 48 72 41 64 53 56 52 48 27 19 20 82 26 26 Nb ppm 13 13 14 13 17 18 11 16 18 20 20 18 6 6 19 23 9 8 A g ppm 0.8 0.8 0.9 0.8 1.2 1.6 0.8 1.3 1.1 1.4 1.2 1.2 0.6 0.6 0.9 1.8 0.6 0.5 La ppm 32 32.9 32.8 29.7 36.7 45.9 30.1 37.5 40.3 40.9 42.3 38.6 15.6 20.1 26.5 50.7 27.6 23 Ce ppm 62.6 67.1 66.1 58 68.8 83.4 58.2 68.6 75.4 76.8 79.9 72.9 31.3 37.9 54.4 91.1 52.7 43.6 P r ppm 7.62 7.78 7.9 6.83 7.73 8.93 6.68 7.39 8.43 8.74 9.02 8.13 4.03 4.52 7.02 9.86 6.23 5.15 Nd ppm 29.6 31.6 30.9 25.9 28.6 31.1 25.1 26.3 31 31.4 33 30.8 15.9 17.4 28.6 33.5 23.8 20.5 Sm ppm 5.6 6 5.8 4.8 5.1 5.2 4.8 4.4 5.5 5.5 5.9 5.3 3.3 3.3 6.2 5.9 4.3 3.9 Eu ppm 1.56 1.67 1.6 1.27 1.28 1.21 1.29 1.08 1.42 1.39 1.51 1.32 1.06 0.97 1.76 1.34 1.18 1.17 Gd ppm 4.4 4.9 4.5 3.6 3.6 3.9 3.7 3.3 4 4.2 4.4 4 2.8 2.4 5 4.4 3.6 3 Tb ppm 0.6 0.7 0.6 0.5 0.5 0.6 0.5 0.5 0.6 0.6 0.6 0.6 0.4 0.3 0.7 0.6 0.5 0.4 Dy ppm 3.3 3.8 3.5 2.8 3 3.2 2.8 2.7 3.3 3.4 3.3 3.2 2.2 1.7 4 3.4 3 2.3 Ho ppm 0.6 0.7 0.7 0.6 0.6 0.6 0.5 0.5 0.6 0.6 0.6 0.6 0.4 0.3 0.8 0.7 0.6 0.4 Er ppm 1.8 2 1.8 1.5 1.6 1.8 1.4 1.5 1.7 1.8 1.8 1.7 1.1 0.9 2 1.9 1.6 1.1 Tm ppm 0.25 0.28 0.26 0.21 0.23 0.27 0.22 0.22 0.26 0.25 0.26 0.25 0.16 0.13 0.27 0.29 0.22 0.16 Yb ppm 1.6 1.9 1.7 1.4 1.6 1.8 1.4 1.6 1.8 1.7 1.8 1.6 1 0.9 1.7 2 1.4 1 Lu ppm 0.25 0.3 0.28 0.23 0.27 0.31 0.22 0.28 0.33 0.29 0.31 0.28 0.17 0.14 0.26 0.32 0.21 0.17 Hf ppm 3 3.2 3.1 3 4 4.8 3.5 4.6 4.2 4.4 4.4 3.9 2.3 2 3.1 5.6 2.4 2.3 Ta ppm 0.7 0.7 0.7 0.7 1 1.2 0.6 0.9 1.1 1.1 1.2 1 0.3 0.3 1.1 1.4 0.5 0.4 W ppm 7 7 8 7 6 8 6 7 7 6 5 10 8 5 5 21 15 16 P b ppm < 5 < 5 < 5 5 6 10 7 8 7 5 7 6 6 < 5 < 5 9 5 < 5 Th ppm 5.3 5.1 5.3 6.6 9.2 15.5 9 12.8 10.1 10.2 9.9 9.4 3.1 2.3 3.6 15.9 4.1 3.1 U ppm 1.8 2 1.8 2 3.1 4.7 2.6 4 3.3 3.5 3.3 3.1 1.3 0.9 1.1 5.4 1.3 1.2 87Sr/86Sr 0.703663 0.703678 0.703666 0.703593 0.703654 0.703621 0.703612 2 s.e. ± 0.000005 ± 0.000005 ± 0.000005 ± 0.000006 ± 0.000005 ± 0.000005 ± 0.000005 143Nd/144Nd 0.512963 0.512960 0.512963 0.512967 0.512966 - 0.512968 2 s.e. ± 0.000011 ± 0.000006 ± 0.000005 ± 0.000005 ± 0.000005 ± 0.000005 ± 0.000006
22 Fig. 2.9 – Major elements variation diagrams for Turrialba rock samples. Data are expressed in wt. % and are plotted on
23
In general, all LILE and HFSE elements investigated behave as incompatible elements, with the exception of Sr, substituting for Ca in plagioclases. The linear correlation among all samples suggest their cogenetic origin. The small group of andesite (TU7, TU8, TU10/1, TU3/1a, TU18), present clearly different values of trace elements, in particular they are depleted in all HFSE elements and in Rb and Th, but enriched in Ba and Sr, suggesting a different origin for this groups of samples. It must be noted that xenocrysts and enclaves of different origin may alter the overall composition of the rock. Xenocrysts of olivine and clinopyroxenes have been observed only for dacitic samples, however, and the trends that we observe in Fig. 2.10 are not substantially modified by the presence of these cumulates. The peculiar trace elements content of the group of andesites reported above must therefore have another explanation.
24
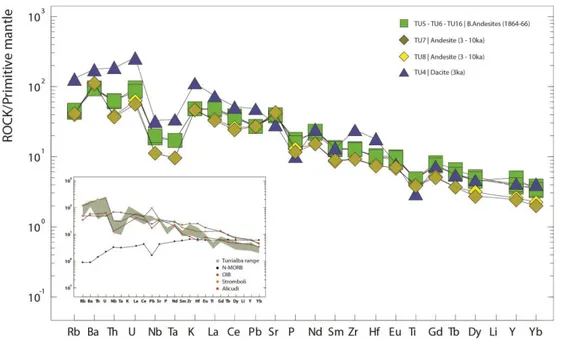
Mantle normalized (Sun and McDonough, 1989) incompatible trace element patterns of a representative suite of samples of Turrialba rocks are presented in Fig. 2.11. In the diagram, the elements are reported with degree of incompatibility increasing from right to left. The diagram shows a behavior typical of subduction-related magmas (e.g. Aeolian Island, see the inset in Fig.
2.11), as testified by the high concentrations of large-ion lithophile elements (LILE: i.e., Rb, Ba and
K), Th and U, light rare-earth elements (LREE), and Sr relative to HFSE, such as Nb, Ta, and Ti, and heavy rare-earth elements (HREE) with significant Nb, Ta and Ti negative anomalies and positive anomaly in K.
A moderate fractionation between the basaltic-andesites and dacites can be observed in the spider diagram with a slight enrichment in Rb, Th, Ba and U, that could be ascribed to a progressive evolution from mafic magmas to dacitic by fractional crystallization. In the diagram, the average composition of basalts from mid ocean ridge (MORB) and ocean island basalts (OIB) (Sun & McDonough, 1989) are also reported for comparison.
Fig. 2.11 – Mantle normalized trace elements patterns for Turrialba rocks. OIB and N-MORB average compositions
and normalization values are from Sun and McDonough (1989).The inset shows the comparison between the Turrialba
trace elements range (gray shaded), OIB and N-MORB magmas and two volcanic arc rocks: Alicudi and Stromboli. This two volcanoes represent respectively the most primitive and the most contaminated magma of the same volcanic
arc system (data from Francalanci et al., 1993). Normalization factors and data for OIB and N-MORB magmas from Sun and McDonough (1989).
As it can be observed from Fig. 2.11, the overall trace elements pattern indicates a more complex source for these magmas, with a clear contribution of a OIB component; for example, ratios
25
between HFS elements in the most mafic samples (e.g. Zr/Nb = 10.0 – 11.4; Nb/Ti = 0.0020 – 0.0022) are more similar to those of OIBs (Zr/Nb = 5.9 – 14.5; Nb/Ti = 0.0011 – 0.0027; Frei and Clague, 1983; Chey and Frey, 1985) than to normal MORBs (Zr/Nb = 27; Nb/Ti = 0.00033; Sun, 1980), as observed also by Reagan and Gill (1989).
Chondrite-normalized (Sun & McDonough, 1989; Fig. 2.12) REE patterns show similar trend for all the samples studied, with fractionation of light LREE (Lan/Smn= 3.6 – 5.4) and nearly horizontal
HREE, suggesting the absence of garnet at source. The LREE enrichment is between 40 - 100 in Turrialba basaltic-andesites and is in agreement with enrichment values observed for subduction-related magmas. The insets (Fig. 2.12) show the comparison between the patterns of Turrialba trace elements range (gray shaded), OIB and N-MORB magmas and two volcanic arc rocks: Alicudi and Stromboli (Italy). These two volcanoes represent respectively the most primitive and the most contaminated term of Aeolian volcanic arc (data from Francalanci et al., 1993). As we expect, Turrialba trace elements display many common features with an OIB source, showing similar characteristics with the Aeolian arc magmatism (e.g. Alicudi and Stromboli).
Fig. 2.12 – Chondrite-normalized REE patterns for the selected Turrialba samples, showing the typical trend of a subduction-related volcanic series. Normalization factors and data for OIB and N-MORB magmas from Sun and
26
2.4.5 Sr and Nd isotope geochemistry
Sr and Nd isotopic ratios have been measured on some selected Turrialba rocks at the University of Florence and are presented in Tab. 2.2. 87Sr/86Sr ratios show slight variations, ranging from 0.703593 to 0.703678. The Nd isotope ratios (143Nd/144Nd) display also minor variations, ranging between 0.512960 and 0.512968. Basaltic-andesites (TU5 – TU6 – TU16) and dacite (TU4) samples have slightly higher 87Sr/86Sr values (0.703678 - 0.703654), with respect to the andesite samples (TU7 – TU8 (0.703593 – 0.703621) (Fig. 2.13a). In other words, the highest values of radiogenic Sr have been found in the most mafic samples among the analyzed rocks, whereas high-K andesites products show lower Sr ratio. In the context of the Costa Rica volcanoes, Turrialba rocks have a poorly radiogenic isotopic signature (Fig. 2.13a), forming the less radiogenic end-member of an unusual positive trend between Sr and Nd isotope composition in Central America (Feigenson & Carr, 1986). The Central America volcanic arc displays a relatively small variation in Sr and Nd isotope composition respect to other volcanic arcs of the world (Fig. 2.13b), such as Banda volcanic arc or Aeolian Island arc where wide Sr and Nd isotopic variations has been observed.
Fig. 2.13 – a) Variation diagram of 87Sr/86Sr isotope ratio against 143Nd/144Nd for Central America Volcanic Belt. Data from Costa Rica, Nicaragua, El Salvador and Guatemala are from Geochemical Database by Carr et al., available online
at http://www.rci.rutgers.edu/~carr/ (DOI: 10.1594/IEDA/100263). b) Nd-Sr variation in some volcanic arc of the world, after Wilson (1989), Arculus and Powell (1986), Gill (1981), and McCulloch et al. (1994). Pacific sediments
data are from Hauff et al., 2003; Atlantic sediments data are from White et al. (1985). DM, HIMU, EMI and EMII values are from Lustrino & Dalli (2005).
27
2.5 Turrialba volcano in the geochemical framework of the volcanic front of Central America. As already observed in previous studies (e.g. Carr et al., 1990; Herrstrom et al., 1995; Patino et al., 2000), magma geochemistry of the Costa Rica subduction-related volcanoes is unusual both with respect to other volcanoes of the Central American Volcanic Front (CAVF) and to the compositional spectrum of the volcanic arcs magmatism on Earth. Magmas from the CAVF define regional and sometimes local geochemical trends, which reflect the variable influence of multiple mantle sources. The magmatic features vary from continental arc type, in Guatemala, to oceanic ones, in Nicaragua, and this suggests the influence of crustal contamination. The geochemical characteristics vary also along the volcanic front (e.g. Carr et al., 2003; Feigenson et al., 2004). Numerous mafic volcanics are found belonging to back-arc domains, unaffected by subduction-related fluids (e.g. Patino et al., 2000) and adakite magmatism can occurs in the southernmost termination of the arc. Regional variations are most clearly seen in element ratios that are nearly constant through the Cocos Plate sediment stratigraphy (Patino et al., 2000), suggesting that regional variations of these elements could be related to differences in intensity of the flux of the subducting slab. Isotopic data of Sr, Nd and Pb clearly reveal the influence of mixing trends between less and more radiogenic magmatic sources and crustal end-members. Turrialba volcano is located in this complex geological setting, lying in a key sector where significant geochemical and geodynamic variations occurred.
2.5.1 Bulk rock geochemistry insights: trace elements variations along the arc.
It has been observed that CAVF shows systematic variations in many geochemical tracers, which allow comparison with regions of high slab signal, to nearby regions of low slab signal (Carr et al., 1990; Morris et al., 1990; Leeman et al., 1994). For the study of the trace element variations along the arc, we selected the most mafic eruptive products of the arc (SiO2 < 54 wt %; MgO > 4 wt %)
from the “RU_CAGeochem” database (a free online database and sample repository for Central American volcanic rocks by Rutgers University). Ba/La ratio is appropriate for reviewing the regional variation in slab signal. The high Ba/La values observed in some regions along the CAVF are not surprising because the subducted sediments are highly enriched in Ba (Plank and Langimur, 1993; Patino et al., 2000). If plotted against latitude, the Ba/La ratio shows an asymmetrical chevron pattern (Fig.2.15a), with a peak in the contribution of sediment to the slab flux positioned in the central portion of the CAVF, in Nicaragua. By contrast, it falls nearly to the global minimum toward northwest and especially the southeast, in the terminal sector of the volcanic front that includes Turrialba. Indeed, Turrialba volcanic rocks display some of the lowest Ba/La ratios of the