SAPIENZA
UNIVERSITA’ DI ROMA
DOTTORATO DI RICERCA IN MEDICINA SPERIMENTALE
XXXII CICLO
“Performance of texture analysis in
predicting tumoral response to neoadjuvant
chemoradiotherapy in rectal cancer patients
studied with 3T MR”
DOTTORANDO
DOCENTE GUIDA
Dott. Davide Bellini
Prof. A. Laghi
COORDINATORE DEL DOTTORATO
Prof. Maurizio Sorice
Table of Contents
Introduction
Role of MRI in Rectal Cancer
5
Texture Analysis
17
Artificial Intelligence in Radiology
27
References
41
Experimental Study
Abstract
50
Background
51
Material and Methods
53
Results
58
Discussion
67
Role of MRI in Rectal Cancer
Rectal cancer—defined as cancer (usually adenocarcinoma) occurring in the distal 15 cm of the intestinal tract as measured to or from the anal verge—is one of the major causes of cancer-related mortality worldwide. Although imaging can be suggestive of the diagnosis of rectal cancer, particularly when obstruction hinders endoscopic access or biopsy fails, the primary role of imaging is to assist in treatment triage of histologically diagnosed tumors. Surgical resection with negative margins (i.e., no tumor extension within 1 mm of the resected margins on histology) is the only standard locally curative therapy for rectal cancer. Failure to attain negative margins (i.e., positive postoperative margins) often results in tumor recurrence and the possibility of incurable disease, a poor quality of life, and reduced disease-free survival.
The initial local staging is performed to determine which patients require preoperative chemoradiation therapy (CRT) or to plan surgery in those not requiring CRT with the in- tent to obtain a negative margin. For tumors in the upper two thirds of the rectum, the standard procedure is low anterior resection (LAR) with total mesorectal excision where the rectum (except the distal portion) and the surrounding mesorectum are removed. For tumors in the distal one third of the rectum, depending on local extension, sphincter- sparing surgeries (e.g., ultra-LAR or intersphincteric resection) or abdominoperineal resection (APR) surgeries are attempted. Post-CRT staging aims at assessing treatment response; knowing the post-CRT stage is important for selecting further treatment such as surgical resection or extended CRT.
Transrectal ultrasound (TRUS) is an accurate imaging modality for differentiating T1 from T2 tumors and is similar to MRI in differentiating T2 from T3 tumors. However, at higher disease stages, MRI is better than TRUS in the assessment of the tumoral border and mesorectal fascia (MRF), surrounding viscera, and pelvic nodes. In addition, dynamic contrast-enhanced (DCE) MRI can
disease. CT is not suitable for T staging of rectal cancer because of its lower contrast resolution, but it is the preferred modality for detecting distant metastasis, especially when combined with PET. Currently, MRI is the imaging modality of choice for the local evaluation of rectal cancer.
Rectal MRI Techniques
MRI performed at a higher field strength benefits from faster image acquisition, higher spatial resolution, and higher signal-to-noise ratio (SNR), which may improve the visibility of the rectal wall.
New pelvic phased-array multichannel coils provide high spatial resolution, high SNR, and larger-FOV imaging for visualization of the lateral pelvic structures and lymph nodes. Endorectal coils are not recommended. Bowel preparation is generally not necessary before the examination, but antispasmodic agents are useful for decreasing bowel peristalsis and resultant motion artifacts. Filling of the rectal lumen with gel or contrast material probably facilitates the detection of small tumors. However, compression of the mesorectal fat due to rectal distention may critically alter the staging because it leads to underestimation of the distance of the tumor to MRF and possibly to nonvisualization of the mesorectal nodes; therefore, the routine use of endorectal filling is not recommended.
The rectal MRI includes multiplanar conventional and high-resolution oblique T2-weighted and axial T1-weighted pulse sequences and multiparametric MRI sequences including diffusion-weighted imaging (DWI) and contrast-enhanced MRI. The mandatory part of this protocol is T2-weighted imaging; the other sequences are optional when the MRI examination must be shortened. A sidewall- to-sidewall sagittal T2-weighted sequence provides the initial images for localizing the tumor, and axial and coronal T2-weighted imaging should be performed in the same manner. Then, high-resolution oblique T2- weighted images with thin (3 mm) slices and a large matrix size (e.g., 320 × 320) should be obtained perpendicular to the tumoral axis in the sagittal view in one or more planes depending on the size and shape of the tumor. High-resolution oblique imaging provides the optimal anatomic information for an improved assessment of the depth of invasion and of tumoral
relationships especially anteriorly and in relation to the sphincter complex and levator muscle in patients with low rectal tumors. The use of T1-weighted imaging for rectal cancer staging is recommended mainly for the evaluation of coincidental findings and the pelvic bones. DWI may help in the assessment of response to CRT and may improve the accuracy of MRI for the detection of rectal cancers and involved pelvic nodes.
Currently there is no agreement regarding the role of gadolinium-enhanced MRI in patients with rectal cancer. However, it may improve the detection of tumors and malignant lymph nodes, in- crease the accuracy of MRI for diagnosing T3 tumors and locoregional extensions, and help in the assessment of treatment response after CRT. In addition, the DCE-MRI–derived quantitative parameters that represent the tumor microcirculation may help in the prediction of the status of the circumferential resection margin (CRM), the presence of metastases, and response to CRT. A recent meta-analysis showed that multiparametric MRI had a promising role in restaging of rectal cancer after preoperative CRT through a more accurate diagnosis of nodal disease and in predicting and detecting good treatment response. Contrast-enhanced MRI may also facilitate the assessment of extramural vascular invasion (EMVI) and T4 tumors and characterization of coexistent pelvic abnormalities.
MRI for Initial Staging of Rectal Cancer
MRI staging of rectal cancer comprises the assessment of tumor location and relationship to MRF and sphincters, tumor size, extent of extramural spread (T stage), peritoneal reflection, EMVI, lymph nodes, and bony metastasis.
For tumor localization, the distance of the lowest portion of the tumor from the anal verge is measured. A rectal tumor is characterized as low, middle, or high when its most caudal border is less than 5 cm from the anal verge, 5–10 cm from the anal verge, or more than 10 cm from the anal verge, respectively. In the lower parts of the rectum, the mesorectal fat surrounding the rectum is circumferentially bound by MRF. However, in higher portions, the peritoneum starts covering the
8
anterior peritoneal reflection, the peritoneum gradually extends posteriorly and finally encircles the rectosigmoid. The peritoneal reflection appears as a thin (1–2 mm) hypointense line on T2-weighted imaging that attaches the anterior aspect of the rectum and should be assessed in both the axial and sagittal planes. On sagittal images, the peritoneal reflection may be depicted above the tip of the seminal vesicles in men and at the uterocervical angle in women. The relationship of tumor to and invasion of the peritoneal reflection should be carefully reported. Low rectal cancers should be differentiated from anal squamous cell carcinomas before MRI interpretation; this distinction is possible only by histopathologic results and not by location and is important because the staging, behavior, and management of these entities are completely different.
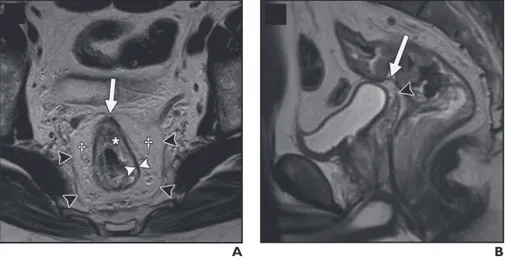
Figure 1—Rectal anatomy on MRI. A, Axial T2-weighted image in 65-year-old man shows muscularis propria as hypointense band (white arrowheads) between mesorectal fat and submucosa (asterisk). Mesorectal fascia is depicted as thin hypointense line (black arrowheads) surrounding mesorectal fat (daggers). Note peritoneal attachment to anterior aspect of rectum (arrow). B, Sagittal T2-weighted image in 52-year-old man shows peritoneal attachment (arrow) above tip of seminal vesicles (arrowhead). (From Furey E, Jhaveri KS. MRI in rectal cancer. Magn Reson Imaging Clin N Am 2014; 22:165–190, v–vi).
T Stage
On T2-weighted imaging, the muscularis propria appears as a hypointense line between the hyperintense mesorectal fat and the inner submucosa and mucosa, which show intermediate to mild hyperintensity (Figure 1).
The signal intensity of a rectal tumor on T2- weighted images is typically intermediate between the
MRI of Rectal Cancer
C
Fig. 1 (continued)—40-year-old woman with upper
rectal cancer. This case shows impact of high-resolution oblique T2-weighted imaging on T staging.
C, Thinner slices with plane (dotted lines)
perpendicular to axis of rectum and tumor (arrow) for high-resolution oblique imaging.
D, On high-resolution oblique T2-weighted image,
there is no invasion of uterus with visible fat plane (arrows) between rectal cancer and uterus.
D
A
Fig. 2—Rectal anatomy on MRI. (Reprinted from
[24] with permission: Furey E, Jhaveri KS. MRI in rectal cancer. Magn Reson Imaging Clin N Am 2014; 22:165–190, v–vi)
A, Axial T2-weighted image in 65-year-old man
shows muscularis propria as hypointense band (white arrowheads) between mesorectal fat and submucosa (asterisk). Mesorectal fascia is depicted as thin hypointense line (black arrowheads) surrounding mesorectal fat (daggers). Note peritoneal attachment to anterior aspect of rectum (arrow).
B, Sagittal T2-weighted image in 52-year-old man
shows peritoneal attachment (arrow) above tip of seminal vesicles (arrowhead).
B
A
Fig. 3—T3 rectal tumors on T2-weighted MR images. A, Low rectal tumor in 58-year-old man with tumoral
spiculations (intermediate signal intensity) of mesorectal fat (arrowheads).
B, Low rectal tumor in 63-year-old man with nodular
extension to mesorectal fat. Double-headed arrow shows shortest distance from most penetrating part of tumor and mesorectal fascia.
B (Fig. 3 continues on next page)
signal intensity of the muscularis propria and mucosa. Differentiation of T1 tumors from T2 tumors on MRI is usually not reliable without an endorectal coil, and tumors should be generally staged as “T1/T2.” A tumor is staged as T3 when it invades the mesorectal fat. Disruption of the muscularis propria because of the penetrating vessels should not be overstaged as T3. Spiculation of the mesorectal fat can be caused by either a benign desmoplastic reaction, seen as low signal intensity on weighted images (T2 tumor), or tumor extension, seen as intermediate signal intensity on T2-weighted images (early T3 tumor), and may not be easily differentiated from one another on MRI. For T3 tumors, the shortest distance between the most penetrating parts of the tumor and the MRF should be measured (Figure 2).
Fugure 2: T3 rectal tumors on T2-weighted MR images. A, Low rectal tumor in 58-year-old man with tumoral spiculations (intermediate signal intensity) of mesorectal fat (arrowheads). B, Low rectal tumor in 63-year-old man with nodular extension to mesorectal fat. Double-headed arrow shows shortest distance from most penetrating part of tumor and mesorectal fascia. (From Furey E, Jhaveri KS. MRI in rectal cancer. Magn Reson Imaging Clin N Am 2014; 22:165–190, v–vi).
The MRF is not circumferential at or above the peritoneal reflection and here it covers the posterior or posterolateral aspects of mesorectal fat of the rectum. The MRF is best visualized on T2-weighted images as a hypointense line surrounding the mesorectal fat especially at the proximal and posterior portions of the rectum where fat tissue is more abundant. A tumor–MRF distance of more than 1 mm is a reliable predictor for negative margins after total mesorectal excision. In the presence of satellite nodules, the shortest distance between the nodules and the MRF should also be reported.
AJR:205, July 2015 W51
MRI of Rectal Cancer
C
Fig. 1 (continued)—40-year-old woman with upper
rectal cancer. This case shows impact of high-resolution oblique T2-weighted imaging on T staging.
C, Thinner slices with plane (dotted lines)
perpendicular to axis of rectum and tumor (arrow) for high-resolution oblique imaging.
D, On high-resolution oblique T2-weighted image,
there is no invasion of uterus with visible fat plane (arrows) between rectal cancer and uterus.
D
A
Fig. 2—Rectal anatomy on MRI. (Reprinted from
[24] with permission: Furey E, Jhaveri KS. MRI in rectal cancer. Magn Reson Imaging Clin N Am 2014; 22:165–190, v–vi)
A, Axial T2-weighted image in 65-year-old man
shows muscularis propria as hypointense band (white arrowheads) between mesorectal fat and submucosa (asterisk). Mesorectal fascia is depicted as thin hypointense line (black arrowheads) surrounding mesorectal fat (daggers). Note peritoneal attachment to anterior aspect of rectum (arrow).
B, Sagittal T2-weighted image in 52-year-old man
shows peritoneal attachment (arrow) above tip of seminal vesicles (arrowhead).
B
A
Fig. 3—T3 rectal tumors on T2-weighted MR images. A, Low rectal tumor in 58-year-old man with tumoral
spiculations (intermediate signal intensity) of mesorectal fat (arrowheads).
B, Low rectal tumor in 63-year-old man with nodular
extension to mesorectal fat. Double-headed arrow shows shortest distance from most penetrating part of tumor and mesorectal fascia.
B (Fig. 3 continues on next page)
a prognostic factor. The American Joint Committee on Cancer suggested an optional stratification of T3 tumors based on the extramural depth of invasion: less than 5 mm, T3a; 5–10 mm, T3b; and more than 10 mm, T3c. An extramural depth of invasion of less than 5 mm confers a significantly higher survival rate, and these early T3 tumors may be adequately managed with surgery alone and have a prognosis comparable to that of tumors characterized as “T1/T2”.
If a tumor invades the visceral peritoneum, it is staged as T4a. Therefore, accurate depiction of the peritoneal reflection on MRI is crucial for proper staging of rectal tumors.
Tumors that invade other structures or adjacent organs are staged as T4b.
Particular attention should be paid for low rectal tumors. The surgical approach for low rectal tumors is more complex than for middle and high rectal tumors because of the thinner mesorectum and the presence of the surrounding sphincter complexes. The internal sphincter is a smooth-muscle ring formed by the inner (circular) muscle layer of the rec- tum. The external sphincter complex is a group of voluntary muscles in continuation of the levator muscles and consisting of the puborectalis and external sphincter muscles. Given the shape and anatomic location of the levator muscles, their accurate assessment in relation to the tumor is optimal through an evaluation of coronal and sagittal images.
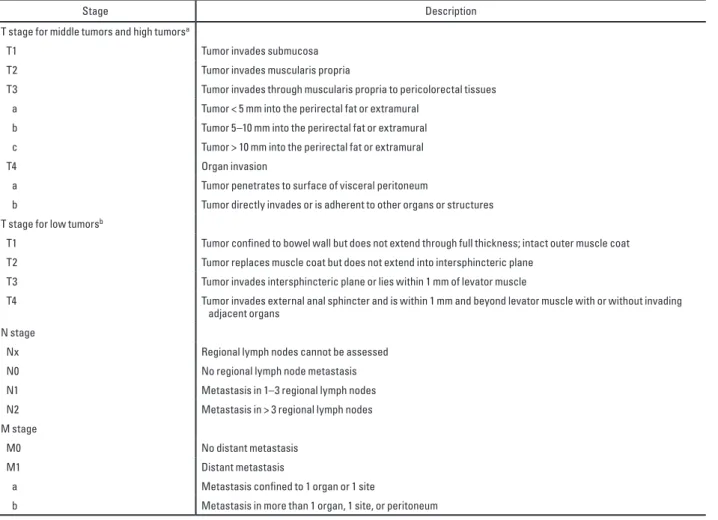
Low rectal tumors typically undergo standard LAR, intersphincteric resection, or APR. The proximity of the inferior border of the tumors to the top border of the anal sphincters accounts for the selection of sphincter-preservation surgery and should be measured for low rectal tumors. Accordingly, a staging system geared toward staging low rectal cancers has been devised (Table 1). Consideration should be given to assessing the lateral extent of the tumor in the perineum so that a wide APR can be planned to ensure negative margins. APR is required for advanced T2 tumors, T3 tumors, and high rectal tumors that involve the levator muscles. In patients with adjacent organ invasion, pelvic exenteration may be indicated.
Table 1: Rectal Cancer Staging
AJR:205, July 2015 W45
MRI of Rectal Cancer
for the differentiation of benign from ma-lignant nodes [49, 50]. Although metastatic nodes are generally larger than benign nodes, malignant disease may be present even in very small nodes. The most commonly advo-cated size cutoffs for the diagnosis of malig-nancy are in the range of 5–8 mm [7]; how-ever, adding morphologic features, such as irregular contour and mixed signal intensity, to a size cutoff increases the diagnostic ac-curacy [51] (Fig. 8). Craniocaudal localiza-tion and clock-face localizalocaliza-tion of suspicious lymph nodes relative to the tumor are neces-sary; for mesorectal nodes, the distance to the MRF should also be measured.
DWI has shown low to moderate sensitivity (67–78%) and specificity (60–67%) for detect-ing involved lymph nodes [52, 53]. Although
the combination of DWI with T2-weighted im-aging has improved identification of metastatic lymph nodes in pelvic cancers [26], this com-bination is not considered reliable for the dif-ferentiation of benign from malignant lymph nodes in patients with rectal cancer [7].
MRI with lymph node–specific contrast agents has shown good diagnostic perfor-mance for the characterization of lymph nodes. Ultrasmall superparamagnetic iron oxide (USPIO) is an iron-based nanoparti-cle that is taken up by normal cells and de-creases the signal intensity of normal cells on T2- and T2*-weighted imaging; as a re-sult, malignant nodes, which do not uptake USPIO particles, look brighter than benign nodes and enhance relative to normal tissues. The intensity and pattern of USPIO uptake,
or lack thereof, have been shown to have moderate to high accuracy (sensitivity, 60– 100%; specificity, 91–94%) for identifying malignant lymph nodes [54, 55]. Currently, the only U.S. Food and Drug Administra-tion–approved and commercially available USPIO is ferumoxytol [56].
Gadofosveset is a gadolinium chelate that reversibly binds to albumin and exhibits a long intravascular half-life [57]. Normal or reactive lymph nodes uptake gadofosveset and enhance like vessels, but nodes with ma-lignant infiltration show less enhancement with promising results [58]. However, the in-terpretation of these findings for nodes in the superior mesorectum or those in the vicini-ty of vessels is challenging, and the presence of micrometastases cannot be ruled out [29]. TABLE 2: Staging Systems for Rectal Cancer
Stage Description
T stage for middle tumors and high tumorsa
T1 Tumor invades submucosa
T2 Tumor invades muscularis propria
T3 Tumor invades through muscularis propria to pericolorectal tissues a Tumor < 5 mm into the perirectal fat or extramural
b Tumor 5–10 mm into the perirectal fat or extramural c Tumor > 10 mm into the perirectal fat or extramural
T4 Organ invasion
a Tumor penetrates to surface of visceral peritoneum
b Tumor directly invades or is adherent to other organs or structures T stage for low tumorsb
T1 Tumor confined to bowel wall but does not extend through full thickness; intact outer muscle coat T2 Tumor replaces muscle coat but does not extend into intersphincteric plane
T3 Tumor invades intersphincteric plane or lies within 1 mm of levator muscle
T4 Tumor invades external anal sphincter and is within 1 mm and beyond levator muscle with or without invading adjacent organs
N stage
Nx Regional lymph nodes cannot be assessed N0 No regional lymph node metastasis N1 Metastasis in 1–3 regional lymph nodes N2 Metastasis in > 3 regional lymph nodes M stage
M0 No distant metastasis
M1 Distant metastasis
a Metastasis confined to 1 organ or 1 site
b Metastasis in more than 1 organ, 1 site, or peritoneum
Note—aAdapted from a Radiological Society of North America (RSNA) Radiology Reporting Template developed at the RSNA by the RSNA Radiology Reporting Committee and its subspecialty subcommittees and provided under license from RSNA [94]: Radiological Society of North America website. Hussain S, et al. MR rectum cancer. www.radreport.org/template/0000068. Published December 1, 2009. Updated July 16, 2012)
bAdapted from [40]: Taylor FG, Swift RI, Blomqvist L, Brown G. A systematic approach to the interpretation of preoperative staging MRI for rectal cancer. AJR 2008; 191:1827–1835.
N Stage
The extent of nodal disease is important for both choosing and planning preoperative CRT and surgery. In the TNM system, disease involving only the regional nodes, including the mesorectal and internal iliac nodes, accounts for the N stage; involvement of other nodes is regarded as metastasis (Table 1). Mesorectal nodes are often the first and the most common group of nodes that are involved. Nodal metastases are usually within the proximal 5 cm of the tumor. Extramesorectal nodes are generally involved in locally advanced cancers. Inguinal nodal metastases, which are more typical of anal cancer than of rectal cancer, are uncommon even in low rectal cancers and imply poor prognosis.
Currently, size (i.e., short axis) and morphologic criteria are used with variable sensitivities (56–94%) and specificities (67–83%) for the differentiation of benign from malignant nodes. Although metastatic nodes are generally larger than benign nodes, malignant disease may be present even in very small nodes. The most commonly advocated size cutoffs for the diagnosis of malignancy are in the range of 5–8 mm; how- ever, adding morphologic features, such as irregular contour and mixed signal intensity, to a size cutoff increases the diagnostic accuracy. Craniocaudal localization and clock-face localization of suspicious lymph nodes relative to the tumor are necessary; for mesorectal nodes, the distance to the MRF should also be measured.
DWI has shown low to moderate sensitivity (67–78%) and specificity (60–67%) for detecting involved lymph nodes.
FDG PET has high specificity (85–95%) for the identification of malignant nodes, but its role in nodal staging is limited because of low sensitivity (29–63%) and the inability to accurately localize the involved nodes. FDG PET is more suitable for the assessment of extramesorectal nodes because high uptake of tracer by the primary tumor may prevent the visualization of mesorectal nodes. Application of CT with PET improves the ability of the modality for anatomic localization. PET/CT has shown 63– 70% accuracy for the detection of regional lymph node metastasis, and the combination of high-resolution MRI with PET/CT increases the accuracy up to 90%.
Extramural Vascular Invasion
EMVI refers to the extension of rectal tumor into the veins beyond the muscularis propria and can be detected on MRI with moderate sensitivity and high specificity by visualizing the vessels close to the tumor; EMVI is suggested when vessels close to the tumor are obviously irregular or expanded by tumoral signal intensity. EMVI has been accepted as an independent prognostic indicator in colorectal cancer that is associated with a higher incidence of metastasis, local recurrence, poorer response to preoperative CRT, and overall lower survival rate.
EMVI assessment is not included in the TNM staging system. However, EMVI status on initial MRI staging has been suggested by some studies as a prognostic factor for the stratification of patients for selecting the appropriate treatment, especially for indicating adjuvant therapy and its intensity.
Assessment of Response
Preoperative neoadjuvant CRT has improved the survival of patients possibly by increasing the CRM-negative resections. In addition, it may enable sphincter- preserving resection in patients with low rectal tumors through downstaging of locally advanced disease. The post-CRT restaging MRI examination is performed with the intent to, again, ensure negative margins, select patients with preexisting morbidities for local or less radical excision, and reassess patients for interval development of metastasis and extramesorectal lymphadenopathy. Tumor restaging involves correlating the posttreatment images with the pretreatment images with respect to all the elements assessed in the initial staging and necessitates image acquisition with almost the same protocol and on the same planes .
One of the most important parameters in restaging is reassessment of the MRF. MRI has shown approximately 76% sensitivity and 86% specificity for the assessment of the MRF in the irradiated pelvis. However, the accuracy of MRI for restaging is generally lower than the accuracy of MRI for initial staging mainly owing to overstaging of nodal disease, failure to differentiate tumoral infiltration or residual tumor from desmoplastic reaction or radiation fibrosis, and misinterpretation
MRI is also considerably challenging because these tumors remain hyperintense on T2-weighted imaging regardless of their response to treatment.
Although MRI restaging of rectal cancer with the conventional protocol is based on morphologic findings and changes in anatomic measurements, DWI and DCE-MRI may potentially provide functional information that can be correlated with changes at the cellular level in response to treatment. After CRT, the decrease in cellularity and the development of fibrosis or necrosis in responders result in an increase in diffusion and increase in the ADC value. A recent meta-analysis has shown that DWI is more sensitive than (62–94%) and is almost as specific as (74–91%) conventional MRI in restaging rectal tumors after CRT (van der Paardt et al. Radiology 2013). The persistence of EMVI after CRT can be detected on MRI and, regardless of the final pathologic staging, may predict a higher risk of metastatic disease and an overall shorter disease-free survival. Therefore, EMVI status after CRT may possibly be used as an imaging biomarker for counseling patients for postoperative chemotherapy or more intensive surveillance.
Overall, the diagnostic performance of MRI for restaging rectal cancer after CRT is heterogeneous. Although adding the multiparametric sequences may partly improve MRI accuracy, issues with nodal staging still exist.
Changes in cellular viability and metabolic activity after CRT can be depicted on PET and can be interpreted as a response to treatment. PET has a high diagnostic performance for the interim assessment of response (sensitivity and specificity ≈ 80%) but is less specific in post-CRT response assessment (≈ 60%) and is less sensitive in the evaluation of mucinous tumors (≈ 50%), which uptake less tracer because of their lower cellular density.
Locoregional Recurrence
The incidence of recurrent rectal cancer has started declining in the most recent 2 decades because of the advent of adjuvant CRT and improvements in surgery. Pelvic recurrence occurs in approximately 4–8% of patients who undergo surgery performed with a curative intent, and most cases of pelvic recurrence are seen within the first 3 years after treatment. The risk factors for local
recurrence include CRM positivity, no preoperative radiotherapy, EMVI, perforation of the tumor at surgery, and close proximity of the tumor to the anal verge.
Most intraluminal recurrent tumors are diagnosed by either rectal examination or direct visualization on rectosigmoidoscopy; however, detection of extraluminal recurrence and differentiating extraluminal recurrence from postoperative changes may be possible only on imaging. MRI is the most accurate imaging modality for the evaluation of these patients, but its cost has limited its use for routine follow-up. Annual pelvic CT is included in some guidelines for the surveillance of patients after surgical resection of rectal cancer. In other centers, pelvic imaging is performed only in the presence of suggestive clinical or laboratory findings (e.g., elevated serum carcinoembryonic antigen value).
Although T2-weighted imaging is considered the main sequence for the initial staging of rectal cancer, it is not specific enough for the assessment of recurrence. On T2-weighted images, recurring tumor appears hyperintense and is not distinguishable from inflammation or edema, which may persist for a few months after radiotherapy or surgery. On the other hand, fibrotic tissue may appear homogeneously hypointense on T2- weighted imaging while containing microscopic tumoral foci. Currently, the most accurate MRI sequence for the differentiation of treatment-related changes from recurrent rectal cancer is contrast-enhanced imaging. Enhancement in tumoral tissue has been shown to occur earlier and to be more intense and heterogeneous than enhancement in benign posttreatment fibrosis. Besides its high diagnostic performance for the identification of distant metastatic disease in recurrent rectal cancer (sensitivity, 91%; specificity, 83%), PET/CT has also shown high sensitivity (89–94%) and variable specificity (69–94%) for diagnosing the local recurrence on the basis of the shape, location, and intensity of tracer uptake [88–90]. Biopsy is indicated whenever imaging or clinical findings are equivocal and the diagnosis of recurrent disease cannot be confirmed.
Surgical resection with negative margins is established as the most efficient treatment for longer survival in recurrent rectal cancer. However, assessment of local extension to adjacent structures is
In this setting, local invasion can be suggested only when anatomic destruction or tumoral signal intensity is seen in the adjacent tis- sue. Detection of sacral invasion is crucial for achieving a clear posterior margin after resection. Whether radical exenterative surgery is a treatment option partly depends on the level of sacral involvement. In most institutions, invasion above the S2–S3 junction is a relative contraindication to resection, although high sacrectomy is also practiced in some centers.
Conclusion
MRI is the modality of choice for staging rectal cancer to assist surgeons in obtaining negative surgical margins. MRI facilitates the accurate assessment of MRF and the sphincter complex for surgical planning. Multiparametric MRI may also help in the prediction and estimation of response to treatment and in the detection of recurrent disease.
Texture Analysis
There has been growing interest in quantitative imaging biomarkers in recent years, particularly in the evaluation of tumors and cancer response to therapy. However, as our knowledge of the molecular signatures of different tumor types improves and therapies become increasingly varied and individualized, characterization of tumor and assessment of response to therapy become increasingly complex and in many cases need to be tailored to the specific tumor and therapy type. As a result, a profusion of imaging biomarkers have emerged using advanced imaging techniques, many of which are still being validated.
Tumors are heterogeneous on the gross and cellular levels, as well as the genetic and phenotypic levels, with spatial heterogeneity in cellular density, angiogenesis, and necrosis. This heterogeneity may affect prognosis and treatment, as more heterogeneous tumors may be associated with more biologically aggressive behavior and increased resistance to treatment.
Tumor heterogeneity can be difficult to capture and quantify with traditional imaging tools, subjective assessment of images, or random sampling biopsy, which evaluates only a small part of the tumor. Therefore, although it is not a new tool, there is renewed interest in computed tomographic (CT) texture analysis (CTTA), a potentially useful biomarker that allows assessment and quantification of tumor spatial heterogeneity. CTTA is just one part of the growing field of radiomics, which comprises high-throughput extraction, analysis, and interpretation of quantitative features from medical images.
CTTA has shown promise in a variety of tumor types, including colorectal cancer, head and neck cancer, esophageal cancer, lung cancer, and renal cell carcinoma (RCC), in predicting pathologic features, response to therapy, and prognosis. In addition, data are emerging to show that CTTA may have utility in a variety of nononcologic applications, including assessment and quantification of hepatic fibrosis, pulmonary fibrosis, interstitial pneumonia, and emphysema. However, there are a
variety of unknowns, challenges, and limitations related to CTTA that require further investigation before this potentially valuable tool is ready for mainstream application.
The purpose of this chapter is to review the basic concepts of texture analysis, describe oncologic and potential nononcologic applications of CTTA, evaluate histopathologic correlation with individual CTTA parameters, and discuss unknowns, limitations, and challenges around CTTA.
Basic Concepts of Texture Analysis
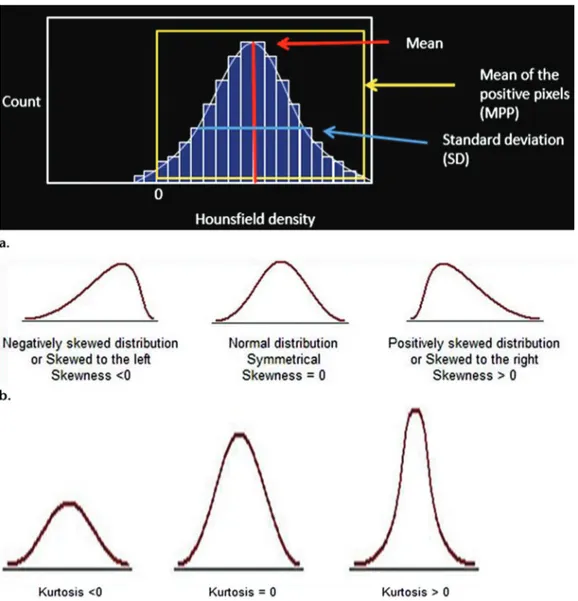
Texture analysis provides an objective, quantitative assessment of tumor heterogeneity by analyzing the distribution and relationship of pixel or voxel gray levels in the image. Different methods of texture analysis have been applied, including statistical-, model-, and transform-based methods. Statistical-based techniques have been most commonly applied, either through commercially available or inhouse software tools, to describe the relationship of gray-level values in the image. In a statistical-based model, first-order statistics evaluate the gray-level frequency distribution from the pixel intensity histogram in a given area of interest, including mean intensity, threshold (percentage of pixels within a specified range), entropy (irregularity), standard deviation, skew- ness (asymmetry), and kurtosis (peakedness/ flatness of pixel histogram) (Fig 1).
First-order histogram analysis does not account for the location of the pixels and lacks any reference to the spatial interrelationship between gray values.
Second-order statistics can be based on a co-occurrence matrix and include things like second-order entropy, energy, homogeneity, dissimilarity, and correlation. Second-order statistics can also be derived using a run-length matrix, which analyzes texture in a specific direction. Higher- order statistics, such as contrast, coarseness, and busyness, can be calculated using neighborhood gray-tone difference matrices, which examine location and relationships between three or more pixels. Higher-order features have the advantage of evaluating voxels in their local context, taking the relationship with neighboring voxels into account.
Figure 1: First-order statistical-based CT texture parameters. (a) Plot of the pixel histogram, where the x-axis represents gray-level values or attenuation and the y-axis represents the frequency of occurrence. First-order parameters include mean or mean gray-level intensity of the histogram (vertical red line), standard deviation of the histogram (horizontal blue line), and mean of the positive pixels (MPP) (average gray-level intensity above threshold of zero) (yellow box). (b) Sample histograms show skewness, which is negative when skewed values are less than zero (left) and positive when skewed values are greater than zero (right). (c) Sample histograms show kurtosis, which describes the peakedness or pointiness of the pixel histogram. A pointier or more peaked histogram is seen with positive and progressively higher kurtosis values (right). From Lubern et al, Radiographics 2017.
To perform CTTA, postprocessing software is needed, which can be either a commercially available tool or an in-house design, most of which are CT vendor neutral. This can be performed retrospectively on images obtained in the same phase of contrast enhancement with similar technique; in general, no prospective acquisition is needed. CTTA can be performed on either single-section (eg, largest cross-single-sectional area) or volumetric datasets to assess tumor heterogeneity.
the same phase of contrast enhancement with similar technique; in general, no prospective ac-quisition is needed. CTTA can be performed on either single-section (eg, largest cross-sectional area) or volumetric datasets to assess tumor heterogeneity (15).
An optional image filtration step can be performed. There are a wide variety of imag-ing filtration methods. A Laplacian or Gaussian bandpass filter is a commonly used advanced image filtration method that alters the image pixel intensity patterns and allows extraction of specific structures corresponding to the width of the filter. Lower filter values correspond to fine analyzes texture in a specific direction.
Higher-order statistics, such as contrast, coarseness, and busyness, can be calculated using neighborhood gray-tone difference matrices, which examine location and relationships between three or more pixels (Table 1). Higher-order features have the advantage of evaluating voxels in their local context, taking the relationship with neighboring voxels into account (Fig 3) (3).
To perform CTTA, postprocessing software is needed, which can be either a commercially available tool or an in-house design, most of which are CT vendor neutral. This can be per-formed retrospectively on images obtained in
Figure 2. First-order statistical-based CT texture parameters. (a) Plot of the pixel histogram, where the x-axis represents gray-level values or attenuation and the y-axis represents the frequency of occurrence. First-order parameters include mean or mean gray-level intensity of the histogram (vertical red line), standard deviation of the histogram (horizontal blue line), and mean of the positive pixels (MPP) (average gray-level intensity above threshold of zero) (yellow box). (b) Sample histograms show skewness, which is negative when skewed values are less than zero (left) and positive when skewed values are greater than zero (right). (c) Sample histograms show kurtosis, which describes the peakedness or pointiness of the pixel histogram. A pointier or more peaked histogram is seen with positive and progressively higher kurtosis values (right).
An optional image filtration step can be performed. There are a wide variety of imaging filtration methods. A Laplacian or Gaussian bandpass filter is a commonly used advanced image filtration method that alters the image pixel intensity patterns and allows extraction of specific structures corresponding to the width of the filter. Lower filter values correspond to fine texture features, while higher filter values emphasize medium or coarse texture features. In addition, this filtration step is designed to remove noise and enhance edges, which may make measurements less susceptible to small differences in technique. Denoising or gray-level standardization steps have been used as well as a premeasurement step to help eliminate differences that are technical rather than biologic and to aid in reproducibility.
Model-based texture analysis uses advanced mathematical methods such as fractal analysis, while transform-based methods convert spatial information into frequency and/or scale (wavelet) information.
At CT, there has been some concern that heterogeneity related to technique (photon noise) may mask underlying true biologic heterogeneity, but studies have demonstrated that texture analysis at CT is feasible by reducing the effect of photon noise using image filtration. Other studies have shown that some but not all texture features applied to unfiltered or filtered images have high interobserver agreement.
Oncologic Applications
Potential oncologic applications of CTTA remain an active area of research. These applications seem to fall into three main categories: lesion characterization, pretreatment assessment (of both primary tumors and metastatic disease), and initial posttreatment assessment in reference to baseline tumor heterogeneity to predict therapeutic response.
Lesion Characterization
A major diagnostic challenge is to accurately differentiate benign from malignant lesions using noninvasive methods. For a variety of tumors, there are quantifiable texture differences between benign and malignant lesions (generally with greater heterogeneity in malignant lesions), possibly
allowing pathologic differentiation in certain clinical scenarios. CTTA has the potential to function as a “virtual biopsy” of indeterminate masses.
Numerous organs ad lesions have been evaluated using texture analysis. CTTA has been used to differentiate renal cysts, oncocytomas, clear cell RCC, and papillary RCC with good diagnostic accuracy. Several groups have evaluated the utility of CTTA in differentiating lipid-poor angiomyolipomas (AMLs) from RCC.
Another important imaging task is differentiating benign from malignant portal vein thrombus. Texture features performed better than mean Hounsfield unit attenuation alone (AUC = 0.91) and radiologists’ subjective interpretation (AUC = 0.61). Another group looked at use of CTTA in differentiating hypervascular liver lesions including focal nodular hyperplasia, hepatic adenomas, and hepatocellular carcinoma. Using a random forest model, they were able to differentiate these lesion types. Predicted classification performance ac- curacy was 91.2% for adenoma, 94.4% for focal nodular hyperplasia, and 98.6% for hepatocellular carcinoma.
CTTA was used to differentiate pathologically proven intraductal papillary mucinous neoplasms (IPMNs) with high-grade dysplasia (n = 34) from those with low-grade dysplasia (n = 19). CTTA performed better in identifying lesions with high- grade dysplasia (higher risk for developing malignancy) than did use of imaging features based on the Fukuoka criteria.
The best texture feature had an AUC of 0.82, with sensitivity of 85% and specificity of 68% at the optimum threshold. The best logistic regression model had an AUC of 0.96, sensitivity of 97%, and specificity of 88%. Use of the Fukuoka criteria had a false-positive rate of 36%.
Multiple studies have evaluated the utility of CTTA in assessing colorectal polyps, which can have a variety of underlying histopathologic features, as well as a spectrum of biologic behavior. Traditionally, colonic polyps have been assessed using size and morphologic features (eg, flat versus nonflat). In a study of 384 polyps, CT texture features had an AUC of 0.80 for differentiating neoplastic from nonneoplastic polyps.
CTTA has also been applied to differentiating benign from malignant entities in the chest. It has been used to differentiate benign from malignant pulmonary nodules and mediastinal lymph nodes and to differentiate radiation fibrosis from recurrent lung cancer.
A summary of studies on lesion characterization with CTTA is presented in Table 1
Table 1: Studies investigating lesions characterization with CTTA, from Lubernt et al. Radiographics 2017.
radiographics.rsna.org
Table 2: Lesion Characterization with CTTA
Study and
Reference Organ Lesion Type and Number Imaging Technique 2D versus 3D Imaging Texture Measure Statistical Correction or Validation Comments Raman et
al (20) Kidney Renal cyst (20), onco-cytoma (20), ccRCC (20), pRCC (20)
CECT (renal mass protocol): arterial, venous, delayed Multiple sec-tions (maxi-mum = 10) GLH (TexRAD,
Cam-bridge, England) RFM, external valida-tion in 19 cases, OOB error calculation
RFM classification: cyst 100%, oncocytoma 89%, ccRCC 91%, pRCC 100%
Yan et al
(21) Kidney FP AML (18), ccRCC (18), pRCC (14) Nonenhanced CT, CECT (CMP, NP); gray-level normaliza-tion
One to four
sections GLH, RLM, GLCM, gradient, autoregres-sive model, wavelet (MaZda)
No Histogram and GLCM features: excellent clas-sification of FP AML vs ccRCC, ccRCC vs pRCC, FP AML vs pRCC; better than subjec-tive analysis Hogdon et al (22) Kidney FP AML (16), RCC (84) (51 ccRCC, 20 chRCC, 13 pRCC pooled) Nonenhanced CT, scan-ner vendor heteroge-neity, image intensity normalization Three sections GLH, GLCM, RLM (MaZda, Technical University of Lodz, Poland) 10-fold cross-valida-tion, Holm-Bonfer-roni procedure
Low homogeneity and high entropy in RCC; CTTA accuracy 83%–91%, better than subjec-tive assessment; AUC 0.85–0.89; reproducibility of contour (inter-, intra-); reproducibility of measures (CT1 vs CT2)
Takahashi et al (23)
Kidney AML (38), RCC (83) Nonenhanced CT Two sections (single-sec-tion small lesions) GLH (Matlab, Math-Works, Natick, Mass)
No Six or more pixels < −30 HU and skewness < −0.4 in 20 of 38 AMLs vs one of 83 RCCs; slightly better than subjective analysis (52% sensitivity, 99% specificity)
Leng et al
(24) Kidney 158 SRMs (<4 cm): ccRCC (98), pRCC (36), AML (24)
CECT ± denoising
algorithm Single section GLH: SD, entropy, uniformity (Matlab) No ccRCC more heterogeneous (ccRCC vs pRCC AUC 0.91, 0.81, 0.78, 0.78 for subjective analysis/SD/entropy/uniformity); no difference between pRCC and AML; slight improvement in ccRCC vs pRCC AUC with weak denoising Canellas
et al (25)
Liver 117 PVTs (63 malignant,
54 bland) CECT (portal venous) Single section GLH (TexRAD) No MPP (AUC 0.97), entropy (AUC 0.93), com-bined (AUC 0.99), attenuation (AUC 0.91) all better than subjective analysis (AUC 0.61) Hanania
et al (27)
Pancreas 53 IPMNs (34 HG, 19
LG) CECT Not reported GLCM Cross-validation Best single-marker AUC 0.82 for LG vs HG, best logistic regression AUC 0.96, better than use of Fukuoka criteria
Hu et al
(28) Colon 384 CR polyps Nonenhanced CT (CTC) Volume Intensity, gradient, curvature, GLCM Training/testing dataset, OOB error calculation
RFM AUC 0.80 for differentiating neoplastic from nonneoplastic polyps
Song et al
(29) Colon 148 total: 35 nonneoplas-tic, 72 TAs, 36 TVAs, five adenomas
Nonenhanced CT
(CTC) Volume Intensity, gradient, curvature, GLCM SVM model, training and test set AUC 0.74 for differentiating polyps on the basis of image intensity alone, improved to 0.85 when texture features added
Pooler et
al (30) Colon 63 CR masses ≥ 3 cm (32 adenocarcinomas, 31 adenomas)
Nonenhanced CT
(CTC) Volume Intensity, gradient, curvature, GLCM Previously established RFM method CTTA AUC 0.936, better than human readers’ AUC of 0.917 Note.—AML = angiomyolipoma, ccRCC = clear cell RCC, CECT = contrast-enhanced CT, chRCC = chromophobe RCC, CMP = corticomedullary phase, CR = colorectal, CTC = CT colo-nography, FP = fat-poor, GLCM = gray-level co-occurrence matrix, GLH = gray-level histogram, HG = high grade, IPMN = intraductal papillary mucinous neoplasm, LG = low grade, NP = nephrographic phase, OOB = out-of-bag, pRCC = papillary RCC, PVT = portal vein thrombus, RFM = random forest model, RLM = run-length matrix, SD = standard deviation, SRM = small renal mass, SVM = support vector machine, TA = tubular adenoma, TVA = tubulovillous adenoma, 3D = three-dimensional, 2D = two-dimensional.
Primary Tumor Assessment
There is a growing body of literature evaluating the biology of tumors before treatment (Table 2). CTTA features are associated with histopathologic features and clinical outcomes in a variety of primary and metastatic tumors. In general, a change in tumor heterogeneity (either increased or decreased) may be associated with treatment response and improved prognosis/outcome. These data suggest that texture features may be useful in treatment planning and prognostication.
One study evaluated 157 patients with a large RCC (>7 cm) and found that texture features including entropy, standard deviation, and MPP were associated with histologic subtype (clear cell, papillary, chromophobe) and nuclear grade. Those same texture features were associated with time to recurrence and overall survival. In another study, kurtosis was associated with neovascularity (CD135/CD31) and Ki-67 in small renal masses (Scrima et al, 2016).
Zhang et al (Zhang et al, 2017) evaluated 105 patients with urothelial carcinomas (106 high grade, 18 low grade). They found that low-grade tumors were less heterogeneous, with significantly lower mean gray-level intensity, entropy, and MPP than high- grade tumors. MPP less than 24.1 on nonenhanced images was the optimal texture parameter for differentiating high-grade from low-grade tumors, with AUC of 0.78, sensitivity of 72%, and specificity of 85%.
Sandrasegaran et al (Sandrasegaran et al, 2017) used CTTA to assess 60 patients with nonmetastatic pancreatic ductal adenocarcinoma before treatment. They found that low kurtosis correlated with poor overall survival and that higher MPP (threshold of >29.4) was associated with better progression-free survival.
A study of 59 patients with pancreatic neuroendocrine tumors (PNETs) found that CTTA parameters including mean attenuation, MPP, skewness, kurtosis, and entropy allowed distinction between low-grade and high-grade PNETs (AUC ranging from 0.75 to 0.85 for different levels of filtration, all P < .001) (Canellas et al, 2016).
CTTA has been found to be useful in imaging assessment of hepatocellular carcinoma (HCC). One study evaluated 130 large HCCs (>5 cm) treated with liver resection (n = 86) or transarterial
chemoembolization (TACE) (n = 44) and found that texture features could be used to predict overall survival and may be useful in making treatment decisions (surgery vs embolization) (Li et al, 2016).
Studies have evaluated the value of CTTA in esophageal, gastric, and colonic cancers. Ganeshan et al (45) evaluated 21 patients with esophageal cancer using nonenhanced CT images with texture analysis and positron emission tomography (PET) standardized uptake values (SUVs) and found that tumor heterogeneity correlated with fluorodeoxyglucose (FDG) uptake, SUVmax, and SUVmean. Heterogeneity was greater in patients with clinical stage III or IV disease (entropy, uniformity) and was an independent predictor of survival.
Multiple studies have evaluated use of CTTA features in identifying KRAS mutations in colorectal cancer. About 30%–40% of colon cancers exhibit a KRAS mutation, which is clinically significant because colorectal cancers bearing a KRAS mutation are resistant to drugs targeted against epidermal growth factor receptors (EGFRs). CTTA has shown some association with KRAS status, although limited data are available to date. MPP was used in combination with fluorodeoxyglucose uptake and CT perfusion to identify KRAS mutants and to categorize their phenotype (hypoxic vs proliferative).
Multiple studies have evaluated pretreatment assessment of lung cancer, particularly non– small cell lung cancer (NSCLC). Some of these studies included more detailed analyses of histopathologic correlates underlying certain texture features, and several studies have suggested that texture features may be related to the tumor microenvironment and the presence of features such as hypoxia and angiogenesis.
In a study of 45 patients with Hodgkin lymphoma (n = 18) and high-grade non-Hodgkin lymphoma (n = 27), CT texture features were associated with interim PET response and progression-free survival (Ganeshan et al, 2016).
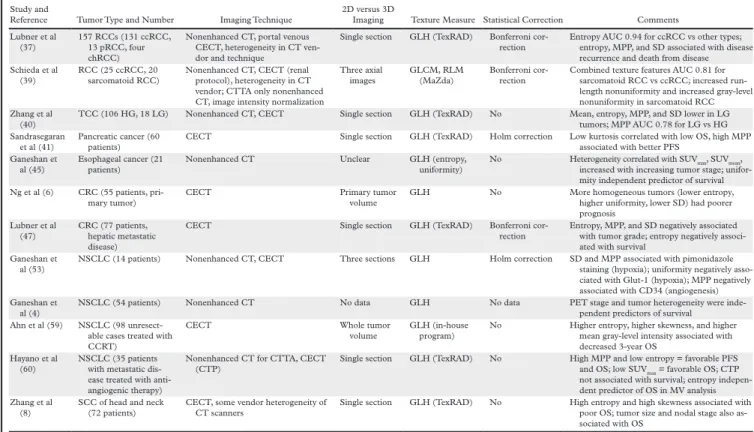
Table 2: Pretreatment assessment with CTTA, from Lubernt et al. Radiographics 2017.
Response to Therapy
Multiple studies have investigated use of CTTA as an adjunct to conventional imaging findings, like size or CT attenuation, to determine the response of tumors to therapy. CTTA features are associated with histopathologic features and clinical outcomes in a variety of primary and metastatic tumors. In general, a change in tumor heterogeneity (either increased or decreased) may be associated with treatment response and improved prognosis/outcome.
Smith and coworkers studied 42 patients with melanoma being treated with antiangiogenic therapy who had stable disease according to the Response Evaluation Criteria in Solid Tumors (RECIST) (Smith AD et al. AJR 2015). Absolute change in MPP, change in tumor size, and baseline lactate dehydrogenase level were predictors of overall survival. A prognostic index incorporating these
Table 3: Pretreatment Assessment with CTTA
Study and
Reference Tumor Type and Number Imaging Technique 2D versus 3D Imaging Texture Measure Statistical Correction Comments Lubner et al
(37)
157 RCCs (131 ccRCC, 13 pRCC, four chRCC)
Nonenhanced CT, portal venous CECT, heterogeneity in CT ven-dor and technique
Single section GLH (TexRAD) Bonferroni cor-rection
Entropy AUC 0.94 for ccRCC vs other types; entropy, MPP, and SD associated with disease recurrence and death from disease Schieda et al
(39) RCC (25 ccRCC, 20 sarcomatoid RCC) Nonenhanced CT, CECT (renal protocol), heterogeneity in CT vendor; CTTA only nonenhanced CT, image intensity normalization
Three axial
images GLCM, RLM (MaZda) Bonferroni cor-rection Combined texture features AUC 0.81 for sarcomatoid RCC vs ccRCC; increased run-length nonuniformity and increased gray-level nonuniformity in sarcomatoid RCC Zhang et al
(40)
TCC (106 HG, 18 LG) Nonenhanced CT, CECT Single section GLH (TexRAD) No Mean, entropy, MPP, and SD lower in LG tumors; MPP AUC 0.78 for LG vs HG Sandrasegaran
et al (41)
Pancreatic cancer (60 patients)
CECT Single section GLH (TexRAD) Holm correction Low kurtosis correlated with low OS, high MPP associated with better PFS
Ganeshan et
al (45) Esophageal cancer (21 patients) Nonenhanced CT Unclear GLH (entropy, uniformity) No Heterogeneity correlated with SUVincreased with increasing tumor stage; unifor-max, SUVmean, mity independent predictor of survival Ng et al (6) CRC (55 patients,
pri-mary tumor) CECT Primary tumor volume GLH No More homogeneous tumors (lower entropy, higher uniformity, lower SD) had poorer prognosis Lubner et al (47) CRC (77 patients, hepatic metastatic disease)
CECT Single section GLH (TexRAD) Bonferroni cor-rection
Entropy, MPP, and SD negatively associated with tumor grade; entropy negatively associ-ated with survival
Ganeshan et al (53)
NSCLC (14 patients) Nonenhanced CT, CECT Three sections GLH Holm correction SD and MPP associated with pimonidazole staining (hypoxia); uniformity negatively asso-ciated with Glut-1 (hypoxia); MPP negatively associated with CD34 (angiogenesis) Ganeshan et
al (4)
NSCLC (54 patients) Nonenhanced CT No data GLH No data PET stage and tumor heterogeneity were inde-pendent predictors of survival
Ahn et al (59) NSCLC (98 unresect-able cases treated with CCRT)
CECT Whole tumor
volume GLH (in-house program) No Higher entropy, higher skewness, and higher mean gray-level intensity associated with decreased 3-year OS
Hayano et al (60)
NSCLC (35 patients with metastatic dis-ease treated with anti-angiogenic therapy)
Nonenhanced CT for CTTA, CECT (CTP)
Single section GLH (TexRAD) No High MPP and low entropy = favorable PFS and OS; low SUVmax = favorable OS; CTP not associated with survival; entropy indepen-dent predictor of OS in MV analysis Zhang et al
(8)
SCC of head and neck (72 patients)
CECT, some vendor heterogeneity of CT scanners
Single section GLH (TexRAD) No High entropy and high skewness associated with poor OS; tumor size and nodal stage also as-sociated with OS
Note.—ccRCC = clear cell RCC, CCRT = chemotherapy–radiation therapy, CECT = contrast-enhanced CT, chRCC = chromophobe RCC, CRC = colorectal cancer, CTP = CT perfusion, GLCM = gray-level co-occurrence matrix, GLH = gray-level histogram, HG = high grade, LG = low grade, MV = multivariate, NSCLC = non–small cell lung cancer, OS = overall survival, PFS = progression-free survival, pRCC = papillary RCC, RLM = run-length matrix, SCC = squamous cell carcinoma, SD = standard deviation, TCC = transitional cell carcinoma.
Goh and coworkers (Goh V et al. Radiology 2011) assessed 39 patients with metastatic RCC being treated with tyrosine kinase inhibitors and found that entropy decreased and uniformity increased as tumors were treated, suggesting decreasing heterogeneity. Texture uniformity was an independent predictor of time to progression. Kaplan-Meier curves using a uniformity change threshold performed better in stratifying patients without disease progression than standard response assessments including RECIST, Choi criteria, and modified Choi criteria.
Use of texture to assess response to therapy has also shown some promise in lung, pancreas, and colorectal cancer.
Nononcologic Applications of CTTA
In addition to the oncologic applications, there are a number of emerging nononcologic applications of CTTA, including assessing lung disease such as fibrosis and emphysema, assessing hepatic fibrosis or risk for hepatic failure after resection, assessing abdominal aortic aneurysms for risk of rupture, and evaluating osseous trabecular texture to detect anorexia nervosa. The number of studies is too limited to draw conclusions about the value of CTTA in assessing diffuse disease of the lungs and liver.
Artificial Intelligence in Radiology
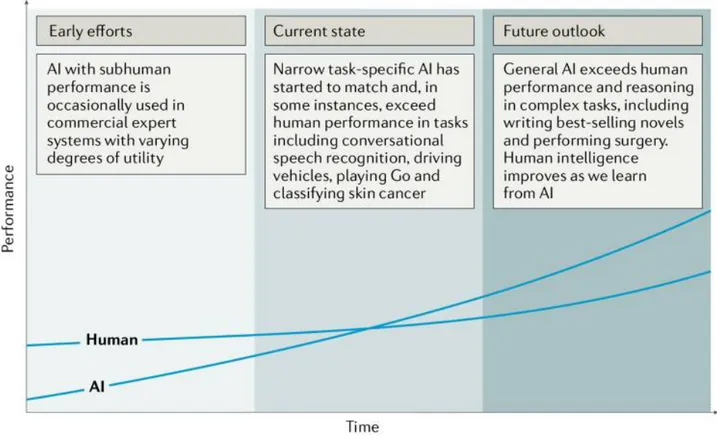
Artificial intelligence (AI) has recently made substantial strides in perception (the interpretation of sensory information), allowing machines to better represent and interpret complex data. This has led to major advances in applications ranging from web search and self-driving vehicles to natural language processing and computer vision — tasks that until a few years ago could be done only by humans. Deep learning is a subset of machine learning that is based on a neural network structure loosely inspired by the human brain. Such structures learn discriminative features from data automatically, giving them the ability to approximate very complex nonlinear relationships (BOX 1). While most earlier AI methods have led to applications with subhuman performance, recent deep learning algorithms are able to match and even surpass humans in task-specific applications (Fig. 1). This is owing to recent advances in AI research, the massive amounts of digital data now available to train algorithms and modern, powerful computational hardware. Deep learning methods have been able to defeat humans in the strategy board game of Go, an achievement that was previously thought to be decades away given the highly complex game space and massive number of potential moves. Following the trend towards a human-level general AI, researchers predict that AI will automate many tasks, including translating languages, writing best-selling books and performing surgery — all within the coming decades.
Within health care, AI is becoming a major constituent of many applications, including drug discovery, remote patient monitoring, medical diagnostics and imaging, risk management, wearables, virtual assistants and hospital management. Many domains with big data components such as the analysis of DNA and RNA sequencing data are also expected to benefit from the use of AI. Medical fields that rely on imaging data, including radiology, pathology, dermatology and ophthalmology, have already begun to benefit from the implementation of AI methods (Box 2).
Figure 1: Artificial versus human intelligence. This plot outlines the performance levels of artificial
intelligence (AI) and human intelligence starting from the early computer age and extrapolating into
the future. Early AI came with a subhuman performance and varying degrees of success. Currently,
we are witnessing narrow task-specific AI applications that are able to match and occasionally surpass
human intelligence. It is expected that general AI will surpass human performance in specific
applications within the coming years. Humans will potentially benefit from the human-AI
interaction, bringing them to higher levels of intelligence.
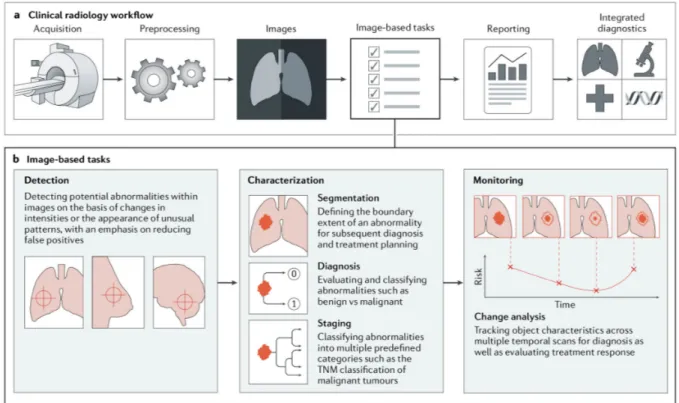
Within radiology, trained physicians visually assess medical images and report findings to detect, characterize and monitor diseases. Such assessment is often based on education and experience and can be, at times, subjective. In contrast to such qualitative reasoning, AI excels at recognizing complex patterns in imaging data and can provide a quantitative assessment in an automated fashion. More accurate and reproducible radiology assessments can then be made when AI is integrated into the clinical workflow as a tool to assist physicians.
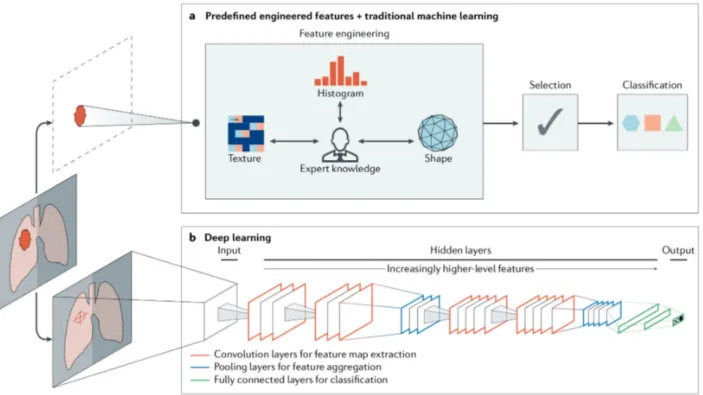
As imaging data are collected during routine clinical practice, large data sets are — in principle — readily available, thus offering an incredibly rich resource for scientific and medical discovery. Radiographic images, coupled with data on clinical outcomes, have led to the emergence and rapid expansion of radiomics as a field of medical research. Early radiomics studies were largely focused on mining images for a large set of predefined engineered features that describe radiographic aspects of shape, intensity and texture. More recently, radiomics studies have incorporated deep learning techniques to learn feature representations automatically from example images, hinting at the substantial clinical relevance of many of these radiographic features. Within oncology, multiple
Box 1 |. Artificial intelligence methods in medical imaging
Machine learning algorithms based on predefined engineered features
Traditional artificial intelligence (AI) methods rely largely on predefined engineered feature algorithms (Fig. 2a) with explicit parameters based on expert knowledge. Such features are designed to quantify specific radiographic characteristics, such as the 3D shape of a tumour or the intratumoural texture and distribution of pixel intensities (histogram). A subsequent selection step ensures that only the most relevant features are used. Statistical machine learning models are then fit to these data to identify potential imaging-based biomarkers. Examples of these models include support vector machines and random forests.
Deep learning algorithms
Recent advances in AI research have given rise to new, non-deterministic, deep learning algorithms that do not require explicit feature definition, representing a fundamentally different paradigm in machine learning. The underlying methods of deep learning have existed for decades. However, only in recent years have sufficient data and computational power become available. Without explicit feature predefinition or selection, these algorithms learn directly by navigating the data space, giving them superior problem-solving capabilities. While various deep learning architectures have been explored to address different tasks, convolutional neural networks (CNNs) are the most prevalent deep learning architecture typologies in medical imaging today. A typical CNN comprises a series of layers that successively map image inputs to desired end points while learning increasingly higher-level imaging features (Fig. 2b). Starting from an input image, ‘hidden layers’ within CNNs usually include a series of convolution and pooling operations extracting feature maps and performing feature aggregation, respectively. These hidden layers are then followed by fully connected layers providing high-level reasoning before an output layer produces predictions. CNNs are often trained end-to-end with labelled data for supervised learning. Other architectures, such as deep autoencoders and generative adversarial networks, are more suited for unsupervised learning tasks on unlabelled data. Transfer learning, or using pre-trained networks on other data sets, is often utilized when dealing with scarce data.
the diagnosis and risk stratification of different cancers. For example, studies in non-small-cell lung cancer (NSCLC) used radiomics to predict distant metastasis in lung adenocarcinoma and tumour histological subtypes as well as disease recurrence, somatic mutations, gene-expression profiles and overall survival. Such findings have motivated an exploration of the clinical utility of AI-generated biomarkers based on standard-of-care radiographic images — with the ultimate hope of better supporting radiologists in disease diagnosis, imaging quality optimization, data visualization, response assessment and report generation.
Box 2 |. Examples of clinical application areas of artificial intelligence in oncology Radiology-based
Thoracic imaging.
Lung cancer is one of the most common and deadly tumors. Lung cancer screening can help identify pulmonary nodules, with early detection being lifesaving in many patients. Artificial intelligence (AI) can help in automatically identifying these nodules and categorizing them as benign or malignant.
Abdominal and pelvic imaging.
With the rapid growth in medical imaging, especially computed tomography (CT) and magnetic resonance imaging (MRI), more incidental findings, including liver lesions, are identified. AI may aid in characterizing these lesions as benign or malignant and prioritizing follow-up evaluation for patients with these lesions.
Colonoscopy.
Colonic polyps that are undetected or misclassified pose a potential risk of colorectal cancer. Although most polyps are initially benign, they can become malignant over time. Hence, early detection and consistent monitoring with robust AI-based tools are critical.
Mammography.
Screening mammography is technically challenging to expertly interpret. AI can assist in the interpretation, in part by identifying and characterizing microcalcifications (small deposits of calcium in the breast).
Brain imaging.
Brain tumors are characterized by abnormal growth of tissue and can be benign, malignant, primary or metastatic; AI could be used to make diagnostic predictions.
Radiation oncology.
Radiation treatment planning can be automated by segmenting tumors for radiation dose optimization. Furthermore, assessing response to treatment by monitoring over time is essential for evaluating the success of radiation therapy efforts. AI is able to perform these assessments, thereby improving accuracy and speed.
AI in Medical Imaging
The primary driver behind the emergence of AI in medical imaging has been the desire for greater efficacy and efficiency in clinical care. Radiological imaging data continues to grow at a disproportionate rate when compared with the number of available trained readers, and the decline in imaging reimbursements has forced health-care providers to compensate by increasing productivity. These factors have contributed to a dramatic increase in radiologists’ workloads. Studies report that, in some cases, an average radiologist must interpret one image every 3–4 seconds in an 8-hour workday to meet workload demands. As radiology involves visual perception as well as decision making under uncertainty, errors are inevitable — especially under such constrained conditions.
A seamlessly integrated AI component within the imaging workflow would increase efficiency, reduce errors and achieve objectives with minimal manual input by providing trained radiologists with pre-screened images and identified features. Therefore, substantial efforts and policies are being put forward to facilitate technological advances related to AI in medical imaging. Almost all image-based radiology tasks are contingent upon the quantification and assessment of radiographic characteristics from images. These characteristics can be important for the clinical task at hand, that is, for the detection, characterization or monitoring of diseases. The application of logic and statistical pattern recognition to problems in medicine has been proposed since the early 1960s. As computers became more prevalent in the 1980s, the AI-powered automation of many clinical tasks has shifted radiology from a perceptual subjective craft to a quantitatively computable domain. The rate at which AI is evolving radiology is parallel to that in other application areas and is proportional to the rapid growth of data and computational power. There are two classes of AI methods that are in wide use today (BOX 1; Figure 2). The first uses handcrafted engineered features that are defined in terms of mathematical equations (such as tumor texture) and can thus be quantified using computer programs. These features are used as inputs to state-of the-art machine learning models that are trained to classify patients in ways that can support clinical decision