1
A METHODOLOGY FOR EVALUATING THE
TEMPORAL STABILITY OF SPATIAL PATTERNS
OF VINEYARD VARIATION
Gambella F.
(1); Dau R.
(1); Paschino F.
(1)(1)
University of Sassari, Department of Agricultural Engineering, Viale Italia 39, 07100 Sassari, Italy.
Castrignanò A.
(2); De Benedetto D.
(2);
(2)
Consiglio per la Ricerca e la sperimentazione in Agricoltura (CRA). Unità di ricerca per i sistemi colturali degli ambienti caldo-aridi (Bari) Via Celso
Ulpiani 5, 70125 - Bari-Italy. [email protected]
Abstract: Vineyards vary substantially in the quantity and quality of grapes they
produce. The study was undertaken in a commercial “Semidano” vineyard block (0.6 ha) in the municipality of Mogoro (Sardinia isle, Italy) during the vintages of 2008, 2009 and 2010. A total of 106 plants were sampled and georeferenced. To assess the joint spatial and temporal variation of the vine properties, a multivariate geostatistics technique was applied, called factor cokriging, which aims at decomposing the overall variance in a restricted number of regionalised scale-dependent factors. The thematic maps of the vineyard properties and the ones of the factors show a large variability on both space and time. All the measurements of spatial agreement reveal a lack of temporal stability of the variation patterns over the years.
Keywords: precision viticulture, geostatistical analysis, temporal stability
1.Introduction
Precision Viticulture (PV) is an application of new Information Technologies (IT) used to maximize grape production efficiency and quality while minimizing environmental impact and risk. It is actually dependent on the existence of spatial variability in either product quantity or quality or both. Some variables may also be temporally variable, but have stable spatial patterns or show little temporal stability. The most compelling argument for the adoption of PV is the accurate assessment of variability that has been observed in vegetative growth, yield and grape quality over the past few years (Bramley, 2004). The objectives of PV will differ, depending on the market requirements for wine, and the use of selective harvesting might be utilized to optimize quality (Bramley et al., 2003). Thus winemakers need to produce grapes that maintain certified characteristics of good quality over the years and to reduce the interventions by adopting site-specific techniques. Grape quality within the zones characterized by different vegetative vigor is tested by using a stratified sampling and the results are used to formulate differential harvest strategies (Bramley et al. 2005). When maps are delivered, farmers receive a large amount of data which has to be analyzed rapidly. This means that the decision, as to whether or not it is appropriate to apply site-specific management (SSM), has to be made in a few days. This step is even more critical in viticulture when the information is delivered and analyzed at the cooperative level. The
2
primary technological advance that makes precision agriculture feasible is the yield map, which enables the farmer to estimate crop yields for sections as small as a few square meters and to display the collection of these estimates in color-coded maps. Growers can identify high- and low-yielding regions of the field and precisely quantify the differences between them. To produce accurate maps of yield and grape quality, the use of geostatistics may be much valued but it is also needed to introduce a methodology for evaluating the temporal stability of spatial patterns in the vineyard. The objectives of this work were to delineate homogeneous zones within a vineyard and test their stability over the years.
2. Materials and Methods
This study was undertaken in a commercial “Semidano” vineyard block (0.6 ha) in the municipality of Mogoro (Sardinia, Italy) during the years 2008, 2009 and 2010. The plants were harvested at 106 locations georeferenced by using a DGPS device (GRS1, TOPCON), and the number of bunches, the average bunch weight and the total production per plant were determined for each year (9 variables). The Babo° degree of the grapes was calculated by rifractometric method using an optical refractometer (MR 210, Greensis) and the total acidity (tartaric acid) was expressed in ml of NaOH 0,1 N used for tritated 7.5 ml of must solution. The measurements were done only in 2010. The multivariate data set then included eleven variables.
To assess the joint spatial and temporal variation of the vineyard properties a multivariate geostatistical technique was applied, called factor cokriging analysis (FCKA), which aims at decomposing the overall variance in a restricted number of regionalised scale-dependent factors. The theory underlying FCKA was described by Castrignanò et al., 2000 and Wackernagel, 2003.
To produce the maps of the variables, MultiGaussian approach was used which requires a prior Gaussian transformation of the initial attribute into a Gaussian-shaped variable (Wackernagel, 2003, pp. 238-249).
The transformed data were then submitted to geostatistical analyses and the estimates were back-transformed to the raw data to produce thematic maps.
The three basic steps of FCKA are the following:
1) modelling the coregionalization of the set of variables, using the so called Linear Model of Coregionalization (LMC) and interpolating the variables at the nodes of a 1 by 1m-cell grid by cokriging;
2) analysing the correlation structure between the variables, by applying Principal Component Analysis (PCA) at each spatial scale;
3) cokriging specific factors at the characteristic scales and mapping them.
Contingency table and Cohen’s kappa statistic were used to evaluate the stability of the spatial patterns of variation over the three-year period of study.
3. Results
The exploratory analysis (results not shown) of measured variables in the different years revealed considerable variation both across the vineyard and over time. The spatial variation was attested by the high values of CVs, whereas substantial temporal variability between the vintages was observed, as tested by the mean and maximum values, which varied significantly among the different dates for each type of variable.
3
A LMC was fitted to the Gaussian transformed data of all variables, including two basic structures: a nugget effect and an isotropic spherical model with range=18 m. The overall spatial and temporal variance was split into two approximately equal components, the not-spatially correlated component (nugget effect) and the short-range component. The previous results show that the most variation within the vineyard occurred at very short distance.
The spatial maps of the eleven variables, obtained by cokriging, show a large variability on both space and time making difficult to disclose some distinct spatial patterns (only the maps of grape mass per plant were reported in Figure 1). Nevertheless, there is a wide central area mostly characterised by the highest values of number of bunches, average bunch weight and total production per plant in all the three years and by the minimum values of acidity and Babo degrees of grapes, in 2010 characterized by a general increase in erraticity.
Figure 1: Thematic maps of grape mass per plant for the three years.
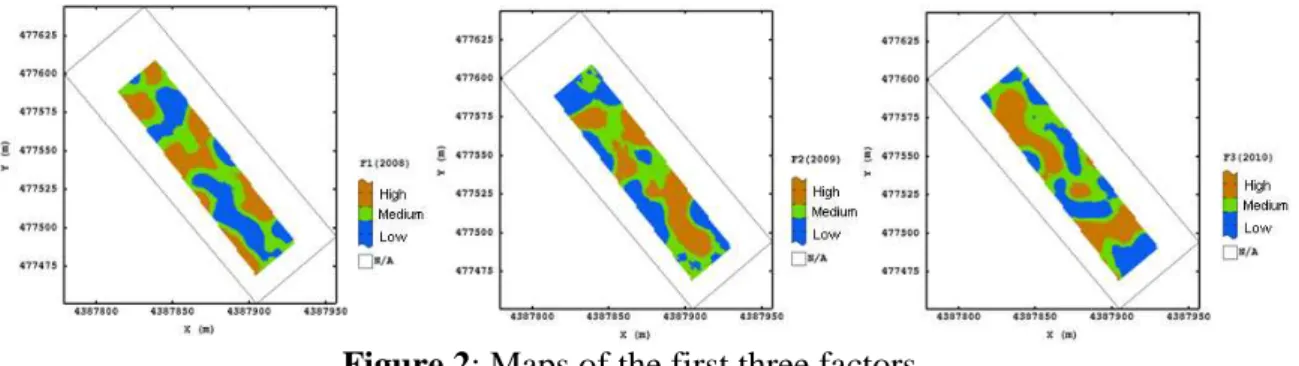
In PCA applied to 18m-range structure we retained the eigenvectors (factors) producing eigenvalues greater than one. Therefore, we focused on the first three factors, which accounted for 36%, 30% and 20%, respectively, of the total variation at the corresponding spatial scale. The positive loading values for the three factors (data not shown) indicated the variables recorded in 2009, 2008 and 2010 as the ones most influencing the first, second and third factor, respectively. These factors can then be assumed as indicators of grape production in 2009 and 2008 and also of grape quality in 2010, even if the proportion of the spatially structured variance explained by each one of them is quite low.
Figure 2 shows the maps of the indices obtained by classifying the scores of each factor into three isofrequency classes, called low, medium and high. All the maps look quite variable, characterised by many spots of contrasting values, so that it is very difficult to disclose some common patterns of spatial dependence remaining stable over the years. At a visual inspection, the maps (Figure 2) do not reveal a sensible spatial association from one year to another one, which means that temporal variation, related to meteorological pattern, exceeded spatial variation in the three years. However, to make these comparisons more objective, we calculated two contingency matrices (not shown) to assess the spatial shift of the classes from the 2008 vintage to 2009 vintage and from the 2009 vintage to 2010 vintage. The results show that the classes high, low and medium corresponding to the 2008 vintage remained stable in the corresponding classes (high, low and medium) of the 2009 vintage at the percentages of 37.40, 32.91 and 34.14, respectively, whereas the resting part moved to the other classes. About 34%f the class high was transformed into low class and 31% of low class into high class. As for the transition from the 2009 vintage to 2010 vintage the high class remained stable for
4
41.39% and moved to low class for 26.52%, whereas the low class remained stable for 46.65% and moved to high for 31.95%. In synthesis, the results show that the overall temporal stability of the classes between the vintages 2008-2009 and 2009-2010 was about 35% and 45%, respectively. These results are confirmed also by the values of k statistics, 0.023 and 0.18 for the two cases, respectively, which are extremely low, even if significantly different from zero. Such a low level of spatial association over time can be attributed mainly to the sensitivity of the vineyard to the contingent conditions.
Figure 2: Maps of the first three factors.
4. Concluding remarks
The main objective of this work was to assess the magnitude, structure and persistence in time of the spatial distributions of quantitative and qualitative properties of a vineyard using multivariate geostatistics. In this study we showed that multivariate geostatistics can be used to assess the heterogeneous spatial and temporal distributions within a vineyard and could then be used efficiently in PV. However, to make site-specific management successful, the spatial distribution of vine should be well structured and the temporal persistence high enough. The preliminary results seem to advice against the use of PV in the study vineyard, though the analysis should be repeated over several years in order to reveal valuable recurrent patterns over time.
References
Castrignanò A., Giugliarini L., Risaliti R., Martinelli N., 2000. Study of spatial relationships among some soil physico-chemical properties of a field in central Italy using multivariate geostatistics. Geoderma, 97, 39-60.
Bramley R. G. V., and Hamilton, R. P. 2004. Understanding variability in winegrape production system. 1. Within vineyard variation in yield over several vintages.
Australian Journal of Grape and Wine Research, 10, 32-45.
Bramley, R., Pearse, B. and Chamberlain, P. (2003) Being Profitable Precisely – A case study of Precision Viticulture from Margaret River. Australian Grapegrower and
Winemaker 473a, 84–87.
Bramley, R. G. V., Proffitt, A. P. B., Hinze, C. J., Pearse, B., & Hamilton, R. P. (2005). Generating benefits from precision viticulture through selective harvesting. In J. V. Stafford (Ed.), Precision agriculture ‘05 (pp. 891–898). Wageningen, The Netherlands: Wageningen Academic Publishers.
Wackernagel H., 2003. Multivariate Geostatistics: an Introduction with Applications. Springer Verlag Berlin, 3rd ed., 388 pp.