ISSN 2282-6483
Are Fiscal Multipliers Estimated
with Proxy-SVARs Robust?
Giovanni Angelini
Giovanni Caggiano
Efrem Castelnuovo
Luca Fanelli
Quaderni - Working Paper DSE N°1151
Are Fiscal Multipliers
Estimated with Proxy-SVARs Robust?
Giovanni Angelini
Giovanni Caggiano
University of Bologna
Monash University
University of Padova
Efrem Castelnuovo
Luca Fanelli
University of Melbourne
University of Bologna
University of Padova
June 2020
Abstract
How large are government spending and tax multipliers? The …scal proxySVAR literature provides heterogenous estimates, depending on which proxies -…scal or non--…scal - are used to identify -…scal shocks. We reconcile the existing estimates via a ‡exible vector autoregressive model that allows to achieve identi…-cation in presence of a number of structural shocks larger than that of the available instruments. Our two main …ndings are the following. First, the estimate of the tax multiplier is sensitive to the assumption of orthogonality between total factor productivity (non-…scal proxy) and tax shocks. If this correlation is assumed to be zero, the tax multiplier is found to be around one. If such correlation is non-zero, as supported by our empirical evidence, we …nd a tax multiplier three times as large. Second, we …nd the spending multiplier to be robustly larger than one across di¤erent models that feature di¤erent sets of instruments. Our results are robust to the joint employment of di¤erent …scal and non-…scal instruments.
Keywords: Fiscal multipliers, …scal policy, identi…cation, instruments, struc-tural vector autoregressions.
JEL codes: C52, E62.
We thank Ralf Brüggeman, Dario Caldara, Fabio Canova, Giovanni Pellegrino, Pedro Gomis-Porqueras, Bruce Preston, Søren Hove Ravn, Antti Ripatti, Xuan Zhou, and participants at seminars held at the Universities of Bologna, Helsinki, Adelaide, Deakin University, and the 30th EC2Conference on "Identi…cation in Macroeconomics" (Oxford University) for useful feedback, and Valerie Ramey and Sarah Zubairy for an email exchange on a …scal proxy available on Ramey’s website. Giovanni Angelini thanks the University of Melbourne (where part of this research was developed) for its kind hospital-ity. Financial support by the Australian Research Council via the Discovery Grant DP160102281 is gratefully acknowledged. Corresponding author: Efrem Castelnuovo, [email protected] .
Non-technical summary
We conduct a proxy-SVAR analysis to quantify the size of the …scal spend-ing and tax multipliers in the US. We do so by employspend-ing an empirical strat-egy which enables the econometrician to: i) accommodate situations in which one proxy is used to instrument more than one shock; ii) exploit more proxies in a joint fashion to instrument a single shock. The proxy-SVAR is denoted AC-SVAR, where A stands for "Augmented" and C for "Constrained". The "Augmented" part refers to the fact that the VAR of interest is augmented by appending a structure taking care of the dynamics of the instruments. The "Constrained" part refers to zero constraints that we impose to deal with a manageable structure (e.g., we assume that the lags of the instruments do not enter the equations of the economic variables of interest, which are public spending, tax revenues, and output in our analysis). The analysis is conducted with a frequentist approach that, under given restrictions, enables us to jointly test for the relevance of the instruments and for the structure of the VAR as a whole.
A natural question is: Why yet another proxy-SVAR paper on …scal mul-tipliers? Because, so far, the literature has provided con‡icting results, and part of this con‡ict is related to the instruments used in some reference analy-sis, and to the way such instruments have been coupled with the reference VAR. A clear example regards the tax multiplier. A series of papers by Karel Mertens and Morten Ravn (2011, 2012, 2013, 2014) exploit a narrative in-strument for tax changes in the US, and point to a tax multiplier as large as 3. This multiplier is associated to a large output-tax elasticity, which is also larger than 3. Quite di¤erently, a recent paper by Caldara and Kamps (2017) employs TFP shocks as an instrument to output shocks, via which the authors recover the tax multiplier (by exploiting the information carried by the covariance matrix of the estimated VAR residuals). They …nd a tax multiplier lower than one, and an output-tax elasticity close to 2. Given the relevance played by assumptions on the …rscal multiplier for …scal policy decisions, it is imperative to dig deeper and understand what’s behind the di¤erence between Mertens and Ravn’s vs. Caldara and Kamps’…ndings.
Tax multiplier: Findings. Our …ndings are the following. First, using the same instruments employed by Mertens and Ravn on the one hand (in particular, their narrative tax changes series purged by expected variations, something which is done to focus on unexpected changes in tax revenues),
and Caldara and Kamps on the other (TFP à la Fernald (2014)), we are able to replicate their results, i.e., a multiplier around 3 in the former paper, and below one in the latter. Second, we show that Caldara and Kamps’…nding is driven by the questionable TFP-tax shocks orthogonality assumption they have to entertain for their machinery to work. Using their very same data, we show that such assumption is rejected by the data. Moreover, we show that, when modeling the TFP-tax shocks correlation (which is fundamentally driven by the systematic contemporaneous response of tax revenues to out-put ‡uctuations), the tax multiplier one …nds by using the TFP instrument turns out to be three times as large, and takes a value pretty close to the one found by Mertens and Ravn in their investigations. Crucial to this …nding is the impact that directly modeling the TFP-tax shocks correlation has got on the output-tax elasticity, which moves from close to 2 (assumption of orthog-onality) to larger than 3 (non-orthogonality allowed). Our Appendix shows the downward bias the output-tax elasticity is a¤ected by if one does not model the above mentioned correlation in a world in which such correlation is di¤erent from zero. Our …ndings on the key role played by the assumption of orthogonality between TFP and tax shocks are robust to the joint use of multiple instruments and to di¤erent speci…cations of the VAR we employ (in particular, adding in‡ation and a policy rate does not a¤ect our main …ndings, and using instruments such as oil shocks and spending shocks does not a¤ect our results). Our empirical results con…rm the positive correlation between the output-tax elasticity and the tax multiplier already found by Mertens and Ravn (2014) and Caldara and Kamps (2017).
Fiscal spending multiplier: Findings. Turning to the …scal spending multiplier, our proxy-SVAR analysis points to a multiplier larger than one (in the 1.6-2.1 range). This …nding is robust to modeling (or not) the above mentioned TFP-tax shocks correlation, as well as to using di¤erent instru-ments, among which a novel instrument obtained by purging Ramey’s (2011) news shocks by its predictable component in order to have an instrument for unexpected changes in …scal spending (this idea resambles the one already pursued by Auerbach and Gorodnichenko in their 2012 AEJEP paper). Also, our results are robust to adding in‡ation and a policy rate to the VAR, and also to jointly using TFP shocks, …scal spending shocks, and oil shocks as instruments in our analysis.
multi-plier larger than 3, and a spending multimulti-plier between 1.6 and 2.1. However, while the latter is fairly precisely estimated, the former is quite unprecisely estimated, and our 68% bands (computed as suggested by ? to take the censoring of some of the instruments into account) cover a large range of values. We believe this …nding to be informative for policymakers who are risk averse. When deciding over the optimal …scal policy mix, policymakers should take into account not only the point estimates of these two multipli-ers, but also the statistical uncertainty surrounding them. It may very well be that risk-averse policymakers would prefer to use public spending as their main policy tool, given the much larger uncertainty surrounding the tax mul-tiplier. We see a project on optimal …scal policy under uncertain multipliers as the natural continuation of this project.
1
Introduction
The COVID-19 shock is predicted to generate a sizeable recession in the US and around the world (International Monetary Fund (2020)). While an immediate response by …scal (as well as monetary) policymakers has been implemented, other interventions to sustain aggregate demand are likely to be needed in the remainder of 2020 and the following years. Such interventions should be designed on the basis of assumptions on the …scal multipliers, whose quanti…cation is a di¢ cult task. The reason is that spending and tax revenues are in large part endogenous, and tackling this endogeneity issue to identify the output e¤ects of exogenous variations in …scal variables - i.e., …scal shocks - is challenging.
One way to identify causal e¤ects that has recently gained a lot of traction is the "proxy-SVAR" (or "SVAR-IV") approach, which relies on the use of instruments for the identi…cation of the shocks of interest (see Stock and Watson (2012) and Mertens and Ravn (2013) for early contributions, and Stock and Watson (2018) for a review).1
Using a measure of unanticipated exogenous variations in tax revenues constructed via a narrative approach, Romer and Romer (2010) and Mertens and Ravn (2011b, 2012, 2013, 2014) …nd tax multipliers between 2 and 3.2 Di¤erently, Caldara and
Kamps (2017) employ Fernald’s (2014) measure of total factor productivity (TFP) to identify exogenous changes of output in …scal policy rules. Conditional on these rules, they recover the …scal policy shocks of interest and their business cycle e¤ects. Their estimates of the tax multiplier range between 0.5 and 0.7, while that of the spending multiplier is 1-1.3. While Caldara and Kamps’ (2017) estimates of the tax multiplier are substantially smaller than those provided by the papers mentioned above, those of the spending multiplier are larger than the ones documented in the papers surveyed by Ramey (2019), which point to a 0.6-1 range. In light of policymakers’need to get reliable and robust indications on the size and relative strength of the spending and tax multipliers, the heterogeneity of the estimates provided by the extant literature is problematic.
Contributions of our paper. This paper employs both …scal and non-…scal
in-1We will use the terms "instruments" and "proxies" interchangeably throughout the paper. 2Lower …gures are obtained by Favero and Giavazzi (2012), who estimate a tax multiplier similar to
Blanchard and Perotti’s (2002), and Perotti (2012), who …nds a tax multiplier larger than Blanchard and Perotti’s (2002) but smaller that those documented in the text. For a discussion on the reasons behind the discrepancies between Mertens and Ravn’s set of estimates, Favero and Giavazzi’s, and Perotti’s, see Mertens and Ravn (2014).
struments in a proxy-SVAR setting and makes two contributions to the literature. First, we show that the assumption of orthogonality (exogeneity) between the non …scal proxy (TFP as in Caldara and Kamps (2017)) and the tax shocks is key in determining the size of the tax multiplier. If we entertain this assumption, we get tax multipliers in the range of 0.5 and 0.7. Di¤erently, if the orthogonality condition is relaxed (something we can do in our multivariate framework), the data: i) point to a negative and signif-icant correlation between TFP and tax shocks; ii) imply a tax multiplier larger than 3. Second, we …nd a …scal spending multiplier larger than one. This estimate is very robust to the use of di¤erent instruments and modeling speci…cations.
Methodology. We obtain these results by working with a ‡exible proxy-SVAR methodology recently proposed by Angelini and Fanelli (2019) and termed "augmented and constrained SVAR" (AC-SVAR). In short, the AC-SVAR jointly models both the variables of interest (e.g., …scal spending, tax revenues, and output) and the proxies used to identify the shocks of interest. This approach has three main advantages over alternatives …scal proxy-SVARs. First, it enables us to trade relatively uncontroversial zero restrictions (e.g., the zero contemporaneous response of …scal spending to output as in Blanchard and Perotti (2002), or the zero response of tax revenues to …scal spending shocks as in Caldara and Kamps (2017)) with the possibility of instrumenting more than one shock with one proxy.3 This is of particular importance in our analysis, as it
allows us to unveil the negative correlation between the TFP proxy and the tax shocks in the data and, consequently, to reconcile the di¤erent estimates of the tax multiplier obtained in the literature. Second, our approach easily accommodates the case in which multiple instruments are used to identify multiple shocks. Third, it enables us to test the validity of the proxy-SVAR speci…cation (validity of instruments included) without resorting to information outside the VAR framework at work.
Instruments. Our baseline exercises are conducted by using three di¤erent instru-ments. The …rst one is the unanticipated tax shocks proposed by Mertens and Ravn (2011b). They isolate the unanticipated component of the tax shocks series originally constructed by Romer and Romer (2010), who identify exogenous variations in tax policy decisions via their reading of narrative records. The second one is a version of the …scal spending shocks proposed by Auerbach and Gorodnichenko (2012), which we obtain by estimating an expectations-augmented …scal VAR in which news spending
3Section 3 provides an illustrative example on how our methodology works when one instrument is
shocks à la Ramey (2011) are allowed to exert a contemporaneous impact on …scal spending.4 To our knowledge, ours is the …rst exercise in which a proxy for unexpected …scal spending shocks is used to estimate the US …scal spending multiplier in a proxy-SVAR context. In this sense, our contribution complements the one by Ramey (2011), who focuses on the output response to anticipated …scal spending shocks.5 The third
instrument we use in our analysis is the factor utilization-adjusted total factor productivity series produced by Fernald (2014), which following Caldara and Kamps (2017) -we exploit to identify shocks to the business cycle. Finally, in an extended version of the model that also features in‡ation, we use a fourth instrument, i.e., the oil shocks series proposed by Hamilton (2003) to instrument in‡ation shocks. While we use the …rst two proxies to directly identify the …scal shocks of interest, the latter two instruments carry information for the identi…cation of non-…scal shocks that, via the moments related to the covariance matrix of the …scal SVAR, can be exploited to identify …scal elastici-ties and, consequently, spending and tax multipliers. Importantly, the assessment of the statistical uncertainty surrounding our point estimates is undertaken by computing con…dence bands via the Moving Block Bootstrap (MBB) resampling scheme proposed by Jentsch and Lunsford (2019a), which suitably takes into account the distributional properties of the VAR innovations and of the proxies used in our analysis.6
Findings. Our point estimates of the …scal spending multiplier fall in the 1.6-2.1 range. These point estimates, which are supported by di¤erent sets of instruments and model speci…cations, are statistically in line with the one by Caldara and Kamps’ (2017), who work with non-…scal instruments only, Canova and Pappa (2007), who work with sign restrictions in a panel SVAR framework modeling US and EU data, and Leeper, Traum, and Walker (2017), who work with di¤erent micro-founded structural frameworks. Our estimates also support the 1.6 …gure used by Christina Romer - at
4The idea is to purge the one-step ahead …scal spending forecast error by the component which can
actually be anticipated on the basis of narrative records. Auerbach and Gorodnichenko (2012) is the …rst paper conducting a VAR exercise with this measure. They use real-time professional forecasts, available since 1966, to control for expectations not already absorbed by their VAR. Our choice of using Ramey’s (2011) news spending shock as a control is due to its availability, which covers the entire sample we work with (1950Q1-2006Q4).
5Ramey and Zubairy (2018) estimate the multiplier generated by anticipated …scal spending shocks
with a local projections approach. See Plagborg-Møller and Wolf (2018) on the mapping between local projections and proxy-SVARs.
6The MBB correctly reconstructs the variability of estimated impulse response functions in
sit-uations featuring conditional heteroskedasticity in VAR innovations and/or zero-censored proxy as Mertens and Ravn’s. Section 3 elaborates on this point. For a discussion on this resampling scheme vs. alternatives, see Brüggemann, Jentsch, and Trenkler (2016), Jentsch and Lunsford (2019b) and Mertens and Ravn (2019).
the time Chair of President Obama’s Council of Economic Advisers - to predict the job gains possibly generated by the stimulus package approved by the US Congress in February 2009.7
Turning to the tax multiplier, depending on the model speci…cation and the instru-ments we rely upon, we can support point estimates ranging from 0.7 to 3.6. First, we show that our proxy-SVAR framework exactly replicates the "high" tax multiplier by Romer and Romer’s (2010) and Mertens and Ravn’s (2011b, 2012, 2013, 2014) and the "low" tax multiplier estimated by Caldara and Kamps (2017) when using their instru-ments in isolation (respectively, a narrative measure of tax shocks and a measure of TFP). Crucially, the latter estimate - the 0.7 value of the peak realization of the tax multiplier - is obtained under the assumption that the TFP proxy is orthogonal to the tax shock. However, economic intuition suggests that shocks driving the business cycle might also be behind ‡uctuations in tax revenues.8 In our context, this implies that the
TFP proxy could be also correlated with tax shocks, other than output shocks. One of the advantages of our approach is that we can relax the TFP-tax shocks orthogonality condition if other (testable) restrictions are met, so that we can use the TFP proxy to simultaneously instrument output and tax shocks. When we do so, we …nd a striking result, i.e., our estimate of the tax multiplier moves from 0.7 to 3.6. Interestingly, this estimate is in line with the 3.7 multiplier found by Mertens and Ravn (2011a), who estimate the response of the US tax revenues to a technology shock identi…ed with long-run restrictions.
Role of the TFP-tax shocks orthogonality condition. Why does relaxing the orthogonality condition drive the multiplier upward? The rationale for this result is the impact of the correlation between TFP and tax shocks on the estimate of the output-tax revenues elasticity. Our model points to a tax elasticity around 3.8. When imposing orthogonality between TFP and tax shocks, the estimate of the output-tax elasticity drops to 2.1. This latter …gure is basically the same as the one employed by Blanchard and Perotti (2002) and provided by the OECD (Giorno, Richardson, Roseveare, and van den Noord (1995)), which is 2.08. However, as pointed out by
7See https://voxeu.org/article/determining-size-…scal-multiplier. Auerbach and Gorodnichenko
(2012), Bachmann and Sims (2012), Caggiano, Castelnuovo, Colombo, and Nodari (2015), and Ghas-sibe and Zanetti (2019) …nd this multiplier to be larger in recessions. For contrasting evidence, see Ramey and Zubairy (2018). Evidence on state-dependent output e¤ects of tax shocks is provided by Sims and Wol¤ (2018).
8Mountford and Uhlig (2009) identify "business cycle" shocks by assuming them to generate a
positive conditional correlation between output and tax revenues. They point out that this assumption is consistent with a number of theoretical views.
Mertens and Ravn (2014), such estimate is likely to be a¤ected by endogeneity issues related to the estimation of the tax base-tax revenues and the output-tax base elasticities across di¤erent categories of tax revenues. Our exercises support Mertens and Ravn’s (2014) reasoning. Also, our results con…rm the link between output-tax elasticities and tax multiplier already unveiled by Mertens and Ravn (2014) (via counterfactual simulations) and Caldara and Kamps (2017) (via analytical derivations).
Robustness to the use of multiple instruments. A natural question at this point is: Are our …ndings robust to the joint use of multiple instruments? We address this question by estimating an extended version of our proxy-SVAR that also includes in‡ation and a policy rate. We identify shocks by using all four proxies contemporane-ously, i.e., the Auerbach and Gorodnichenko (2012) proxy for the …scal spending shock, the Mertens and Ravn (2012) proxy for the tax shock, the TFP proxy for the output shock and, depending on the speci…cation, the tax shock, and the Hamilton (2003) oil shocks proxy for the in‡ation shock. Even when multiple instruments are at play, our …ndings are: i) the crucial role played by the TFP-tax shocks orthogonality condition is con…rmed when using multiple instruments; ii) when relaxing the TFP-tax shocks orthogonality assumption, a larger tax elasticity and a tax multiplier larger than three arise.
While the modeling of the TFP-tax shocks correlation is crucial to unveil a large tax multiplier, such correlation does not seem to play any signi…cant role when it comes to quantifying the spending multiplier. Such multiplier is actually pretty robust across di¤erent sets of proxies. Why? The intuition goes back to the central role played by …scal elasticities. While the output-tax elasticity is sensitive to assumptions about the moment conditions relating instruments and VAR innovations, the output-spending elasticity is not. The reason is that the latter is close to zero in the data, a result in line with the institutional characteristics of the US system (Blanchard and Perotti (2002)). Hence, the endogeneity issue, if present, is much less severe for the estimation of the output-spending elasticity and, therefore, the spending multiplier.
This paper is structured as follows. Section 2 discusses how our paper relates to the extant literature. Section 3 presents the methodology, the data, and the way in which we compute the multipliers. Section 4 documents our results. Section 5 documents some robustness checks. Section 6 concludes.
2
Relation to the literature
Our work is related to the …scal proxy-SVAR literature that has used …scal and non-…scal instruments to quantify the size of the spending and the tax multiplier. The use of TFP shocks as an instrument to compute …scal multipliers is inspired by Caldara and Kamps (2017). Their analysis of the …scal multipliers features two parts. First, they show that the heterogeneity of estimates of the …scal multipliers in the literature can be explained by the di¤erent …scal elasticities implied by the di¤erent methodologies at work (zero restrictions, sign restrictions, proxy-SVARs). Then, they use non-…scal instruments to estimate …scal elasticities and work out the …scal multipliers by exploit-ing the information comexploit-ing from the covariance matrix of the VAR residuals. They …nd the …scal spending multiplier to be larger than one and bigger than the tax multi-plier. We reach a similar conclusion on the …scal spending multiplier, but a strikingly di¤erent one on the tax multiplier. As explained above, this di¤erence is due to the dif-ferent assumption on the TFP instrument-tax shocks relationship, i.e., the imposition of orthogonality by Caldara and Kamps (2017) that we do not entertain. Several other elements separate our investigation from theirs. First, we jointly employ …scal and non-…scal instruments to estimate the multipliers. Doing so enables us to show that, while the estimate of the …scal spending multiplier is robust across di¤erent sets of proxies, that of the tax multiplier is not. A second, related point is that, for the estimation of the latter multiplier, we unveil that relaxing the orthogonality (exogeneity) of the TFP instrument to tax shocks is crucial for correctly estimating the output e¤ects of tax cuts. Third, our methodology enables us to formally assess the validity of the instruments we use without appealing to information external to that of the original VAR and of the external instruments already used to identify the targeted shocks. Di¤erently, Caldara and Kamps (2017) need to appeal to …scal instruments to test the exogeneity (orthogo-nality) of the non-…scal instruments they use as proxies in their approach. Fourth, our AC-SVAR representation of proxy-SVARs enables us to work with overidenti…ed mod-els and formally test some of the restrictions imposed by the literature, e.g., the zero output-spending elasticity imposed by Blanchard and Perotti (2002) and Auerbach and Gorodnichenko (2012). Fifth, we cover the case of the estimation of the …scal spending multiplier related to an unexpected …scal spending shock, which they do not study.
Our analysis is related to recent contributions by Karel Mertens and Morten Ravn. We share with Mertens and Ravn (2013) the idea of using narratives on exogenous variations in tax revenues to directly identify US tax shocks. However, our method
allows us to jointly instrument …scal and non-…scal shocks, with the advantage of not being committed to Cholesky-type constraints when multiple instruments are used to identify multiple shocks. Because of this ‡exibility, we can account for cases where one proxy may instrument more than one structural shock, a crucial fact behind our empirical results. We share with Mertens and Ravn (2014) the idea that the proxy-SVAR approach is not necessarily con…ned to a "partial identi…cation" approach. This means that if the proxies are properly combined with a few additional restrictions that characterize the on-impact coe¢ cients associated with the non-instrumented shocks, one can identify all structural shocks of the system, not just the instrumented ones. Mertens and Ravn (2014) exploit this strategy in Section 3 of their article (p. 60), where to identify all shocks of their SVAR they complement the restrictions provided by the proxy used to identify the tax shock with one additional restriction, represented by the non-instantaneous reaction of government spending to changes in economic activity. Doing so, they not only identify the tax shock but also track the dynamic causal e¤ects of …scal spending shocks on output. However, while Mertens and Ravn (2014) instrument the tax shock only, our AC-SVAR model features speci…cations in which both the tax and …scal spending shocks (as well as non-…scal shocks) are instrumented jointly. Moreover, while the estimation in both Mertens and Ravn (2013) and Mertens and Ravn (2014) is based on instrumental variable methods, we rely on maximum likelihood, which is one of the bene…ts of representing the proxy-SVAR in the AC-SVAR form. This is important, as we can use likelihood ratio tests as the "metric" for the empirical evaluation of the estimated proxy-SVARs in presence of overidenti…cation restrictions.
The focus of this paper is on the output e¤ects of unexpected variations in …scal spending and taxes. Classic papers in this area are Blanchard and Perotti (2002), who rely on zero restrictions and institutional information about the US tax and transfer system to identify …scal shocks. They …nd a …scal spending multiplier larger or smaller than the tax multiplier depending on details of the VAR speci…cation. Di¤erently, Mountford and Uhlig (2009) work with sign restrictions and …nd a large tax multiplier and a spending multiplier lower than one. Our paper complements the analysis on the …scal multipliers due to changes in announced future …scal policies (see, among others, Fisher and Peters (2010), Ramey (2011), Leeper, Walker, and Yang (2013), Ricco (2016), Forni and Gambetti (2016), Ben Zeev and Pappa (2017)). It also comple-ments the recent investigations on the output e¤ects of debt consolidation plans, which are surveyed in Alesina, Favero, and Giavazzi (2018, 2019). In line with most of the literature, this paper deals with the output e¤ects of shocks to federal tax revenues.
Papers dealing with narrower de…nitions of tax shocks are Barro and Redlick (2011) and Mertens and Ravn (2013). Our focus is on the e¤ects of …scal shocks on aggregate output. Papers dealing with the distributional e¤ects of …scal shocks are Mertens and Montiel Olea (2018) and Zidar (2019).
Our analysis unveils the source of the heterogeneneity in the empirical estimates of tax multipliers. A related contribution is Chahrour, Schmitt-Grohe, and Uribe (2012), who show that the di¤erent tax multipliers obtained by Blanchard and Perotti (2002) - close to 1 - and Romer and Romer (2010) - around 3 - are not due to the di¤erent reduced-form representations of their econometric models (a VAR in the former case vs. a local projection equation in the latter). They point to the di¤erent identi…cation assumptions behind the two approaches as the source of the di¤erent estimates of the tax multiplier. Within the proxy-SVAR class, our paper sheds light on the role played by di¤erent identi…cation schemes in delivering substantially di¤erent estimates of the tax multiplier. Moreover, it shows that such di¤erent identi…cation schemes are signi…cantly more problematic for the estimation of the tax multiplier than for that of the …scal spending multiplier.
3
Methodology, data and multipliers
AC-SVAR: Identi…cation. Consider the following reduced-form VAR system
(L)Yt = ut (1)
where Yt is a vector of n observables, (L) In 1L 2L2 ::: pLp is the
matrix polynomial collecting the coe¢ cients associated with the p lags of the variables (Yt p = LpYt), and utis the vector of innovations with covariance matrix E(utu0t) = u.9
Let the mapping between the vector of innovations utand that of structural shocks
"t be
ut= B"t (2)
where it is assumed that E("t"0t) = In. We focus on the identi…cation of a subset of
k n structural shocks "1;t, where "t = ("1;t0 ; "02;t)0. "1;t collects the k shocks of primary
interest of the analysis, which in our framework are the …scal shocks (spending shock and tax shock), but possibly also non-…scal shocks. "2;t collects the remaining n k 9Constants and other deterministic terms are omitted for brevity. The extension of our formal
non-…scal structural shocks of the system.10 Then, without loss of generality, we can re-write the mapping (2) in the form
ut= B1"1;t+ B2"2;t (3)
where B = (B1 , B2), B1 contains the instantaneous impact coe¢ cients associated with
the shocks in "1;t, and B2 pertains to the instantaneous impact coe¢ cients associated
with the shocks in "2;t: We have ordered the shocks "1;t …rst for convenience: as it will
be clear below, the ordering of the variables is irrelevant in our framework.
Assume that a vector of k instruments vz;t for the shock "1;t is available. For such
instruments to be valid, the following two conditions have to hold:
E(vz;t"01;t) = , rank( ) = k (4)
E(vz;t"02;t) = 0k (n k): (5)
Condition (4) states that the k instruments have to be relevant, i.e., signi…cantly cor-related with the k structural shocks of interest. is a k k full column rank matrix containing "relevance" parameters, and the rank condition in (4) implies that each column of is non-zero and carries important information on the shocks in "1;t.
Con-dition (5) states that in the absence of further restrictions, the instruments have to be orthogonal to the non-instrumented shocks. The conditions (4)-(5) can be conveniently summarized for our purposes via the expression
vz;t= "1;t + !t (6)
which establishes that the instruments are connected to the instrumented structural shocks via the matrix ;up to the measurement error term !t:The measurement error
is assumed to be independent on "t = ("01;t; "02;t)0 and has covariance matrix !:
Angelini and Fanelli (2019) propose a novel approach to the identi…cation and esti-mation of proxy-SVARs. They work with an augmented system that jointly accounts for the observables Yt and the instruments vz;t Zt E( Ztj Ft 1), where Zt collect the
"raw" variables the instruments are constructed upon, and Ft 1 is the econometrician’s 10In our framework, the number of instrumented shocks k can be equal to the number of variables
of the VAR n. Our framework covers the case "1;t "t, meaning that we can potentially instrument
all structural shocks of the system. This is a novelty in the proxy-SVAR literature, which will be fully explored in our empirical exercises presented below. See also the example in the text.
information set at time t 1. They denote the resulting model with the acronym AC-SVAR, where "A" stands for "augmented" and "C" for "constrained" because of the (zero) constraints the model features. The AC-SVAR model reads as follows:11
(L) 0n k (L) (L) Yt Zt = ut vz;t (7) where (L) and (L) are matrix polynomials as (L) in the VAR (1), with (L)
1L + 2L2 + ::: + sLs and (L) Ik 1L 2L2 ::: qLq. The AC-SVAR
model allows the variables Zt to be persistent (via (L)), and possibly the lags of Yt to
be predictors of Zt (via (L)). Obviously, (L) = 0k n and (L) = Ik when vz;t Zt,
i.e., when the external instruments are already expressed in innovation form and need not be …ltered out on past information.12
In the AC-SVAR model, the relationships between innovations, instruments and shocks is obtained by coupling (3) with (6). The resulting system is the following:
ut vz;t = B1 B2 0n k 0k (n k) 1=2 ! e G 0 @ "1;t "2;t !o t 1 A (8)
where !ot denotes the measurement error term !t in (6) normalized to have unit
vari-ance.13
System (7)-(8) can be written in compact form. Consider the following de…nitions:
Wt Yt Zt , t ut vz;t ; e(L) (L) 0n k (L) (L) ; Ge B1 B2 0n k 0k (n k) 1=2!
where Wtand tare (n+k)-dimensional, and " " indicates that e (L) and eGincorporate 11A detailed exposition of the properties of the AC-SVAR approach can be found in Angelini and
Fanelli (2019). We use their notation to facilitate the mapping between their derivations and our presentation of their framework and its properties.
12Given the large number of coe¢ cients featured by the system of equations (7), in the empirical
analyses presented below we impose that (L) is diagonal when k > 1, i.e., the instruments are assumed to be dynamically unrelated to each other. These restrictions are supported by the data, i.e., the (cross-)correlations among the instruments used throughout the analysis are statistically equal to zero. Furthermore, in all estimated models discussed below the lag order q of (L) and s of (L) is set to four, in line with the VAR lag order p.
13Formally, 1=2
! in (8) is a symmetric positive de…nite matrix such that the variance of the
mea-surement error !t= 1=2! !ot is equal to !: In our setup 1=2! could also correspond to the Cholesky
by construction a set of zero restrictions. Then, system (7)-(8) can be expressed as: e(L)Wt = t (9) t = Ge t (10) where E( t 0 t) = = u 0u;vz u;vz ! , and E( t 0t) = In+k.
Equations (9)-(10) represent the proxy-SVAR as a "larger" SVAR system. Formally it reads as a structural "B-model" (Lütkepohl (2005)) characterized by a certain num-ber of zero restrictions in the autoregressive coe¢ cients e (L), and in the matrix of "structural parameters" eG:14 From eq. (10), the covariance restrictions are given by
= eG eG0 (11)
and it is easily seen that these generate, among others, the "core" covariance restrictions of proxy-SVAR analysis vz;u = B10 (see, among others, Stock and Watson (2012),
Mertens and Ravn (2013), Stock and Watson (2018), and Angelini and Fanelli (2019)). The matrix eGin (10) fully incorporates the restrictions implied by the k instruments used for "1;t. The relevance condition (4) is captured by the non-zero coe¢ cients that
enter the matrix in the (2,1) block of eG; the orthogonality (exogeneity) conditions (5) correspond to the block of k(n k) zeros in the position (2,2) of eG. However, the relevance and orthogonality conditions are not su¢ cient alone to recover all structural shocks in "t= ("01;t; "02;t)0. Angelini and Fanelli (2019) derive the necessary and su¢ cient
rank conditions and the necessary order conditions for this to happen, and show that it is necessary to impose some "additional" constraints on the coe¢ cients of B1, and B2
that form the matrix eG in (8). (See also the Supplementary Appendix in Olea, Stock, and Watson (2020).)
Two remarks are in order. First, our analysis covers the case r = n, namely we can potentially instrument all the structural shocks of the …scal SVAR, a novelty in the proxy-SVAR literature which we will employ in Section 4.4. Second, while for k > 1 the matrix of relevance parameters must be nonsingular, it needs not be diagonal, meaning that a single instrument in vz;t, say vz;i;t, may instrument not only
the structural shocks "1;i;t but, potentially, also other shocks in "1;t.15 More important, 14See Arias, Rubio-Ramírez, and Waggoner (2018) for a similar speci…cation based on the "A-model"
and a Bayesian approach.
15Similarly, Mertens and Ravn (2013) consider narrative accounts of shocks to average personal
income (PI) and corporate income (CI) tax rates for the US to identify two tax shocks (k = 2), and observe that (p. 1223) "it appears inappropriate to treat the narrative PI (CI) tax changes as
under certain restrictions on the coe¢ cients of B1, and B2 that form the matrix eG
in (8), our analysis features cases where some proxies may violate the orthogonality condition. In other words, proxies used to instrument the shocks in "1;t may potentially
instrument also some of the shocks in "2;t, a scenario which is best understood by the
simple example discussed next.
If the SVAR model (9)-(10) is identi…ed, the matrix eG (as well as the non-zero parameters in e (L)) can be estimated via maximum likelihood.16 When the restrictions
on eG are overidentifying, likelihood ratio tests for the overidenti…cation restrictions provide an empirical assessment of the estimated proxy-SVAR.
AC-SVAR: One proxy for two structural shocks. To shed light on our ap-proach, we discuss a speci…c example where one proxy is used to instrument two shocks. We build our argument in two steps, starting with the standard case of one instrument for one shock before moving to the one proxy - two shocks case. Anticipating what we will do in Sections 4.2 and 4.3, suppose we use a measure of TFP as instrument for the output shock. Then, the counterpart of (3) in our baseline model reads as follows:
0 @ utr t ugt uyt 1 A = 0 @ btr;tr btr;g bg;tr bg;g by;tr by;g 1 A B2 "tr t "gt + 0 @ btr;y bg;y by;y 1 A B1 "yt; (12) where ut = (utrt ; u g t; u y
t)0 is the vector of the VAR innovations, utrt is the disturbance
associated with the equation for tax revenues, ugt is the disturbance associated with
the equation for …scal spending, uyt is the disturbance associated with the equation for
output, "trt and " g
t denote the tax and the …scal spending shock (respectively), and " y
t is
the output shock, which in this example is directly instrumented (k = 1) by the TFP proxy. Such proxy is denoted vtT F P, and the counterpart of (6) is given by the equation
vtT F P = 1"yt + !T F Pt (13)
where 1 = Cov(vtT F P; " y
t) is the relevance parameter which captures the connection
between the TFP proxy and the output shock, and !T F P
t is the associated measurement
uncorrelated with exogenous shocks to the corporate (personal) tax rate". Thus, Mertens and Ravn (2013) estimate a "full" matrix (not a diagonal one) and impose the additional restrictions necessary to identify the two shocks other the two proxies elsewhere in their proxy-SVAR.
16When the restrictions that characterize eG are zero constraints, separable across columns, a
conve-nient way to study the identi…cation of the proxy-SVAR is to check whether the su¢ cient conditions for global identi…cation in Theorem 2 of Rubio-Ramírez, Waggoner, and Zha (2010) are met. See Angelini and Fanelli (2019) for some examples.
error with standard deviation !;T F P. As is known from standard proxy-SVAR analysis,
the TFP proxy alone would su¢ ce to identify the output shock under the condition 1 6=
0. However, to estimate the …scal multipliers, we need to achieve "full identi…cation", i.e., we also have to identify the non-instrumented …scal shocks in "2;t ("trt ; "
g
t)0. To do
so, we need at least one additional restriction other than the proxy, and in this example identi…cation is achieved by properly restricting the coe¢ cients b ; in the block B2 in
(12). We consider two constraints. First, btr;g = 0, which maintains that tax revenues
do not instantaneously respond (within the quarter) to the …scal spending shock. By imposing btr;g = 0, we obtain a just identi…ed model. Second, following Blanchard and
Perotti (2002) and Mertens and Ravn (2014), we posit that …scal spending does not react contemporaneously (within the quarter) to changes in economic activity captured by the output shock, i.e. bg;y = 0 in the block B1 in (12). Overall, the TFP proxy and
the conditions btr;g = 0 and bg;y = 0 imply the following structure for the matrix eG in
(8): e G = 0 B B @ btr;tr 0 btr;y 0 bg;tr bg;g 0 0
by;tr by;g by;y 0
0 0 1 !;T F P
1 C C
A : (14)
It can be shown that the AC-SVAR model in (14) is overidenti…ed, which implies that it is testable.17
We next move to the case of interest, where one proxy is used to instrument for two shocks. Economic intuition suggests that tax revenues are cyclical, hence TFP shocks may be behind their volatility as well. In this case, the equation for the TFP proxy becomes
vtT F P = 1"yt + 2"trt + !T F Pt (15)
where 1 has the same interpretation as before, while 2 = Cov(vT F P
t ; "trt ) is the
rele-vance parameter which captures the relationship between the TFP proxy and the tax shock. Equation (15) relaxes the orthogonality of the TFP proxy to the tax shock and keeps the orthogonality to the …scal spending shock unchanged. Is the model identi…ed? Now, the counterpart of the matrix eG in (8) is:
e G = 0 B B @ btr;tr 0 btr;y 0 bg;tr bg;g 0 0
by;tr by;g by;y 0
2 0 1 !;T F P
1 C C
A (16)
17Observe that in this example …scal elasticities of tax revenues and …scal spending to output can
which is the same as in (14), the only di¤erence being the non-zero parameter 2 in the
…rst column. As before, it is possible to show that the AC-SVAR model is just identi…ed. This proxy-SVAR nests the previous one, which holds under the orthogonality condition
2 = 0. Hence, 2 can be estimated, along with the uncertainty surrounding its point
estimate. A con…dence interval around 2 can be interpreted as prima facie evidence on the relationship between the TFP proxy and tax shocks. Notice that hypotheses of the type 2 = 2, where 2 are guess values for the relevance parameter, are over-identifying and hence testable against the data.
Data and instruments. Our baseline model includes the following endogenous variables: gross domestic product, yt, real per-capita federal tax revenue, trt, and
gov-ernment spending, gt. The last series is de…ned as the sum of government consumption
and investment. Following Caldara and Kamps (2017), these series are expressed in logs and per capita terms and are detrended by removing a linear trend via OLS re-gressions.18 Thus, Y
t= (yt; trt; gt)0 is the vector of endogenous variables in our baseline
speci…cations. We also consider speci…cations that also include consumer price in‡ation
t and the 3-month (nominal) Treasury bill rate it, hence Yt = (yt; trt; gt; t; it)0 is the
vector of endogenous variables of our "extended" model.
As anticipated in the Introduction, we include up to four proxies (considering the extended model) in the vector Zt to achieve identi…cation, two …scal instruments and
two non-…scal ones. The two …scal instruments are Mertens and Ravn’s (2011) series of unanticipated tax shocks (denoted M R), which is a subset of and Romer and Romer’s (2010) shocks identi…ed by studying narrative records on tax policy decisions, and a novel series of unanticipated …scal spending shocks inspired by Auerbach and Gorod-nichenko’s (2012) contribution (denoted AG). This latter proxy is the residual of the OLS regression of the log of …scal spending over a linear trend, the spending news shocks series proposed by Ramey (2011), and three lags of output, …scal spending, tax revenues (all in logs), and Ramey’s series. The idea of controlling for the contemporaneous (as well as the past) realizations of Ramey’s (2011) anticipated shocks is that of focusing on the truly unanticipated component of …scal spending, which is our object of inter-est here. As stressed by Mertens and Ravn (2014), using instruments that confound unanticipated and news shocks may lead to a failure of the exogeneity assumption, and therefore invalidate the econometric analysis.
Turning to non-…scal instruments, the instrument employed for the output shock is
18All the results of the paper are robust to re-estimating the VAR with variables in log-levels and
the total factor productivity series by Fernald (2014), denoted T F P , which is adjusted for changes in factor utilization. Finally, when working with an "extended" version of our framework which also includes in‡ation and a policy rate, we use the oil shocks series by Hamilton (2003), denoted OIL, which is a nonlinear function of the changes in the nominal price of crude oil.19
Estimation and bootstrap inference. We estimate our model with quarterly US data, sample: 1950Q1-2006Q4. This sample choice facilitates the comparison of our results with those documented in the literature (see e.g. Caldara and Kamps (2017), Mertens and Ravn (2014)). Moreover, it avoids us the need of facing the challenging estimation of the …scal multipliers in presence of the zero lower bound (for contributions on this issue, see Christiano, Eichenbaum, and Rebelo (2011) and Wieland (2018)). The SVAR for Yt includes p = 4 lags of the endogenous variables and a constant. The
corre-sponding AC-SVAR speci…cation is obtained by appending the external instrument(s) Zt to Yt, forming a SVAR system for Wt modeled as in (9)-(10). As already observed,
instruments alone do not generally carry enough information to identify all the elements of the matrix eGin (8) that are needed to compute the …scal multipliers. In such cases, restrictions on the matrices B1, and B2 will be employed to achieve (full)
identi…ca-tion. These additional restrictions are discussed case-by-case in the next secidenti…ca-tion. The model is estimated by maximum likelihood.
Bootstrap inference on the impulse response functions computed from proxy-SVARs has recently been debated by Mertens and Montiel Olea (2018), Jentsch and Lunsford (2019b), Mertens and Ravn (2019), Jentsch and Lunsford (2019a), and Olea, Stock, and Watson (2020). Elaborating on results by Brüggemann, Jentsch, and Trenkler (2016), Jentsch and Lunsford (2019a) show that asymptotic inference in these models is still "standard" (i.e., based on the Gaussian distribution, albeit the expressions for the asymptotic covariance matrices of the estimators may be rather complex) under fairly general conditions on the VAR innovations ut and the instruments vz;t. These
include two main situations that are relevant for our estimates. One is the occurrence of conditionally heteroskedastic (e.g. ARCH-type) VAR innovations, a feature that we …nd in the data. The other is the case in which the dynamics of the external instruments
19All series but the instrument inspired by the Auerbach and Gorodnichenko (2012) paper are
avail-able in the replication package of the Caldara and Kamps (2017) paper, which is availavail-able at Dario Caldara’s webpage: https://sites.google.com/view/dariocaldara/publications . Our AG instrument is available upon request.
is not as in (6) but is approximated by the zero-censored model:
vz;t= Dt( "1;t+ !t) (17)
where Dtis a k kdiagonal matrix with dummy variables on the diagonal that play the
role of zero censoring the proxy. In particular, let Di;t be the dummy associated with
the proxy vz;i;t, i = 1; ::k, then Di;t takes value 1 with probability pi and value 0 with
probability 1 pi, implying that vz;i;t can be either zero (with probability 1 pi) or can
take both positive and negative values (with probability pi). In the empirical analyses
discussed in the next section, Mertens and Ravn’s (2011) series of unanticipated tax shocks, M Rt, is characterized by a type of dynamics consistent with (17). Jentsch
and Lunsford (2019b) show that in these situations, the MBB method is the resam-pling scheme which correctly reconstructs the variability of estimated impulse response functions (see also Jentsch and Lunsford (2019a)).
Based on these observations, we apply the MBB resampling scheme to build con…-dence bands for estimated parameters of interest and the estimated …scal multipliers.
Multipliers. As in Blanchard and Perotti (2002), Auerbach and Gorodnichenko (2012, 2013), Chahrour, Schmitt-Grohe, and Uribe (2012) and Caldara and Kamps (2017), we de…ne the …scal multiplier as the dollar response of output to a shock of size one dollar.
Let P be either the level of …scal spending G or the level of taxes T R (not in logs); GDP be the level of output (not in logs); yh be the response of log-output at horizon
h to a …scal policy shock; and p0 be the impact of the …scal policy shock to the
corresponding …scal variable expressed in logs. Then, the multiplier is de…ned as
Mph = ( yh= p0)(GDP=P )
where GDP=P is a policy shock-speci…c scaling factor converting elasticities to dollars. As in Caldara and Kamps (2017), we set the scaling factors for the two shocks of interest (unexpected change in …scal spending and tax revenues) to their sample means on the estimation period, i.e., (GDP=G) 1 = 0:20 and (GDP=T ) 1 = 0:18, respectively.20 We
consider positive …scal spending shocks and negative tax shocks to compare multipliers related to shocks expected to have a positive e¤ect on output.
20This de…nition of the …scal multipliers enhances the comparability of our results with those
4
Results
Our exercises cover three scenarios. First, we document the empirical …ndings obtained by relying only on …scal instruments for the identi…cation of …scal spending and tax revenues shocks in our model. We then explore the polar opposite case, i.e., the one in which we use only TFP, i.e., a non-…scal instrument, to identify output shocks in …rst place and then recover the output e¤ects of …scal shocks via the moments associated to the covariance matrix of the residuals. A key result is that di¤erent assumptions on the correlation between TFP shocks and tax revenues shocks lead to dramatically di¤erent estimates of the tax multiplier. Instead, the estimates related to the output e¤ects of …scal spending shocks are relatively robust across scenarios. We then discuss the link between di¤erent estimates of the output-tax elasticity and the corresponding tax multiplier. Finally, we show that our results are robust to estimating …scal shocks by working with all available instruments in a joint fashion, i.e., we instrument both …scal and non-…scal shocks with …scal and non-…scal proxies.
4.1
Fiscal instruments only approach
Fiscal spending shock: Auerbach and Gorodnichenko’s (2012) instrument. We begin our analysis by instrumenting the …scal spending shock with our novel AG proxy, which is meant to identify unexpected changes in …scal spending. In this case, Yt = (yt; trt; gt)0, Zt = (AGt), and "1;t "gt, and we estimate an AC-SVAR model
for Wt = (Yt0; Zt)0 = (yt; trt; gt; AGt)0, where therefore the last equation pertains to
the proxy. While the proxy AGt identi…es the …scal spending shock "gt, we achieve just
identi…cation of all shocks (i.e. also the tax shock and the output shock in "2;t ("trt ; " y
t))
by imposing that …scal spending does not instantaneously respond to output shocks.21
For brevity, the maximum likelihood estimates of the eG matrix along with 68%-MBB con…dence intervals for the estimated parameters are con…ned in the Appendix.
Figure 1 (left panel) plots the …scal spending multiplier obtained from this speci-…cation. The on-impact multiplier (Mg0 in our notation) is about 1.1, it increases to
21Formally, this is the constraint b
g;y= 0 discussed in Section 3 (albeit for a di¤erent proxy-SVAR).
Blanchard and Perotti (2002) impose a zero contemporaneous response of …scal spending to all shocks a¤ecting output. The two restrictions are equivalent if output is not a¤ected by …scal shocks at time t. If it is, our restriction is less stringent than Blanchard and Perotti’s (2002). The di¤erence in these restrictions is due to the fact that they work with an "AB-model" (Lütkepohl (2005)) which accounts also for the contemporaneous relationships among the variables. Di¤erently, we work with a "B-model", which focuses directly on the mapping going from the structural shocks to the VAR innovations.
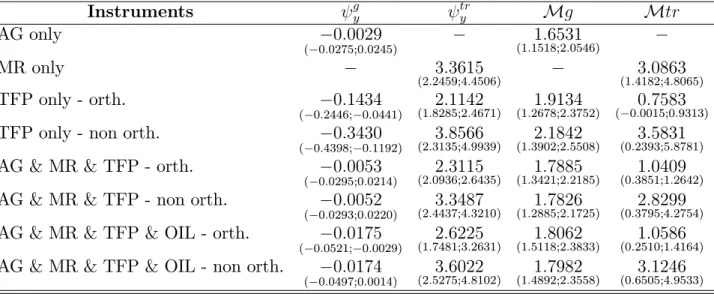
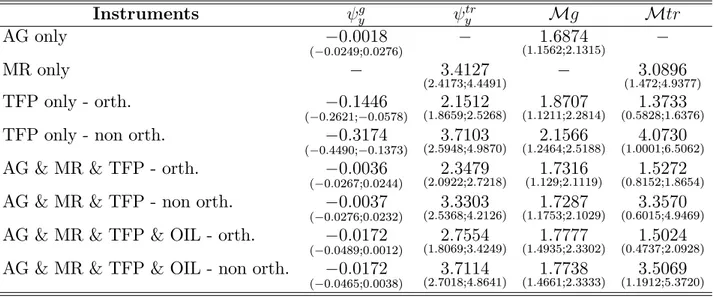
about 1.6 after two quarters, it stays at that level for about one year, then it grad-ually declines. The con…dence interval associated with the peak multiplier, reported in Table 1, ranges from 1.1 to 2. While the just identi…ed model cannot be o¤ered formal statistical support by the overidenti…cation restriction test, we notice that the estimated relevance parameter which connects the AGt instrument to the …scal shock
"gt is bAG = 0:0129, is strongly signi…cant, and implies a correlation of 96% with the identi…ed …scal shock.
Table 1 collects our estimate of the output-spending elasticity, which we recover via the expression gy = ( fGI3;1= fGI3;3), where fGI Ge 1, and fGIi;j is the element located
in the i-th row and j-th column of the fGI matrix. Caldara and Kamps (2017) show that the …scal policy coe¢ cient gy is negatively related to the …scal spending multiplier
Mg0 for values of gy which are below 1:8. We obtain a point estimate of ^ g
y = 0:0029.
The associated con…dence interval is (-0.027, 0.025), and suggests that the population parameter is not statistically di¤erent from zero. This …nding supports Blanchard and Perotti’s (2002) choice of calibrating such elasticity to zero. Caldara and Kamps’(2017) analytical derivations show that a zero elasticity implies an on-impact multiplier equal to 1, which is in line with what we …nd.
Tax shock: MR instrument. We now turn to the identi…cation of the tax rev-enues shock. The instrument we use is the series of unanticipated tax shocks produced by Mertens and Ravn (2011b), which we label M R. Since Yt = (yt; trt; gt)0, Zt= (M Rt)
and "1;t "trt , we estimate an AC-SVAR model for Wt = (Yt0; Zt)0 = (yt; trt; gt; M Rt)0,
where the last equation models the instrument M Rt. In this case M Rtidenti…es directly
the tax shock "tr
t but, consistently with the previous case, we achieve identi…cation of
all shocks (i.e. also the …scal spending shock and the output shock in "2;t ("gt; " y
t))
by imposing the restriction that …scal spending does not instantaneously respond to output shocks.
The point estimate of the relevance parameter for the M Rt instrument is bM R =
0:043, which implies a correlation of 27% with the identi…ed tax shock. Figure 1 (right panel) plots the implied tax multiplier. As one can appreciate, this multiplier is large, takes the value of 2.1 on impact (Mtr0) and a peak value of 3.1 after three quarters.
The size of the multiplier is in line with the estimates by Mertens and Ravn (2014) and part of the literature cited therein. The con…dence interval for the peak tax multiplier - reported in Table 1 - ranges from 1.4 to 4.8. We then recover the output-tax elasticity as try = ( fGI2;1= fGI2;2): Conditional on the estimated model, the point estimate is
btry = 3:36, close to that reported in Mertens and Ravn (2014) who …nd it to be equal to 3.13, and to that documented in Mertens and Ravn (2011a), which is equal to 3:7. Moreover, as shown by Caldara and Kamps (2017), our estimate is close to the one resulting from the sign restrictions approach by Mountford and Uhlig (2009), which is 3. Our con…dence interval for try is (2.25, 4.45). Although our intervals re‡ect
some uncertainty about the value of this elasticity, the lower bound remarks that the estimated size is reasonably higher than the value 2.08 used by Blanchard and Perotti (2002), who rely on an application of the OECD methodology documented in Giorno, Richardson, Roseveare, and van den Noord (1995), and is considerably higher than the value 1.7 produced by Follette and Lutz (2010) for the US economy. We postpone the discussion on the plausibility of an output-tax elasticity around 3 to Section 4.3.
4.2
TFP only approach
Caldara and Kamps (2017) employ non-…scal instruments to identify …scal shocks. They do so by estimating …scal policy rules …rst, and then they recover the impulse vector (i.e., the on impact responses of output and …scal variables) of interest by combining the estimated elasticities with the information coming from the covariance matrix of the VAR residuals.22 Following them, we use the Fernald (2014)’s measure of TFP adjusted for factor utilization, T F Pt, which we use as an instrument for output shocks. While
such shocks are not of direct interest for the computation of the …scal multipliers, the information related to their impulse vector can be fruitfully combined with that of the covariance matrix of our VAR to achieve full identi…cation and recover the output e¤ects of …scal spending and tax shocks. Thus, we have Yt = (yt; trt; gt)0, Zt = (T F Pt) and
"1;t "yt, and we estimate an AC-SVAR model for Wt = (Yt0; Zt)0 = (yt; trt; gt; T F Pt)0,
the last equation of the system pertaining to T F Pt, with innovation vT F Pt .
To identify the three structural shocks of the system, we supplement the TFP proxy with the two restrictions btr;g = 0 and bg;y = 0 discussed in Section 3, and summarized
in the structure of the matrix ~G in (14). While bg;y = 0 (…scal spending does not
in-stantaneously respond to output shocks) is consistent with the proxy-SVARs estimated in the …scal instruments only approach, the restriction btr;g= 0 (tax revenues does not
instantaneously respond to …scal spending shocks) is necessary for the identi…cation of the model. The proxy-SVAR is overidenti…ed, and the overidenti…cation restrictions test returns a p-value of 0.41, which leads to not rejecting the model speci…cation. The
22For an early study on the connection between policy rules and policy shocks with an application
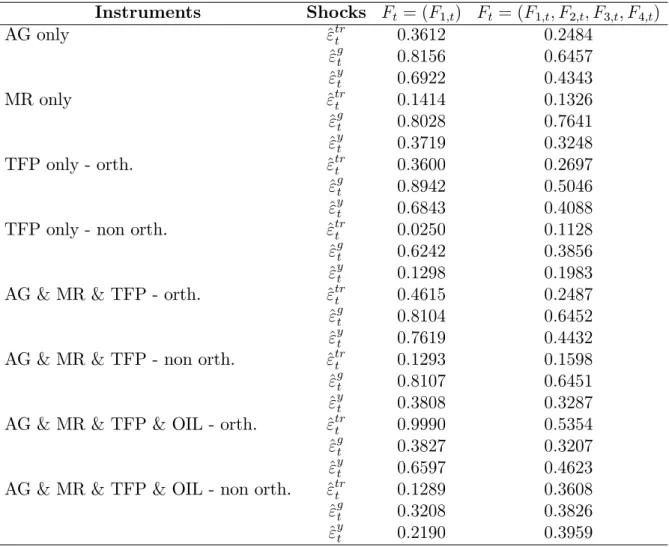
point estimate of the relevance parameter is b1 = 1:86, which implies a correlation of
57% with the identi…ed output shock.
As shown by Figure 1, the point estimates of dynamic …scal spending multipliers identi…ed with TFP shocks turns out to be in line with the ones computed with the AG instrument. The impact multiplier (Mg0) is equal to 1.1, while the peak - which
occurs after two quarters - is equal to 1.9, and the associated con…dence interval ranges from 1.3 to 2.4. The point estimate of the elasticity of …scal spending to output gy is negative, and zero is not included in the con…dence interval (even though the upper bound is very close to zero). Overall, these results are close to those reported in Caldara and Kamps (2017).
Turning to the tax multiplier, we estimate it to be substantially lower that the one obtained with the MR instrument. On impact, the multiplier is estimated to be 0.4, and the peak value - 0.76 - realizes …ve quarters after the shock. The con…dence interval for the peak tax multiplier ranges from a value slightly less than zero to 0.93. Figure 1 shows that the drop of the tax multiplier relative to the MR case is substantial for at least 25 quarters after the shock. What is the driver of this drastic change in the tax multiplier when moving from the MR case to the TFP one? Table 1 collects the estimated value of the tax policy coe¢ cient try in this scenario, which is 2.1, with associated con…dence interval (1.8, 2.5). The estimated elasticity, as well as the associated con…dence interval, is signi…cantly lower than the estimate obtained when using the MR instrument only. The fact that lower values of the tax elasticity, try ;are associated with lower values of
the multiplier, Mtr; is consistent with the simulations proposed in Mertens and Ravn (2014), and with the analytical derivations documented in Caldara and Kamps (2017).
4.3
TFP only approach: Relaxing the TFP-tax shocks
orthog-onality condition
Evidence and implications for the multipliers. A crucial assumption behind the case entertained in the previous section is that of orthogonality of the TFP instrument with respect to the …scal shocks in our proxy-SVAR. Such exogeneity assumption is based on the well-known delays characterizing …scal spending decisions and implemen-tations (Blanchard and Perotti (2002)). Di¤erently, the assumption of orthogonality between TFP shocks and tax shocks is much more questionable, given that tax rev-enues are cyclical. Hence, one would expect TFP shocks a¤ecting output to a¤ect also ‡uctuations in tax revenues. A look at the data o¤ers support to this intuition. Figure
2 plots the contemporaneous correlations between the VAR residuals of output (^uyt), tax revenues (^uT Rt ), and public spending (^uGt) on the one hand, and TFP residuals on the other (^vT F P
t ). Such reduced form correlations point to a signi…cant (at a 1%
level) comovement not only between output residuals and TFP, but also between TFP and tax revenues residuals, a necessary condition for the TFP proxy to correlate with tax shocks. Di¤erently, the correlation between TFP and spending residuals is not signi…cantly di¤erent from zero.23
We interpret the evidence in Figure 2 as supportive of a speci…cation of the form (15), where the TFP jointly serves as an instrument for output shocks and tax shocks. The implication is that extra information from the data can be used to identify tax shocks, output shocks, government spending shocks and, eventually, the …scal policy multipliers, as implied by the structure of the matrix ~G in (16) for the "one proxy for two structural shocks scenario". Crucially, the relevance of the TFP instrument for the identi…cation of both output and tax shocks is supported by the data in the sense that the estimated coe¢ cient for the relevance of TFP proxy as an instrument for the output shock is b1 = 1:63 and implies a correlation with the output shock of 49.7%, while the estimated coe¢ cient for the relevance of TFP as an instrument for the tax shock is b2 = 0:89 and implies a correlations with the tax shock of -27%.
What are the implications for the multipliers? The peak …scal spending multiplier is estimated to be around 2 with con…dence interval ranging from 1.4 to 2.6. This …gure is slightly larger than, but not statistically di¤erent from, those found when imposing the TFP-tax shocks orthogonality condition. Quite di¤erently, the impact on the tax multiplier is dramatic, its peak value moving from 0.7 to 3.6. This latter …gure is statistically in line with the tax multiplier around 3 estimated with the M R instrument.
Statistical support to the relaxation of the TFP-tax shocks orthogonal-ity condition. Our results show that relaxing the orthogonality condition 2 =
Cov(vT F P
t ; "trt ) = 0 makes a key di¤erence as regards the size of the estimated tax
multiplier. The con…dence interval for 2 is (-1.51, -0.64). Mapped into the correlation 23Caldara and Kamps (2017) assess the exogeneity of the TFP instrument by regressing it over
Mertens and Ravn’s (2011) narrative measure of tax shocks and Ramey’s (2011) narrative measure of expected exogenous changes in military spending. They document individually and jointly insigni…cant estimated coe¢ cients, and conclude that the TFP instrument is exogenous. After replicating their estimates, we veri…ed that, when computing HAC standard errors, the t-statistic of the estimated coe¢ cient of the measure of tax shocks increases from 1:53 to 1:92, while the F-statistic goes from 1:44 up to 1:88. The use of HAC standard errors in the regression for the TFP instrument is motivated by the signi…cant …rst-order autocorrelation in the disturbances.
with the identi…ed tax shock, this implies values in the range (-40%, -19.5%). Notably, for each …xed value 2 = 2, the proxy-SVAR is overidenti…ed, hence testable by the
overidenti…cation restrictions test. We conduct such test by proceeding as follows. We consider three guess values of the parameter 2 which belong to the estimated 68% con…dence interval. The values we consider are: i) 2 = 1:51, which corresponds to the lower bound of the con…dence interval; 2 = 1 (central value of the con…dence interval); and 2 = 0:64 (upper bound of the con…dence interval). The p-values as-sociated with the overidenti…cation restrictions test in these three cases are 0.25, 0.87 and 0.75, respectively. Hence, the data support the proxy-SVAR where the TFP proxy simultaneously correlate with output and tax shocks. Admittedly, allowing for this non-zero correlation does not come without costs. The con…dence interval for the peak tax multiplier ranges from 0.2 to 5.9, hence it tends to be larger relative to the con…dence interval obtained with the M Rt instrument alone. We will discuss this issue in more
depth when we present the results obtained when using multiple instruments.
Driver of the large tax multiplier. What is the driver of the substantial di¤er-ence between the small tax multiplier found when imposing the TFP-tax shocks orthog-onality and the one around 3 obtained by relaxing such restriction? Mertens and Ravn (2014) and Caldara and Kamps (2017) document the mapping between the output-tax elasticity and the tax multiplier. In particular, Caldara and Kamps (2017) derive an analytical expression for the tax multiplier and show that, if try 2 ( 1; 4) range, there is
a positive correlation between the elasticity and the multiplier. Table 1 documents the substantial change in such elasticity when the TFP-tax shocks orthogonality is relaxed, with btry moving from 2.1 (orthogonality imposed) to 3.8 (non orthogonality allowed). This latter number is pretty close to the 3.7 estimate provided by Mertens and Ravn (2011a), who employ long run restrictions to identify movements in output due to a technology shock to tackle the tax-output endogeneity bias. Moreover, the associated con…dence interval (2.3, 4.9) implies that estimates around 3 that are often found in the literature are statistically equivalent to ours. Our Appendix formally shows the downward bias that a¤ects the estimate of the output-tax elasticity if the econometrician misses to model the correlation between TFP and tax shocks in a world in which such correlation is actually present.
Output-tax elasticity equal to 3: How sensible? As stated above, Blanchard and Perotti (2002) rely on an output-tax elasticity equal to 2.08, which is the one esti-mated by the OECD (Giorno, Richardson, Roseveare, and van den Noord (1995)). Such
elasticity is slightly larger than that estimated by Follette and Lutz (2010) on yearly data (1.7). Instead, our results rely upon output-tax elasticities equal to 3 or larger. Are such large elasticities sensible? Mertens and Ravn (2014) critically review the construc-tion of output-tax elasticity by the OECD, which is a weighted average of the output elasticities for di¤erent tax revenue components (personal income taxes, social security contributions, indirect taxes and corporate income taxes). Each component-speci…c elasticity is a product of two elasticities, i.e., the tax base-tax revenues one and the output-tax base one. Mertens and Ravn (2014) point out that, while both elasticities are (somewhat necessarily) computed by relying on many questionable assumptions, the second one in particular is typically estimated via OLS regressions that do not tackle the obvious endogeneity issue a¤ecting the output-tax relationship. Importantly, Mertens and Ravn (2014) show that such endogeneity issue is likely to induce a negative bias in the estimated output-tax elasticity. As pointed out above, Mertens and Ravn (2011a) tackle this bias by estimating the response of the US federal tax revenues to a technology shock identi…ed with long run restrictions, and …nd a value for the elasticity equal to 3.7. Caldara and Kamps (2017) derive the output-tax elasticity implied by the sign restriction approach pursued by Mountford and Uhlig (2009), and …nd a value equal to 3. Overall, a value of the output-tax elasticity equal to 3 or larger does not seem at odds with the US data.
4.4
Multiple instruments approach
As stressed in the Introduction and in Section 3, the AC-VAR methodology we work with allows us to jointly employ multiple instruments. We then combine all instru-ments used so far (both …scal and non-…scal) and re-estimate both multipliers. This way to proceed adds further moment conditions and, therefore, information (if the mo-ment conditions are supported by the data). Formally, we work with Yt = (yt; trt; gt)0,
Zt = (AGt;M Rt; T F Pt), and we estimate an AC-SVAR model for Wt = (Yt0; Zt0)0 =
(yt; trt; gt; M Rt; AGt; T F Pt)0. To our knowledge, this is the …rst instance in the
proxy-SVAR literature in which the number of employed external instruments k is the same as the number of variables n the original SVAR comprises, i.e., all shocks in the VAR are instrumented.
Given the role played by the TFP-tax shocks orthogonality condition for the esti-mation of the tax multiplier, we analyze two cases, one in which we impose the orthog-onality condition, and the other one in which we do not.