A
A
l
l
m
m
a
a
M
M
a
a
t
t
e
e
r
r
S
S
t
t
u
u
d
d
i
i
o
o
r
r
u
u
m
m
–
–
U
U
n
n
i
i
v
v
e
e
r
r
s
s
i
i
t
t
à
à
d
d
i
i
B
B
o
o
l
l
o
o
g
g
n
n
a
a
Dottorato di Ricerca in
Scienze e Tecnologie Agrarie, Ambientali e Alimentari
Ciclo XXVI
Settore Concorsuale di afferenza 07/F1
Settore Scientifico disciplinare AGR/15
PhD Dissertation
S
ENSORY AND
INSTRUMENTAL PROFILING OF APPLES:
A
N
EW
T
OOL FOR
Q
UALITY
A
SSESSMENT
Dr. Maria Laura Corollaro
Coordinatore Dottorato
Chiar.mo Prof. Giovanni Dinelli
Relatore
Chiar.mo Prof. Luca Corelli Grappadelli
Correlatore
Dott.ssa Flavia Gasperi
A Nonno Antonio.
Da persona lungimirante e appassionata
hai insegnato a noi nipoti il valore della cultura.
Grazie.
T
ABLE OF
C
ONTENTS
Chapter I
A
N
O
VERVIEW OF
S
ENSORY
Q
UALITY OF
A
PPLE
F
RUIT
THE PERCEPTION OF QUALITY IN APPLES page 9
METHODOLOGICAL ASPECTS 10
Sensory profiling 10
The link to the consumer 13
Relationship between Sensory and Instrumental Data 15
Texture parameters 16
Flavour parameters 19
Overall profile 21
Consumer preferences 23
APPLICATION OF SENSORY ANALYSIS IN APPLE STUDIES 24
Pre-harvest factors: some examples 24
Post-harvest changes of apple sensory properties 27
Breeding studies 29
Chapter II
S
ENSORY
P
ROFILING OF
A
PPLE
:
M
ETHODOLOGICAL
A
SPECTS
,
C
ULTIVAR
C
HARACTERISATION AND
P
OSTHARVEST
C
HANGES
INTRODUCTION 34
MATERIALS AND METHODS 38
Plant Materials 38
Apple sampling 38
Sample preparation 39
Sensory analysis 40
Panel selection and training 40
Sensory profiling 40
Statistical analysis 41
RESULTS AND DISCUSSION 42
Method validation 42
Panel performance and vocabulary validation 42
Sample preparation procedure 45
Cultivar sensory profiling 46
Sensory profiling during postharvest 48
CONCLUSIONS 51
TABLES 53
Chapter III
A
C
OMBINED
S
ENSORY
-I
NSTRUMENTAL
T
OOL FOR
A
PPLE
Q
UALITY
E
VALUATION
INTRODUCTION 62
MATERIALS AND METHODS 65
Plant materials 65
Sensory analysis 66
Instrumental analyses 68
Colour analysis 68
Texture analysis 68
Juice extraction and dry matter concentration 68
Basic chemical measurements 69
Statistical analysis 69
Panel performance evaluation 70
RESULTS AND DISCUSSION 70
Apple profiling 70 Sensory-instrumental relationship 73 Predictive models 74 Appearance attributes 75 Texture attributes 75 Flavour attributes 78 CONCLUSIONS 80 TABLES 82
FIGURES 87
Chapter IV
S
ENSORY
P
ROPERTIES OF
A
PPLES
G
ROWN IN
D
IFFERENT
C
LIMATIC
C
ONDITIONS
INTRODUCTION 90
MATERIALS AND METHODS 91
Plant material 91
Sensory analysis 92
Texture analysis 92
Basic chemical composition 93
Cell anatomy analysis 93
Statistical analysis 94
RESULTS AND DISCUSSION 94
Sensory profiling 94
Texture profiling and basic composition 96
Cell anatomy characterisation 97
CONCLUSIONS 98
TABLES 100
Chapter V
T
HINNING VIA
S
HADING AND THE
U
SE OF
P
HOTOSELECTIVE
N
ETS
:
T
HE
I
NFLUENCE ON
S
ENSORY
Q
UALITY IN
A
PPLES
INTRODUCTION 108
MATERIALS AND METHODS 110
Fruit material and sample preparation 110
Trained panel and sensory analysis 112
Instrumental analysis on fruit from sensory analysis 113
Instrumental analysis on other fruit 114
Statistical analysis 114
RESULTS 115
Sensory analysis 115
Instrumental analysis 116
DISCUSSION AND CONCLUSIONS 117
TABLES 122
FIGURES 125
Chapter VI
A
PPLICATION OF A
C
OMBINED
S
ENSORY
-I
NSTRUMENTAL
C
HARACTERISATION FOR THE
E
VALUATION OF
P
ROMISING
INTRODUCTION 128
MATERIALS AND METHODS 130
Plant Materials 130
Instrumental analysis 131
Sensory analysis 132
Statistical analysis 133
RESULTS 133
Product instrument evaluation 133
Sensory profile of the apple accessions 134
Sensory properties of new selections in relation to parentals 135
DISCUSSION 136
CONCLUSIONS 141
TABLES 142
FIGURES 148
G
ENERAL
C
ONCLUSIONS
AND
F
UTURE
P
ERSPECTIVES
155R
EFERENCES
157Chapter I
A
N
O
VERVIEW OF
S
ENSORY
Q
UALITY OF
A
PPLE
F
RUIT
T
HEP
ERCEPTION OFQ
UALITY INA
PPLESPerceivable quality of a horticultural product is strictly linked to its freshness. Freshness is considered the key factor that determines consumer preferences in fruit and vegetable purchases (Ragaert et al., 2004). A fresh product is defined by UNI EN ISO 7563:1998 as “a turgescent product with no signs of withering or ageing, the cells of which have not deteriorated”. Since “texture” is defined by UNI EN ISO 5492:1992 as “all the mechanical, geometrical and surface attributes of a product perceptible by means of mechanical, tactile and, where appropriate, visual and auditory receptors”, it is easy to conclude that texture properties are the main factors responsible for freshness and for related consumer choice (Péneau et al., 2006; Harker et al., 2008). It is important to realize that texture consists of a number of different properties, not a single one, perceived by means of human senses and that its definition implies a sensory evaluation (Bourne, 2002). Texture analysis is used by the food industry, in fact, to define and check physical properties of food products, through the use of mechanical and rheological measurements. If such measures are to accurately predict sensory perception of texture parameters, human assessment should be the standard against which instrument readings should be
calibrated. In this way, it would be possible to have a product which falls within the range of textural parameters that experience has shown to be acceptable to the consumer (Bourne, 2002; Harker et al., 2003).
Fruit shape, size, color, soluble solids content, acidity and firmness are the parameters most considered for defining apple quality standards. Compression measurements by penetrometry are the most widely used technique for firmness evaluation (Harker et al., 1997; Qing et al., 2008). Sensory analyses, instead, are not usually considered for general quality assessment of fruit. However, in the case of fruit like apples, texture properties are not dissociated from other properties, such as olfactory and gustatory ones, and consumer preferences are generally based on a combination of texture and flavour (Daillant-Spinnler et al., 1996; Harker et al. 2003; Gatti et al., 2011). These relationships justify a sensory-based approach as the starting point for implementing measurement tools that are effective in predicting human perception of apple quality.
M
ETHODOLOGICALA
SPECTSSensory profiling
Sensory analysis is the only approach able to provide a direct evaluation of sensory properties and an overall product profile, rather than studying just one attribute at a time. In addition, it is also suited to giving an objective meaning to sensory perception, in qualitative and quantitative terms. Sensory analyses, in fact, have the aim of describing products in an objective way, characterising them by scientific
criteria, and defining perceivable differences (Murray et al., 2001). For these reasons, sensory analyses requires scientific competency and appropriate facilities, such as laboratories specifically equipped for performing sensory tests. Although sensory analyses use a scientific approach, they are able to explain perceivable quality of food by using a language which is close to that of the consumer (Swahn et al., 2010; Seppä et al., 2012).
Descriptive analysis is the most sophisticated of the sensory methodologies available. It requires a panel of trained judges to score the intensity of a series of specific attributes of a product on a linear or numerical scale. The result of such analysis consists of a complete description of sensory properties of one or more products that are related to appearance, odour, flavour and texture. Moreover, it provides the basis to map similarities and differences and to highlight which sensory attributes are important to consumer acceptance (Stone and Sidel, 2004a).
Until 1996, there were no studies that established that the sensory properties evaluated through instrumental tests could actually represent the attributes which are really important for consumer choice (Daillant-Spinnler et al., 1996).
In general, not all studies applying sensory analysis to apples report details about the sensory methodologies that were employed: some aspects, such as vocabulary development, panel selection and judge performance, were often not sufficiently described and discussed to be fully understood. In most studies the attributes were chosen by a brain-storming among the judges (Daillant-Spinnler et al., 1996; Allan-Wojtas et al., 2003). In other cases, the sensory vocabulary was proposed by the panel leader (Karlsen et al., 1999; Harker et al., 2002a, 2002b; Harker et al., 2006).
data often proposed a specific set of sensory descriptors which might fit with the sensory meaning given to the instrumental measures. Hence texture sensory properties might have been defined for physical measurements or flavour attributes for volatile compounds analysis (Karlsen et al., 1999; Ioannides et al., 2007; Chauvin et al., 2010). Many studies referred to ISO standards for general sensory analysis methodologies and panel selection (Karlsen et al., 1999; Echeverría et al., 2008), whereas Daillant-Spinnler et al. (1996) provided a detailed description of panel training, specific for apple profiling.
One of the few papers providing detailed information about panel performance evaluation was by Hampson et al. (2000), who proposed a tool to analyse judge consistency and performance over several years. Accuracy of sensory data is of fundamental importance: if sensory data are not reliable, i.e. consistent and discriminant, with a good agreement among the judges, sensory profiles are not reliable and any prediction models can show low effectiveness.
An important consideration comes from the work by Brookfield et al. (2011), who focused on explaining the wide range of different correlations between sensory and instrumental data that can be observed in the literature, and concluded that such variability probably depends on the different cultivars tested in each study – different cultivars tend to respond in a different way to the various models that are used. Their conclusion suggests that a very large set of apple cultivars should be considered in such studies in order to cover the range of variability that can occur within different apple properties.
The link to the consumer
After defining a product sensory profile it is necessary to identify which attributes are important to the consumer and in which way.
With regard to the sensory definition of freshness, the main attributes used by the consumer to judge apple freshness are crunchiness, juiciness and mealiness. The first two of these are considered to be positive factors, while the last one is negative (Péneau et al., 2006; Oraguzie et al., 2009).
Crunchiness is an acoustic attribute, evaluated as the intensity and frequency of the sound produced by chewing (Duizer, 2001; Fillion and Kilcast, 2002). Juiciness is associated with a tactile sensation; it represents the juice amount released by the product during chewing (Harker et al., 2002a; Ioannides et al., 2009). Mealiness is a qualitative defect, appearing as dry and “sandy” flesh which breaks down into fine particles as consequence of the weakening of intercellular bonding. In mealy apples, fractures occur as a result of cell-to-cell debonding, and individual cells do not break to release their contents (Harker et al., 2006; Echeverría et al., 2008).
Harker et al. (2003) highlighted an important feature that needs to be considered when studying apple preferences, that is, acceptability defines different consumer clusters that are characterised by preferences towards different sensory profiles. For example, it is possible to distinguish people who like crisp and sweet apples from others who like juicy and sour fruit. Often, specific groupings of preferred attributes are the result of expectations related to experience. Since clusters of genes associated with fruit quality usually change together, consumer preferences tend to link specific taste and texture properties because they are generally associated in different
cultivars (Harker et al., 2003). The differences in preferences can also be related to consumer age (the elderly tend to like softer and more sour apples; vice versa for children), or to nationality or ethnic group, determining a higher or lower familiarity towards different products (Prescott and Bell, 1995).
Wills et al. (1980) were among the first to study consumer liking and its relation to sensory properties. Daillant-Spinnler et al. (1996) studied the relation between sensory properties perceived by a trained panel and consumer preferences for different apple varieties. Texture and taste properties were considered more important by the consumers than aroma and appearance. Nevertheless, the relation between preferences and sensory profiles was not the same for all the cultivars: some of the cultivars appeared to be quite different based on sensory properties but very similar in terms of consumer preferences. The authors concluded that it is not possible to define a sensory property-based methodology useful to predict acceptance in absolute terms (Daillant-Spinnler et al., 1996). Jaeger et al. (1998) tested the hypothesis that consumers perceive apple mealiness as a negative attribute and show a higher preference for fresh apples, rather than stale ones. Fresh apples were evaluated as harder, juicer and crisper by a trained panel, while stored apples were described as old, stale and floury. The consumer test, in contrast with the results by Daillant-Spinnler et al. (1996), showed that the first dimension on the preference map was strongly related to flavour properties while the second dimension was related to texture differences. However, the conclusion was the same: although the trained panel highlighted perceivable differences related to storage treatment within each variety, acceptance appeared to be more strongly linked to the variety factor, irrespective of the mealiness level (Jaeger et al., 1998). Recently Bonany et al. (2014) performed a consumer preference test on several apple varieties in seven
different European countries. They defined an external preference map relating the consumer preferences to the sensory profile described by a trained panel and to instrumental characterisation, suggesting such a tool as useful for the positioning of the variety in the market and for leading breeding activities. However, even if sensory description and instrumental characterisation seemed to be well related, the authors stressed that it is not a simple task to interpret the results coming from preference tests in order to define practical standards of quality (Bonany et al., 2014). Moreover, Seppä et al. (2013b) found that the initial liking or disliking expressed by consumers toward an apple cultivar did not always reflect their final choice, since that choice was often influenced by other options the consumers had during the selection process. This result demonstrated that expressed preferences are not to be considered as a constant, but they are strongly dependent on the context.
Relationship between sensory and instrumental data
Although the importance of sensory analysis is unquestionable, these methods are expensive and time consuming and, for these reasons, these analyses are not always suited to practical use when many samples need to be analysed. It is, therefore, desirable to replace sensory evaluation by faster, simpler, or cheaper instrumental analysis. For these reasons several studies have examined correlations between sensory and instrumental data.
Texture parameters
Firmness is the most considered and studied texture parameter. In the study by Harker et al. (2002a), instrumentation tests showed that a minimum difference of 6-8 N in instrumental firmness with an 11mm probe puncture test was necessary to have a difference in sensory attributes perceived by a trained sensory panel. Below a minimum value of 50 N measured by the firmness test, the fruit were evaluated as being mealy by the trained panel. So, it is possible to define a critical puncture threshold, below which the apples are described as being mealy, and apple producers could define a threshold in their practical measures to ensure that mealy apples are excluded from a pack-out (Harker et al., 2002a). Chauvin et al. (2010), found a logarithmic relationship between physical properties of apples and the sensory scores determined from descriptive analysis, and reported that when apples are soft, humans are more sensitive to textural differences than instruments are. When apples are hard, the ability of panelists to perceive differences may decrease because of fatigue; thus, in this case, instrumental determination would be more reliable than the panelists’ (Chauvin et al., 2010). Nevertheless, in vivo measurements of texture properties proposed by Ioannides et al. (2007), by means of electromyography (EMG; that records facial muscle activity during apple chewing) when compared to penetrometry analyses, showed that penetrometry was only able to replicate the first bite, without providing information on the tissue modification that takes place in the mouth as a result of the chewing process. That factor was considered by the authors to be a limitation of penetrometry in providing effective data for predicting texture sensory properties (Ioannides et al., 2007). However, a limitation of psychological origin in the EMG tracing does exist: the volunteers tended to chew in a different way when
they were asked to evaluate some sensory attributes, rather than responding normally when there would be less stress and less need to concentrate (Ioannides et al., 2009).
Several authors have focused on the acoustic parameters. Apples, like all fresh vegetables, are composed of living cells, with cell walls fastened to each other by means of the middle lamella and subjected to turgor pressure, which is higher than the external atmospheric pressure. The breaking of the cell wall provokes the rapid expansion of the liquid content, responsible for the sound emission. Acoustic emission amplitude and frequency are strictly related to the perception of crispness and crunchiness, which are very complex concepts, combining a wide range of perceptions, such as sounds, fracture characteristics, density and geometry (Fillion and Kilcast, 2002). Study of consumer responses demonstrated that crispness is characterised by a sudden, clean fracture occurring when a crisp food is bitten. The noise emitted is perceived to be higher pitched and louder than the sound produced during biting crunchy foods, showing low pitch sounds and characterised by a certain degree of bone conduction. That is why the combination of acoustic and mechanical techniques more adequately describes food acoustic properties perception than either technique alone (Duizer et al., 2001). De Belie et al. (2002) studied the acoustic parameter of crispness that had been separately scored by a trained sensory panel by combining measurements taken by a microphone of the sound emitted during chewing of a sample coming from the same fruit. A fundamental limitation was the use of different subjects and different samples from the same fruit for sensory and instrumental measures: subjects involved in sensory analysis were not the same subjects involved in chewing recordings. The authors proposed that a better relationship between chewing sound and sensory data might be expected if the
(De Belie et al., 2002). Crispness and crunchiness have important cognitive implications: Demattè et al. (submitted) demonstrated that artificial modifications of specific frequencies of the sound perceived in real time during biting or chewing of apples significantly affects crispness perception, demonstrating that crispness is an attribute strongly related to the acoustic information coming from the food. Hardness perception was also found to be affected by sound modifications, although it is defined as a mechanical attribute, showing a multisensory interaction in hardness perception. Zdunek et al. (2010a) developed a contact acoustic emission detector, based on the simultaneous use of a puncture test and an acoustic emission detector in contact with the sample during the test. They found that total acoustic emission counts were a better predictor of texture sensory attributes evaluated by a trained panel than penetrometry firmness measurements alone, particularly with respect to crispness, crunchiness and hardness (Zdunek et al., 2010a). Costa et al. (2011) related mechanical and acoustic data recorded on apple samples during compression by a texture analyser to the texture sensory evaluation by a panel of experts. They found that the instrumental acoustic parameters were positively correlated to sensory crispness and negatively to firmness, suggesting an important role of acoustic parameters in the perception of crispness. Hence high crispness and high firmness were not dependent on each other and it should not be expected that they would be present together in any case (Costa et al., 2011).
The relationship between apple tissue anatomical features and texture properties has been studied by several authors (Allan-Wojtas et al., 2003; Mann et al., 2005; Billy et al., 2008). Allan-Wojtas et al. (2003) compared the sensory description of apples by a trained panel with a micro-structural analysis of the flesh matrix by microscopy. By defining groups of apple cultivars with common sensory profiles and studying the
structural properties representative of each group, they were able to describe the structural components responsible for specific sensory responses (Allan-Wojtas et al., 2003). Mann et al. (2005) correlated apple anatomical features and texture sensory properties, finding that cell number was important to the prediction of crispness and mealiness, suggesting that fruit with a fewer number of cells per unit area were crisper than fruit with a higher number of cells per unit area, while cell size predicted juiciness, suggesting that bigger cells release more juice (Mann et al., 2005). Useful interpretations come from Ting et al. (2013), who used X-ray tomography to study the anatomical features of different apple varieties and their relation to instrumental firmness. They found that different microstructural organization and the distribution, number, and size of intercellular spaces were responsible for different texture properties that were characteristic of different apple varieties. The work by Billy et al. (2008) found a relationship between texture sensory profile and water-soluble pectin (WSP) extraction analysis: mealiness and “fondant” attributes were positively and negatively correlated, respectively, to the concentration of galacturonic acid in the WSP extract.
Flavour parameters
Several authors have found difficulty in developing effective predictive models for taste in apples based on predicting flavour sensory perception from instrumental measures of compositional data. The main reason seems to be the multisensory nature of taste perception, characterised by interference from other sensory properties.
Harker et al. (2002b) found a good prediction for acid taste by titratable acidity, while soluble solids concentration showed a poor relation with perceived sweetness. These authors asserted that assessment of fruit by sensory analysis should remain a critical part of fruit quality assessment, since sweetness represents one of the most important factors affecting consumer liking (Harker et al., 2002b). Additional studies highlighted that influences between different sensory properties exist that are able to affect sweetness perception. Harker et al. (2006) demonstrated that sweetness perception depends on the degree of breakdown of apple flesh during chewing – i.e., it depends on textural properties – rather than on differences in sugar and acid content (Harker et al., 2006). Echeverría et al. (2008) found a relation between sweetness and mealiness perception scored by a trained panel, with high mealiness values being related to low sweetness values, even if no real correlation between the two sensory attributes was found. Another interesting conclusion from this work was that a low consensus in the panel was observed for those attributes having high interactions with others, e.g., sweetness (Echeverría et al., 2008).
The influence of other sensory properties can also be observed with aroma perception. Karlsen et al. (1999) looked for a correlation between sensory data and instrumental data coming from texture and volatile compounds (VOCs) analysis on several apple varieties. The highest correlations were obtained when sensory odour and flavour attributes were correlated at the same time to texture and VOCs instrumental data – the prediction of aroma perception seems to require information about apple texture properties. Differences in flavour release could be due to structural differences as every compound responsible for flavour has to be released from the apple matrix to come in contact with taste and olfactory receptors. Release kinetics are therefore influenced by the chewing process, the interaction with saliva,
and mouth temperature, which depend both on apple and on subject characteristics (Foster et al., 2011; Chen and Engelen, 2012). Moreover, Aprea et al. (2012) found that the interaction of the same volatile compounds when present at different concentrations can be responsible for the perception of different perceived odours or flavours. Ting et al. (2012) showed that nose-space proton-transfer reaction mass spectrometry analysis of volatiles released during apple consumption provides significant information about real flavour perception. They found that very different volatile profiles came from apple fruit during chewing, as compared to in vitro VOC measurements on the same apple cultivars, confirming that nose-space analysis provides data that better explain real consumer perception.
The general conclusion is that it is possible to obtain a better sensory attribute prediction if a larger number of instrumental and/or chemical measurements are taken into account when elaborating a model (Karlsen et al., 1999).
Overall profile
Non-destructive techniques have also been developed and applied to study overall apple quality, since resulting spectra developed from chemometric techniques can give a general overview of a product profile which can be used to predict sensory properties.
Mehinagic et al. (2003) tested the effectiveness of vis/NIR spectroscopy in predicting sensory properties. They found that mealiness was negatively and crispness positively correlated with spectroscopic data in the wavelength range corresponding
changes in their concentrations during ripening, which is a process that also involves structural modifications indicating why a relation between vis/NIR measures and some textural attributes might exist. Sweetness was negatively correlated and sourness positively correlated with absorbance at wavelengths corresponding to starch. Starch degradation during ripening is the basic mechanism for sugar production, responsible for sweet taste, while, concurrently, acid concentration tends to decrease. Despite these interesting results, the relationships were not strong enough in comparison with the better correlations observed between sensory data and penetrometry measures (Mehinagic et al., 2003). Rizzolo et al. (2010) used time-resolved reflectance spectroscopy (TRS), a technique which measures concurrently the absorption coefficient and the scattering coefficient at different wavelengths – the absorption coefficient is a measure related to the absorption of photons by pigments (chlorophyll, carotenoids) and by main chemical components of the flesh (water, sugars), while the scattering coefficient is a measure related to photon refractive mismatch caused by cellular structures, such as membranes, cell walls, intercellular spaces, starch granules, etc. The authors found good correlations between texture sensory attributes and some scattering coefficients. Sweet taste showed a significant correlation with some absorbance coefficients. The authors were optimistic about the ability to predict texture sensory attributes, mealiness in particular, by TRS. However, the best correlations were found between sensory scores and other more common destructive measurements used as the control.
In conclusion, non-destructive techniques (vis/NIR, TRS) seem to be promising in the prediction of some sensory attributes, but are not yet as reliable as commonly used destructive analytical methods.
Consumer preferences
Some authors have studied the relation between consumer preference and instrumental characterisation, as a direct way to interpret preferences in terms of chemical and physical properties.
Hoehn et al. (2003) compared consumer preference with chemical and mechanical measures on apples. The authors found how not only soft apples, but also very hard ones were not preferred by consumers, even by the youngest. Such observations confirm the theory that liking falls within a range of intensity for each sensory characteristic (Bourne, 2002). Similar to other studies, they found a good correlation between instrumental measures and liking for one apple cultivar, but not for others. According to the author, this finding should be taken into account when defining the minimum tolerance standards for the instrumental parameters used for quality assurance applied to apples – an instrument is not able to measure the same combination of properties that human senses can, and several sensory attributes together can influence preference judgment (Hoehn et al., 2003). In this context, Harker et al. (2008) tested the instrumental measurements currently available for quality control in order to verify whether they provide appropriate quality parameters to define consumer acceptability. In their work, an increase in liking was found when firmness measured by penetrometry was above a specific threshold common to all the varieties examined (‘Gala’, ‘Red Delicious’, ‘Fuji’ and ‘Braeburn’) and equal to 62 N. The authors observed that the market success or failure for an apple cultivar can depend on the ratio between the cultivar’s natural firmness distribution and the
fruit below that limit is high, the variety tends to be less appreciated and purchased (Harker et al., 2008).
A
PPLICATION OF SENSORY ANALYSIS IN APPLE STUDIESThe study of apple quality includes a series of factors that need to be considered, such as the impact of growing conditions; post-harvest storage conditions and physiological changes during storage; post-storage shelf conditions; and properties and peculiarities of new cultivars being released from breeding activities. In the light of the established important role of sensory science in the evaluation of apple quality, it is important to consider the application of descriptive sensory analysis and preference tests in determining the significance of such factors.
Pre-harvest factors: some examples
Crop management practices and pre-harvest treatments are able to influence product quality both at harvest and during storage, mainly in terms of cell anatomy, structure and turgor (Sams, 1999; Johnston et al., 2002). Many studies are available about the influence of factors such as rootstocks, irrigation and fertilization management, weather conditions, and canopy structure on apple fruit yield and quality, measured in terms of instrumental parameters (e.g. fruit weight, firmness, soluble solids concentration, disease and pest damage, and the incidence of physiological disorders;
see, for example, Racsko et al., 2008; Campi et al., 2009; Brackmann et al., 2010; Casero et al., 2010; Lachapelle et al., 2013).
However, few studies relating pre-harvest factors with quality determined by fruit sensory analysis are available. In terms of growing practices, Vanzo et al. (2013) compared apples produced by organic and integrated systems. A consumer panel performed triangle tests and hedonic evaluation of specific sensory attributes. The results showed that consumers were able to discriminate between fruit coming from the different growing systems and that the preferences between organic and integrated fruit for sweetness, tartness, firmness, juiciness, overall flavour and appearance were cultivar dependent. Altitude is also a factor determining differences in ripening stage and fruit chemical composition (Comai et al., 2005; Singh et al., 2006; Aslantas and Karakurt, 2007). Paprštein et al. (2006) studied fruit chosen from orchards in four climatically different locations (about 200, 300, 400 and 500 m a.s.l.) by asking panels of consumers to score their liking for several sensory attributes related to appearance, flavour and texture. The authors reported a total score, representing the sum of scores for each attribute, and a general taste score, but they did not perform any statistical analysis to study the differences in sensory properties of each cultivar at the different locations and no evidence of significant differences related to altitude was provided.
Crop load is also known as a factor affecting fruit quality and sensory properties. Baugher and Schupp (2010), for example, demonstrated better quality, in terms of sensory profile and consumer liking, in fruit coming from low crop load treatments compared to high crop load treatments in ‘Honeycrisp’ apple. Thinning is therefore a key factor to improving crop yield and quality in apple (Link, 2000). The most used
way to reduce crop load in apple is the application of phytochemicals which cause fruit abscission (Zibordi et al., 2009). An innovative method consists in shading apple trees by appropriate nets (Byers et al., 1990) – competition for reduced photosynthates is responsible for fruit abscission (Corelli Grappadelli et al., 1990). There are conflicting results about the final quality of fruit coming from shading treatments (Widmer, 2008; Zibordi et al., 2009; Amarante et al., 2011). Recently, photoselective colored shading nets have been proposed to promote specific physiological responses by differential spectral transmission of solar radiation (Shahak et al., 2004). Bastías et al. (2012) found small instrument-measured differences in apple fruit coming from trees under different colored nets. Solomakhin and Blanke (2010) also found that sugar/acid ratio, indicative of “taste”, was not influenced by photoselective net treatments, probably because of the tendency of sugars and acids to decrease in the same proportion in all the treatments (Solomakhin and Blanke, 2010).
In light of the observations reported here about the importance of sensory perception and the definition of ranges of acceptability for several quality parameters, a consideration of eating quality just based on sugar/acid ratio appears not adequate to reliably describe the quality of fruit. To our knowledge, no studies applying sensory analysis to evaluate the quality of apples coming from different thinning practices and different photoselective net treatments have been published yet.
Post-harvest changes of apple sensory properties
One of the first studies applying sensory analysis to study post-harvest changes in apples was proposed by Watada et al. (1980), who found strong differences in the sensory patterns for five apple varieties developed during a five-month storage period, and suggested that this might be due to differences in physiological age at harvest. Some varieties, for example, showed high astringency at harvest, typical of unripe fruit. For such cultivars, there was a strong change in their sensory profile during storage, more than in other cultivars which could be indicative of that fruit being more ripe at harvest. However, the authors did not ignore potential differences in chemical composition and cellular structure, suggesting the usefulness of studies on anatomy or metabolic and catabolic processes, determining the relationship between these factors and sensory quality (Watada et al., 1980). Several authors have found that different apple varieties exhibit different patterns in both sensory texture and flavour profiles during storage (Billy et al., 2008; Seppä et al., 2013a). Seppä et al. (2013a) defined clusters of varieties, depending on their sensory profile, and found that most of them moved from one cluster to another during storage as their sensory properties changed. Hence, different varieties can show similar sensory profiles at a specific moment during storage but very different profiles at another. Billy et al. (2008) explained the different patterns exhibited by different varieties during storage as related to different genetic profiles and different enzymatic metabolism of pectins (Billy et al., 2008).
Modifications in sensory properties during storage of apples do not seem to be related only to textural properties, since it has been demonstrated that volatile compound release strongly changes during post-harvest storage, and that different
patterns can be shown by different apple varieties (Soukoulis et al., 2012). Aaby et al. (2002) found that differences in sensory properties between fresh and stored apples were mainly related to odour and aroma, while texture and taste attributes did not differ significantly, even if instrumental firmness and titratable acidity decreased during storage (Aaby et al., 2002). Varela et al. (2005; 2008) studied the relation between changes of sensory profile of apples during storage, evaluated by a trained panel, and consumer acceptability. Rejection of fruit was associated with increased mealiness, ripe and alcoholic flavour, even if other attributes (such as juiciness, sweetness, acidity) remain unchanged. Thus, attributes that are most often considered important did not influence the decision by consumers to reject the fruit (Varela et al., 2005). They also highlighted the fact that fruit recently harvested and fruit stored in either cold or controlled atmosphere conditions showed different patterns in how their sensory properties changed subsequently during storage at room temperature (simulating real market conditions) irrespective of similar instrumental parameters measured at harvest or soon after storage (Varela et al., 2008).
Other studies proposed instrumental measure analysis as a way to predict apple sensory quality change during post-harvest storage. Mehinagic et al. (2004) employed both descriptive sensory analysis and instrumental measures (penetrometry, compression test, vis/NIR spectroscopy, soluble solid and titratable acidity concentrations) to predict sensory properties at harvest and during storage. Penetrometry appeared to predict sensory properties well at harvest, while the compression test helped to better explain the changes in mealiness and juiciness after storage (Mehinagic et al., 2004).
An important conclusion from such studies is that different cultivars show different sensory patterns during post-harvest storage. That suggests the need to develop and validate sensory tools on very wide sets of apple cultivars, in order to define the different patterns that can be show within this genus. Moreover, cultivars could be studied under different storage conditions in order to enhance differences in their responses. Instrumental analyses could also provide information about the chemical and structural changes responsible for the different trends, as highlighted by Costa et al. (2012), who observed a considerable textural variation in texture analyser performance of different apple cultivars over two months of storage. Since the authors considered that the main source of variation was genetically based, they suggested that proper evaluation of apple storage performance should be considered as a basic factor in breeding programs so that varieties which can best maintain quality features during storage can be selected (Costa et al., 2012).
Breeding studies
Currently, the most advanced method of breeding is marker-assisted selection, based on the identification of individuals carrying gene alleles responsible for the phenotype of interest (Costa et al., 2010a; Sansavini and Tartarini, 2011; Myles, 2013). Preliminary screenings made on the initial wide set of breeding progeny are necessary, before any sensory characterisation, in order to reduce the samples to a number which can be managed in sensory evaluations. However, such preliminary instrumental screenings can exclude interesting cultivars, because of an improper transposition of instrumental readings in sensory interpretation. Thus, the
instrumental measures is required if they are to be applied in breeding studies. Even where disease resistance and facilitating of efficient growing practices are among the most important targets to breeders, new apple selections must also have a high appeal to consumers and this makes the description of their sensory characteristics all the more relevant.
Within this context, a number of sensory studies have been concerned with determining consumer acceptability of new apple genotypes. Granger et al. (1992) studied new scab-resistant apple cultivars for their sensory acceptability through hedonic evaluation of different quality attributes using a flavour profile technique (Caul et al., 1958). The overall acceptability of each apple variety was calculated as the difference between the average score for positive quality attributes (aroma, sweetness, acidity, firmness, juiciness and crispness) and the average score for negative quality attributes (astringency, bitterness and mealiness). A five-year study by Paprštein et al. (2006) on the acceptability of more than a hundred cultivars currently cultivated in the Czech and Slovak Republics together with new promising ones, harvested in four climatically different locations, aimed at identifying which climatic condition could be proposed as being the best for achieving the best sensory quality score for each cultivar. A similar study was conducted by Miller et al. (2005), who studied 20 new apple cultivars both in the eastern US and in British Columbia, Canada. Hedonic scales were used to score the liking for appearance, texture and flavour, while intensity scales were used to score the intensity of texture and taste attributes. Significant differences in apple sensory quality were found for cultivar and site. The authors suggested that widespread sensory tests of new apple cultivars across several sites should always be considered in order to evaluate new apple cultivar performance under different soil and climatic conditions (Miller et al., 2005).
Bonany et al. (2013) tested products grown in a specific site and then tested by different consumers at different locations around Europe. The results showed significant interactions between apple variety and country, age and gender, indicating that differences in eating quality acceptance among varieties were influenced by these factors. A sensory profile developed on the same fruit by a trained panel provided a definition of those sensory characteristics that were appreciated in different countries and by different consumer classes (Bonany et al., 2013). The first work that applied concurrently descriptive analyses and consumer surveys was performed by Redalen (1988) on about 35 new apple selections over a five-year period. The study was mainly centered on flavour characteristics and appearance, resulting in conformity between the highest scores for the intensity of flavour properties given by the trained panel and preferences expressed by consumers. However, no regression analyses were proposed in that study to explain and confirm such a relationship (Redalen, 1988). Hampson et al. (2000), instead, developed a more detailed protocol for the definition of liking drivers on new apple varieties. Firstly, a trained panel was involved in the hedonic evaluation of seven sensory attributes related to appearance, texture and flavour of both new cultivars and of standard varieties, over a period of four years. A consumer preference test was then performed on a sub-set of samples. The authors found out that crispness accounted for 90% of variation in texture liking and sweetness, sourness and aromatics explained about 50% of the variation in flavour liking. They also performed instrumental mechanical and chemical measurements on the samples, but found that the collected sensory data were better predictors of liking than the instrumental methods were. Thus, the authors’ conclusion was that analytical measurements are not adequate to substitute for sensory evaluation in screening new breeding products
(Hampson et al., 2000). Kühn and Thybo (2001), instead, applied descriptive sensory analysis only, studying scab-resistant apple cultivars for their sensory properties by a trained sensory panel which assessed 13 different attributes. The cultivars, which were evaluated at different storage times, showed differences that were related both to cultivar and to storage time (Kühn and Thybo, 2001).
C
ONCLUSIONSThis overview shows that the study of apple eating quality has been of interest for a long time, both in relation to sensory properties and to consumer acceptability. However, not all the available papers have reported stringent criteria for the use of sensory protocols. A wide series of studies also applied instrumental analyses to confirm sensory data and to interpret them, and also to identify correlations between sensory and instrumental variables to predict the sensory profile, with some common difficulties, as for the prediction of sweetness perception. Many studies can be cited as being methodological, as they report different and sometimes innovative sensory and instrumental methodologies to evaluate apple eating quality. The application of sensory analysis in specific studies on apple quality in relation to pre- and post-harvest factors, as well as the study of sensory characteristics of new varieties is, instead, not common in the literature, mainly because of the limitations of sensory methodologies, which require more time and specialized resources than instrumental characterisations.
However, there is still space for the development of proper sensory methodologies that can go hand in hand with instrumental characterisations, in order to define effective prediction models to provide apple producers with a reliable description of apple sensory profiles.
Chapter II
S
ENSORY
P
ROFILING OF
A
PPLE
:
M
ETHODOLOGICAL
A
SPECTS
,
C
ULTIVAR
C
HARACTERISATION AND
P
OSTHARVEST
C
HANGES
I
NTRODUCTIONEating quality is a key factor driving the choices of consumers in fruit and vegetable consumption (Harker et al., 2003) and largely depends on the fruit properties formed and established both at the end of the fruit ripening process and throughout postharvest ripening. Fruit ripening is a complex of physiological processes that makes the fruit edible and pleasant. The most important changes are in fruit size, colour, acid/sugar, flavour and texture. Texture, in particular, is a major attribute used for the determination of apple fruit quality because of its tight correlation with general fruit freshness. A fresh fruit is defined by ISO 7563:1998 as “a turgescent product with no signs of withering or ageing, the cells of which have not deteriorated”; thus the texture properties are recognised as the most important drivers for consumer acceptability (Jaeger et al., 1998; Péneau et al., 2006; Harker et al., 2008). In addition, texture characteristics related to mechanical and elastic properties of the primary cell wall structure, are also responsible for juice and flavour release, which are also important characteristics in determining apple fruit quality (Daillant-Spinnler et al., 1996; Karlsen et al., 1999; Harker et al., 2008).
The quality of apples is currently measured by food suppliers using basic pomological descriptors, such as fruit shape, size, colour, soluble solids content, titratable acidity and penetrometer measurements (i.e., the most widely used method for quality texture assessment) (Harker et al., 1997, Hoehn et al., 2003). Many studies have attempted to predict eating fruit quality using these instrumental characterisations (Harker et al., 2002a and 2002b Chauvin et al., 2010; Zdunek et al., 2010a). However, in some cases, the predictions have been too empirical because of the interaction among several sensory attributes, making the analyses of these chemical and physical properties insufficient for an exhaustive fruit quality description (Harker et al., 2006; Echeverría et al., 2008). Recently, a novel texture analyser was employed to obtain a comprehensive apple fruit texture characterisation while simultaneously profiling the mechanical and the acoustic texture components (Costa et al., 2011 and 2012). However, apple eating quality cannot be estimated on the basis of a single instrumental parameter but it must be analysed as a whole.
Descriptive sensory analysis is perhaps the best approach to provide a comprehensive and objective description of sensory perception in both qualitative and quantitative terms (Murray et al., 2001). Therefore, human assessment should be maintained as the main reference to calibrate any instrument to develop testing methods accepted by consumers (Bourne, 2002). Moreover, sensory analysis could help to describe the product’s characteristics using a language that closely reflects the consumers’ perception (Swahn et al., 2010; Seppä et al., 2012).
During last two decades, several protocols for sensory profiles of apple fruit have been proposed. Most of them focused on the relation between instrumental and sensory measurement (Dever et al., 1995; Harker et al., 2002a and 2002b;
Allan-Wojtas et al., 2003; Echeverría et al., 2004; Chauvin et al., 2010). Other protocols were developed for specific cultivars, studying their change during storage or after different postharvest treatments (Boylston et al., 1994; Cliff et al., 1998; Pre-Aymard et al., 2005). Some topics, such as vocabulary development, panel selection and judges performance, are often not sufficiently considered.
In the majority of the published studies the attributes were chosen by panel brainstorming, based on discussion about the meaning and the use of each sensory variable (Daillant-Spinnler et al., 1996; Kühn and Thybo, 2001; Allan-Wojtas et al., 2003); sometimes the vocabulary was directly proposed by the panel leader (Karlsen et al., 1999; Péneau et al., 2007; Harker et al., 2002a and 2002b). Scientific contributions interested in the relationship between sensory and instrumental data often propose a specific set of sensory descriptors which may fit with the sensory meaning given to the instrumental measures, such as texture properties for firmness measurements or flavour attributes for volatile compounds analysis (Karlsen et al., 1999; Ioannides et al., 2007; Chauvin et al., 2010).
As regard as the panel selection, many studies refer to various ISO standards for general sensory analysis methodologies (Karlsen et al., 1999; Kühn and Thybo, 2001; Echeverría et al., 2008), whereas Daillant-Spinnler et al. (1996) provide a more detailed description of panel training specific for apple profiling. In addition, Hampson et al. (2000) propose a way to monitor panel performance. Moreover, this literature has proposed several different types of sample presentation, from the whole fruit (Cliff et al., 1998; Seppä et al., 2012) that avoids alterations due to browning and allows a realistic external appearance evaluation, to half fruit (Karlsen et al., 1999; Harker et al., 2002a; Billy et al., 2008) or peeled/unpeeled single slices
(Daillant-Spinnler et al. 1996; Barreiro et al., 1998; Hampson et al., 2000; Péneau et al., 2007; Chauvin et al., 2010; Brookfield et al., 2011) or flesh cubes (Varela et al., 2008) that makes a sub-sample available for instrumental measurements.
Based on the results published so far, the aim of this work was 1) to develop a detailed and complete protocol for apple sensory profiling performed by a trained panel, from judges training and sample preparation to panel performance evaluation and method validation, 2) to apply this method to a wide selection of relevant cultivars in order to acquire information about their sensory properties and 3) to investigate the changes in sensory characteristics during postharvest storage.
Twenty-one different apple cultivars were chosen, the largest feasible set, including the most consumed ones on the Italian market and those used in previous studies conducted at Fondazione Edmund Mach (FEM) (Costa et al., 2011). Additionally, twelve cultivars in the apple set were also analysed after different postharvest storage periods to observe the modifications of the sensory properties during postharvest.
The evolution in fruit sensory quality during conservation is of fundamental importance for apples because these fruits are generally consumed after a period of storage (which can last for almost a year). Additionally, several apple varieties respond in a distinct and specific cultivar-dependent manner.
M
ATERIALS ANDM
ETHODSPlant Materials
Apple sampling
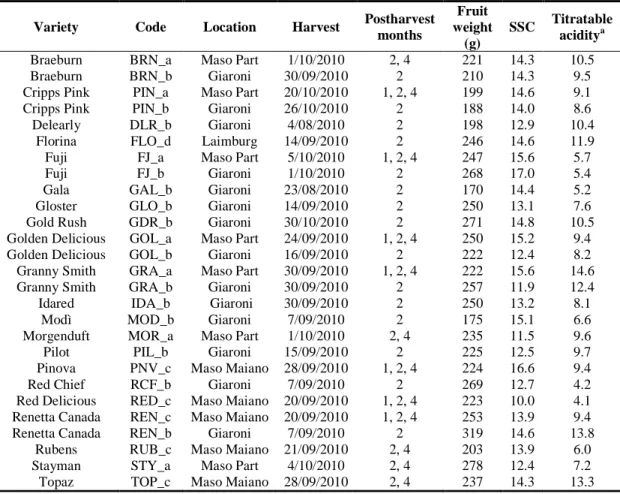
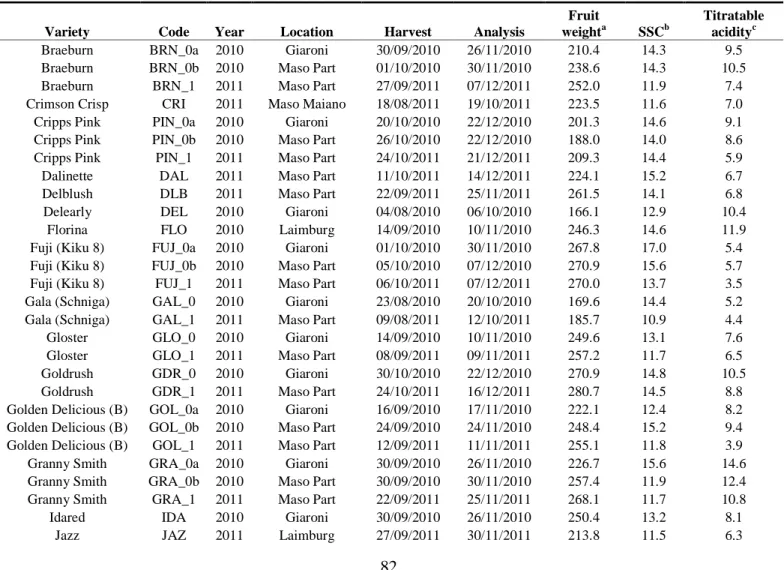
Twenty-one apple varieties (Malus×domestica Borkh.) were considered in this study (Table 1) and selected based on a previous study looking at the mechanical and acoustic profiles of a large apple collection (Costa et al., 2011). The most common commercial apple cultivars (‘Cripps Pink’, ‘Gala’, ‘Golden Delicious’, ‘Granny Smith’, ‘Fuji’, ‘Renetta Canada’) were included in this study.
The experimental design for cultivar characterisation included one sampling of each of the 21 varieties. For 6 of these (‘Braeburn’, ‘Cripps Pink’, ‘Fuji’, ‘Golden Delicious’, ‘Granny Smith’ and ‘Renetta Canada’), a second sample was considered. All the fruit were harvested in the year 2010 from experimental orchards managed according to standard agronomical practises (i.e., thinning and pest control).
The fruit were picked at commercial harvest, determined by the standard descriptors used to monitor fruit maturity and ripening, such as flesh firmness, skin colour, total acids, sugar content and starch degradation index. For each sample, a minimum of 20 apples of homogeneous size and without any visible external damage were selected and stored for two months in normal atmosphere at 2°C and 95% relative humidity. Furthermore, to follow the changes in sensory characteristics during storage, sample subsets from 12 varieties were assessed after 1 month (7 varieties) and 4 months (12 varieties; Table 1).
Sample preparation
For each apple batch, 16 fruit were selected and kept at room temperature for 24 hours prior to analysis. Each fruit was weighed (Table 1) and then peeled. Three horizontal sections, 1.2 cm high each, were cut around the equatorial plane perpendicular to the core of the fruit. The slices were then immediately dipped in an antioxidant solution (0.2% citric acid, 0.2% ascorbic acid, 0.5% calcium chloride) for 30 seconds. Cylinder shapes (1.8 cm diameter, 5 or 6 cylinders per slice) were cut from the flesh using a commercial apple corer (Tescoma, Brescia, Italy). These flesh pieces underwent a second antioxidant treatment before being placed into clear plastic cups (8 cylinders per cup) with lids and encoded with a random three-digit code. Six apple samples were analysed per session, 3 varieties each with two replicates; sample identities were blinded and they were presented in a randomised balanced order to each assessor.
The juices squeezed from each cultivar (12 cylinders sampled from different fruit) were measured for % of soluble solids concentration (SSC) (DBR35 refractometer, XS Instruments, Poncarale, Brescia, Italy) and titratable acidity (Compact Titrator, Crison Instruments S.A., Alella, Barcelona, Spain) (Table 1).
Sensory analysis
Panel selection and training
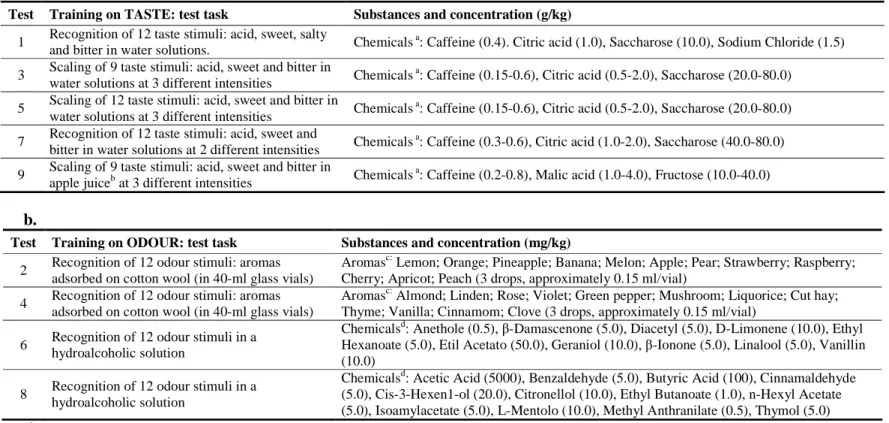
The selected panel included 13 people: 6 males and 7 females. Eleven had previous experience in sensory analysis. Twenty-eight candidates, all employed at FEM, were initially evaluated based on their performance during a preliminary training. The training was performed in 6 sessions, each 1.5 hours in duration, through a teamwork, and 9 individual tests were performed that aimed to assess the ability of each candidate to recognise and measure the basic tastes (Table 2a) and several common odours (Table 2b; UNI EN ISO 8586-1; ISO 8586-2). The taste and odour stimuli were presented in water and commercial cloudy apple juice solutions (100% apple juice; Pfanner Getränke GmbH, Lauterach, Austria). For each individual test, 1 point was assigned to each correct answer given by the assessors, and the test scores were weighted for the total stimuli presented and then summed to compute the individual cumulative score. This score and the percentage of attendance were considered for the eligibility of a candidate to the panel, using a threshold of 60% and 80%, respectively.
Sensory profiling
Sensory profiling based on the quantitative descriptive analysis method was performed by the selected assessors (Stone and Sidel, 2004a).
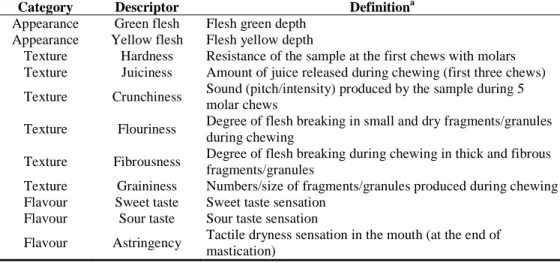
A 15-attribute sensory lexicon was developed using the consensus method (Murray et al., 2001) over 9 training sessions. A specific and univocal sensory definition
along with a precise evaluation procedure was agreed upon by the panel for each attribute (Table 3). The developed lexicon included attributes for external flesh appearance (2), texture (7), taste (4, comprising astringency) and overall odour perceived by both ortho- and retro-nasal evaluation. The intensity of each attribute was scored by the panel on a linear scale, anchored to 0 (minimum intensity or absence) and 100 (maximum intensity), with a third anchor at halfway (50). References were provided for each attribute, corresponding to the intensities at the scale extremities (Table 3).
The sensory tests were performed once per week in a sensory laboratory equipped with twelve individual booths under artificial lighting. Unsalted bread and still water were provided to the assessors to cleanse their palates between samples. Data acquisition was achieved through a computerised system using the software FIZZ 2.46A (Biosystemes, Couternon, France).
Statistical analysis
To evaluate the consistency and discriminant ability of the assessors, ANOVA for each assessor and attribute was performed; the results were plotted on a p-value vs. Mean Square Error-value (MSE) plot (Næs et al., 2010). Panel consonance was evaluated using correlation loading plots based on the Tucker-1 method (Næs et al., 2010). Both analyses were performed with the PanelCheck V1.4.0 software (Nofima Mat, Technical University of Denmark and University of Copenhagen).
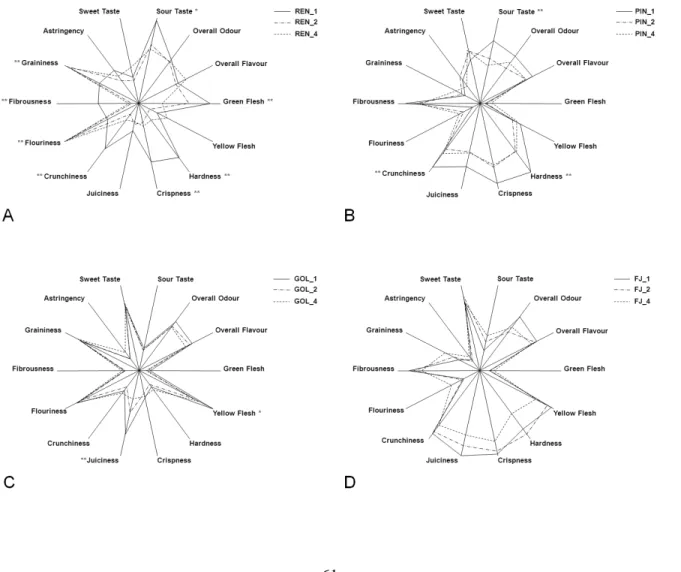
considering the cultivar effect; two-way ANOVA was performed on the subset of 7 varieties analysed after 1, 2 and 4 months of storage (see Table 1), considering cultivar and time of storage as factors. Effects with a p-value less than 0.05 were considered significant. ANOVA was performed using the STATISTICA 9.1 software (StatSoft, Inc., U.S.A.).
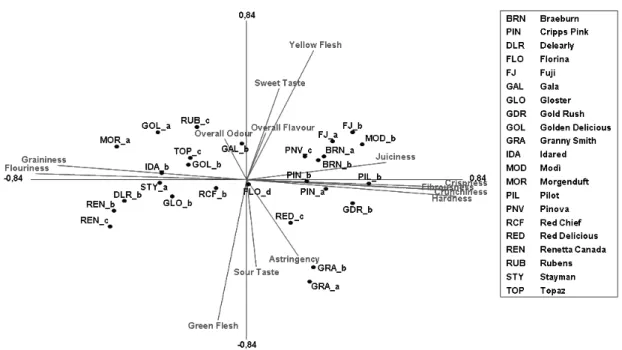
For visualisation of the product sensory space, Generalised Procrustes Analysis (GPA) was performed separately on both data sets using the Senstools 3.1.6 software (OP&P Product Research BV, Utrecht, the Netherlands).
R
ESULTS ANDD
ISCUSSIONMethod validation
Panel performance and vocabulary validation
Assessors’ consistency and discriminant ability and panel consonance were evaluated on the complete data set (13 judges x 15 sensory attributes x 27 apple samples x 2 replicates).
The results of ANOVA for each assessor and attribute are summarised in the p-MSE plots, shown in Figure 1. The p-value calculated for a specific assessor and attribute indicates the ability of the assessor to distinguish one or more samples from the others. In contrast, the MSE represents the repeatability of an assessor’s evaluation (all evaluations were conducted in duplicate). A good assessor should possess an ideal combination of low p-values and low MSE-values (Lea et al., 1995), as
highlighted by a dashed area in Figure 1. All the assessors are located in this area for most of the attributes, except for those indicated by different symbols. The cases with
p-value greater than 0.05 are related to the attributes overall odour, overall flavour,
graininess and bitter taste. With regards to MSE, only one judge had values greater than the critical threshold (> 400) for the astringency and bitter taste attributes. The best results for all the assessors were observed for the crunchiness, flouriness and sour taste attributes.
The agreement among the assessors was studied using Tucker-1 correlation plots for each attribute. Figure 2 shows two examples of such a graph (for hardness and bitter taste). The two ellipses on each plot correspond to 50% and 100% of the explained variance. For a well-trained panel, the correlation loading of a specific attribute should be close to the outer ellipse, with the assessors plotted closely together (Næs et al., 2010). The application of Tucker-1 plots on our data showed that the best consensus among the assessors was obtained for all the texture attributes, sour taste and external appearance attributes. As an example of these results, Figure 2a shows the Tucker-1 plot performed on hardness attribute data: it can be noted how this attribute was used in agreement among the judges. Figure 2b represents the Tucker-1 plot for bitter taste attribute, in which the assessors showed a low correlation and less than 50% of the explained variance was achieved. A low consensus for overall odour was found as well and it is probably due to the lack of a more specific attribute definition, which might have allowed the assessors to reach a better agreement on its interpretation. A not very high correlation among the assessors for sweet taste and overall flavour could be due to the confounding effect of other parameters, mainly texture, which can interfere with sweetness perception and volatile compounds