Affordability of Medicines and Patients’
Cost-Reducing Behaviour
Empirical Evidence Based on SUR Estimates from Italy and the UK
Vincenzo Atella,1 Ellen Schafheutle,2 Peter Noyce2 and Karen Hassell2
1 Centre of International Studies on Economic Growth (CEIS) – Dipartimento di Studi Economico-Finanziari e Metodi Quantitativi (SEFEMEQ), Faculty of Economics, University of Rome Tor Vergata, Rome, Italy
2 School of Pharmacy and Pharmaceutical Sciences, The University of Manchester, Manchester, UK
Introduction: Studies have demonstrated that co-payments on medication reduce the consumption of both
Abstract
non-essential and essential drugs, and that the latter can lead to worse health outcomes. Far less is known about how patients cope with the cost of medication, particularly if affordability is an issue, and how this compares across two countries with different prescription charge policies. Therefore, the aim of this article is to explore empirically how, and to what extent, costs incurred by patients influence their decision-making behaviour in accessing medicines.
Methods: Based on the findings from focus groups, a questionnaire was designed that addressed medication cost
issues relevant to patients in both the UK and Italy. Using an econometric model, several hypotheses are tested regarding patients’ decision-making behaviour and how it is influenced by health status, sociodemographic characteristics and the novel concept of a self-rated affordability measure.
Results: Quite a large percentage of patients (70.3% in the UK and 66.5% in Italy) stated they have to think
about the cost of medicines at least sometimes. Respondents adopted numerous cost-reducing strategies, subdivided into (i) those initiated by patients and (ii) those involving self-medication. Their use was strongly influenced by income and drug affordability problems, but the self-rated affordability measure was a stronger predictor. Commonly used strategies were not to get prescribed drugs dispensed at all, prioritising by not getting all prescribed items dispensed or delaying until the respondent got paid. Furthermore, respondents with affordability issues were also cost-conscious when self-medicating with over-the-counter (OTC) products for minor conditions such as dyspepsia. Despite patients in both countries using cost-reducing strategies, their use was more pronounced in the UK, where the prescription charge was significantly higher than in Italy.
Discussion/conclusion: The results from this study provide detail on the kinds of strategies patients use to
reduce the cost burden of prescription charges, and support previous research showing they may be foregoing essential medication. Because the same questionnaire was applied in two European countries, where the national health systems aim to provide healthcare services that are accessible to all citizens in need, it offers interesting insights for policy makers in other countries, where patients may have to pay a larger share of their drugs out-of-pocket, such as the US.
The continuous increase in the cost of healthcare services by the Maastricht Treaty signed in 1991. Although prescription recorded over the last 2 decades in many countries has produced drugs represent only a relatively small part of healthcare spending serious concerns among policy makers, who have been forced to in most OECD (Organisation for Economic Cooperation and adopt new restrictive measures in order to reduce public budget Development) countries, the increasing trends in both their deficits. The EU governments have been particularly sensitive to volumes and their prices have been greater than in other major this issue, given the strict requirements imposed on their budgets components of healthcare spending.[1]
A variety of co-payment systems, where patients are required to systems. The principle of free access based on need underlies the contribute in some way towards the cost of their medication and National Health Service (NHS) in both countries. In the Italian healthcare use, have therefore been introduced by most countries NHS, most of the funds are generated through payroll taxes, in order to reduce demand for non-essential drugs and thus manage
whereas in the UK the largest source of funding is general taxa-drug expenditure. Several empirical contributions1 (mostly from
tion.[18]
the US and the UK) confirm that the demand for prescription drugs
In terms of prescription charges, the two countries are also not is reduced by a direct contribution from the patient, even though
dissimilar. The current UK prescription charge is a fixed flat fee, the overall impact of co-payments remains quite limited, with
price elasticity ranging from –0.1 to –0.6. As noted by Freemantle payable for each item prescribed, irrespective of the actual drug and Bloor,[15] the key concern with policies on drug
reimburse-cost, the amount prescribed or the type of pharmaceutical prepara-ment is that they will, besides reducing the use of non-essential
tion. The Italian prescription charge is rather more complicated. In drugs, also result in a reduction of the use of essential drugs. Even
1995, products were classified into three reimbursement groups: though the reduction in ‘discretionary’ (or non-essential) drugs has
class A contained drugs for severe and chronic illnesses, and the been shown to be differentially greater than the reduction in uptake
patient was required to pay only a fixed prescription charge, which of essential prescribed medicines,[16] the concern remains that
applied to each single package and was independent of amount and essential medication is affected.
We know very little about how the cost of medication (through price; for drugs deemed to be non-essential but potentially useful co-payment systems) affects individual patients, and how they (class B), the patient paid 50% of the retail price; other drugs (class manage medication costs. We also know little about the
character-C) were fully paid for by the patient. Given the reduced impor-istics that would make some patients more likely to use various
tance of the class B category of drugs (8.2% of total drug special-strategies to reduce their drug consumption.
ties reimbursed by the Italian NHS), the Italian system is not The goal of this article is to explore empirically how, and to
dissimilar to the UK system. This means that, in most instances, what extent, costs incurred by patients influence their
decision-Italian patients pay either the full cost of medicines or a fixed making behaviour in accessing medicines. This is a novel study in
that it uses an ad hoc survey to inform the descriptive and charge, as with UK patients. The L3000 (about €1.7) flat rate empirical analysis of the influence of costs on patient decision charge for class A drugs in Italy was considerably lower than the making. Besides socioeconomic factors and health attributes that UK prescription charge, even if the data are adjusted for ‘purchas-influence patient decision making, this survey uses several
ques-ing power parity’. In 2000, when this survey was conducted, UK tions and statements about patients’ ability to afford medication
patients incurred a prescription charge of £6.00 (€9.80) per item. and their use of strategies to reduce medication costs.
This cost was also high in comparison with many other countries The definition of costs2 used in this study is the price paid for
in the EU.[19]
medicines, given that in both Italy and the UK visits to general practitioners (GPs) are free of charge.3 Costs associated with
In both countries a number of exemptions exist. In Italy, medicines would therefore include prescription charges, co-pay- disabled persons were fully exempt from paying any charges on ments on medicines and the expense of over-the-counter (OTC)
both class A (fixed charge) and class B drugs. In the UK, exemp-products purchased in pharmacies and other retail outlets.
tions exist on the basis of age (≤16 and ≥60 years old), income and benefit-related reasons, and a number of medical conditions. Ap-Prescription Charge Systems in Italy and the UK4
proximately 86% of prescription items are now exempt from charges, covering approximately 50% of the population.[20]
Fur-Italy and the UK are countries that provide a good basis for
thermore, pre-payment certificates (PPCs) exist, which can be comparison in terms of their healthcare and prescription charge
1 Main studies on the topic include Leibowitz et al.,[2] Soumerai et al.,[3] O’Brien,[4] Harris et al.,[5] Ryan and Birch,[6] Huttin,[7] Hughes and McGuire,[8]
Tamblyn et al.,[9] Atella[10,11] and Atella and Rosati.[12] Lexchin and Grootendorst[13] and Rice and Matsuoka[14] provide reviews of the impact of cost
sharing on drug use by vulnerable populations.
2 All costs and nominal values expressed in this article refer to the period June–November 2000, when the field study was conducted.
3 In Italy, visits to specialists may incur a relatively high charge (about €35) for the patient. In the UK, these are free of charge if patients are treated under the National Health Service (NHS).
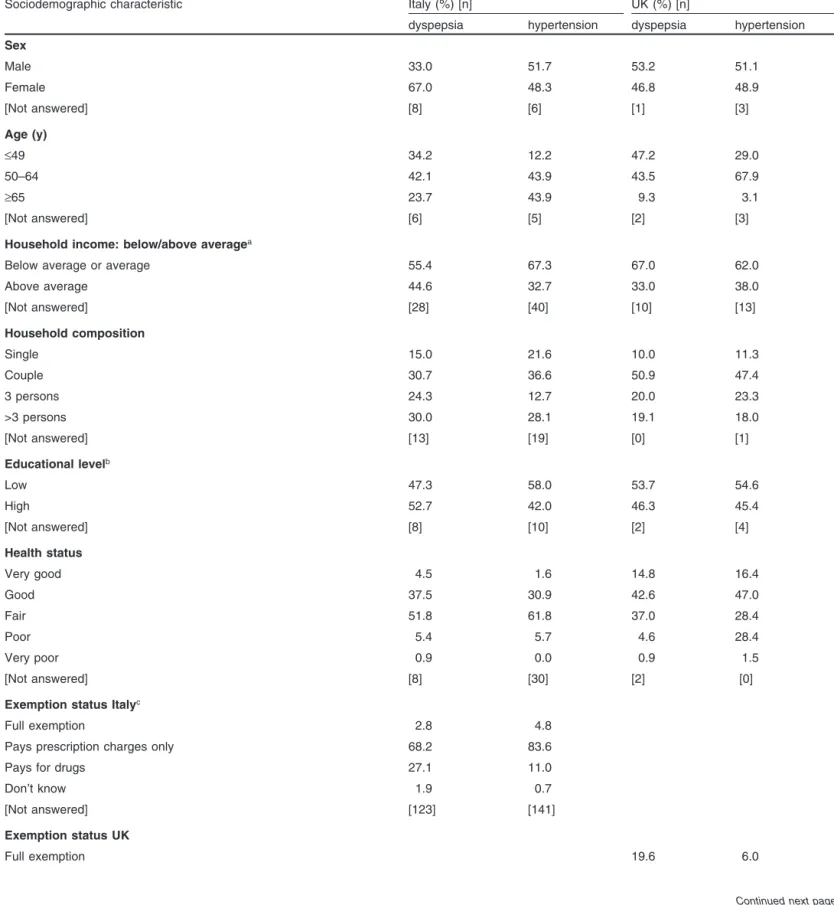
Table I. Sociodemographic characteristics of the population samples
Sociodemographic characteristic Italy (%) [n] UK (%) [n]
dyspepsia hypertension dyspepsia hypertension
Sex Male 33.0 51.7 53.2 51.1 Female 67.0 48.3 46.8 48.9 [Not answered] [8] [6] [1] [3] Age (y) ≤49 34.2 12.2 47.2 29.0 50–64 42.1 43.9 43.5 67.9 ≥65 23.7 43.9 9.3 3.1 [Not answered] [6] [5] [2] [3]
Household income: below/above averagea
Below average or average 55.4 67.3 67.0 62.0
Above average 44.6 32.7 33.0 38.0 [Not answered] [28] [40] [10] [13] Household composition Single 15.0 21.6 10.0 11.3 Couple 30.7 36.6 50.9 47.4 3 persons 24.3 12.7 20.0 23.3 >3 persons 30.0 28.1 19.1 18.0 [Not answered] [13] [19] [0] [1] Educational levelb Low 47.3 58.0 53.7 54.6 High 52.7 42.0 46.3 45.4 [Not answered] [8] [10] [2] [4] Health status Very good 4.5 1.6 14.8 16.4 Good 37.5 30.9 42.6 47.0 Fair 51.8 61.8 37.0 28.4 Poor 5.4 5.7 4.6 28.4 Very poor 0.9 0.0 0.9 1.5 [Not answered] [8] [30] [2] [0]
Exemption status Italyc
Full exemption 2.8 4.8
Pays prescription charges only 68.2 83.6
Pays for drugs 27.1 11.0
Don’t know 1.9 0.7
[Not answered] [123] [141]
Exemption status UK
Full exemption 19.6 6.0
Table I. Contd
Sociodemographic characteristic Italy (%) [n] UK (%) [n]
dyspepsia hypertension dyspepsia hypertension
Pays prescription charges 68.2 75.9
Pre-payment certificates 12.1 18.0
[Not answered] [3] [1]
Chronic conditions apart from hypertension and dyspepsia
No 38.9 49.7 16.7 29.1
Yes 61.1 50.3 83.3 70.9
Acute minor conditions during the last 4 weeks
No acute minor condition 15.9 20.8 17.3 16.4
One acute minor condition 36.3 35.8 27.3 26.1
Two acute minor conditions 21.2 21.7 25.5 26.1
a In Italy, net average annual household income was approximately €15 000, as reported in the Bank of Italy 1998 Survey on Household Income and Wealth.[37] Average household income was defined as follows: L2.5 million (about €1290).[37] In the UK, gross average annual household
income was defined as £20 000 (about €33 333).[38]
b Definition of low/high education level: Italy: ≤14 years of age/≥15 years; UK: ≤15 years of age/≥16 years. c Only half of the Italian sample answered this question.
bought to cover the cost of all prescriptions dispensed during a products, which are available in both Italy and the UK. In the UK, subsequent period of 4 or 12 months.5 75% of dyspepsia sufferers do not consult their GP.[24]
To inform the design of the survey instrument, a series of focus groups were conducted with physicians[11,17,25,26] and patients[27,28]
The Dataset: Methodological Issues, Questionnaire
in both participating countries, thus ensuring cross-country rele-Design and Description of the Relevant Variables
vance of the issues explored. The English source questionnaire In order to explore consumer decision-making behaviours in a was translated into Italian, re-translated into English and any non-hypothetical manner, patients with two distinctly different mismatches corrected.[29] 6 The piloted questionnaire was
struc-conditions, hypertension and dyspepsia, were targeted. These pro- tured in four sections containing information on the patients’ vide examples of conditions with very different symptom profiles, general health status and their use of medical services, condition-long-term health implications and treatment options (both for GPs related questions (not presented in this article), questions and and patients). Hypertension is an example of a chronic condition statements addressing the patients’ behaviour and views with with important implications for long-term morbidity and mortali- respect to medication cost issues and, finally, information on ty, affecting about 20–22% of the adult population in both coun- demographics and income. Attitude statements explored strategies tries.[21] Hypertension is an asymptomatic condition, i.e. patients patients used to cope with medication cost, and were grouped into
do not generally feel ill because of high blood pressure, but two types: (i) those that were patient initiated; and (ii) those where medication can have adverse effects, and compliance with antihy- patients used self medication with products purchased OTC. Pa-pertensive medication is often problematical.[22] Furthermore, tient affordability was measured ‘subjectively’. Some of the
ques-treatment is generally long term. With regard to cost, this means tions asking for health status and sociodemographic characteristics that patients will receive regular, sometimes multiple, prescrip- were based on existing large-scale surveys, such as the ISTAT tions with associated prescription charges. (Istituto Nazionale di Statistica) multipurpose survey (Italy Dyspepsia is a condition presenting with acute symptoms in the 1998),[30,31] the European Community Household Panel (ECHP
upper gastrointestinal tract, caused by a range of pathologies.[23] 1998),[32] the Health Survey for England 1999,[33] the National
The prevalence of dyspepsia is about 30%.[24] Besides using Survey of NHS Patients 1998 (UK)[34] and the Survey of Activity
prescribed medication, many patients self medicate with OTC and Health 1990 (UK).[35]
5 The cost of PPCs at the time of the study was £31.40 (€52.00) and £86.20 (€144.00) for 4 and 12 months, respectively. They make financial sense for people who receive two or more prescription items per month.
Patients were eligible if they had either dyspepsia or mild expected to influence patients’ decision making with respect to the hypertension. They were sampled as successive patients who use of medication. Some of these relationships (such as between visited 51 physicians in Italy and 21 community pharmacies in the income and health) have been widely researched in previous UK during a set period of time in 2000. Italian physicians handed studies and evidence is available in the published literature.10 questionnaires to patients they diagnosed as having dyspepsia or Other relationships were identified in the exploratory focus groups mild hypertension. Of the 550 dyspepsia and 600 hypertension forming part of the preliminary stages of this project. There is questionnaires distributed during July and November, 122 and 153 little, if any, published evidence about these other relationships, were returned – a response rate of 22.2% and 25.5%, respectively. and our survey questionnaire was developed to address these gaps In the UK, 296 dyspepsia and 277 hypertension questionnaires in knowledge. Among them is the relationship existing between were distributed between June and September, targeting dyspepsia patient ‘affordability’ and patient ‘cost-reducing strategies’. Fur-sufferers who bought OTC medicines, and dyspepsia and hyper- thermore, as shown in figure 1, the data obtained from the survey tension patients7 who had to pay prescription charges or had a allow the testing of an even more complex structure of determi-PPC; 110 dyspepsia and 134 hypertension questionnaires were nants that can influence patients’ decision-making behaviour. The returned, giving respective response rates of 37.2% and 48.4%. different relationships (as shown in figure 1) will be discussed in Follow-up mailings to increase response rates were not possible, more detail below, using six hypotheses (H1–H6) formed during as patient contact details were not available to the research team method development.
because of existing data protection policies in both countries.[36] 8
•
H1: Income level (Y) is one of the main factors influencing the The main sociodemographic characteristics of the sample are patient’s level of affordability (AF). It is assumed that lower reported in table I. In both countries, most respondents were not income groups are more likely to have affordability problems. exempt.9 In Italy, this is due to the relatively low prevalence of full This hypothesis is crucial for our study. To our knowledge, the exemption, whereas in the UK the sampling specifically targeted concept of a self-rated measure of patient affordability is new in patients who were not exempt. this type of analysis. It is then important to check the relationship It is quite difficult to compare these findings with official between this measure and an indicator such as income, where Italian and UK data, since our samples were drawn from limited income is only likely to be one of several factors that could areas of Rome and Manchester and parts of their suburbs. Further- influence patient affordability. Conditioning patient affordability more, the samples comprise only individuals with either dyspepsia on a wider set of variables could be important for policy reasons. or hypertension and therefore cannot be compared with national In fact, individual demographic characteristics (age, sex, educa-statistics such as census data. However, our aim is not togeneral-ise our findings beyond the population from which our samples were drawn, but to give a general impression of the level of importance of the findings and how they compare across the two samples.
Theoretical Framework
The data gathered through the survey allow us to explore several aspects of patients’ behaviour. For illustrative purposes, the theoretical framework was developed in the form of a flow chart (figure 1). This summarises the main factors that can be
Cost-reducing strategies (CRS) Affordability (AF) Health status (HS) Income (Y) H1 H6 H3 H4 H5 H2
Fig. 1. The theoretical framework. Direction of arrow represents direction
of causation; dashed line with arrows at both ends shows that there may be reverse causation. H1…H6 = hypothesis 1 … hypothesis 6.
7 UK pharmacists were provided with a list of drugs indicated in the two conditions, and were then asked to check with patients that they were indeed taking their medication for either dyspepsia or hypertension.
8 In this respect, it is useful to note that the Italian response rate may be considerably underestimated. In fact, in several circumstances we have not been able to recover from GPs the questionnaires that were not distributed, and in four cases GPs decided to withdraw from the study after receiving the questionnaires (accounting for 100 questionnaires). UK studies where questionnaires were handed out in pharmacies achieved similar response rates, ranging between 34% and 88% (median 50%).
9 We define an exempted patient as a patient with full exemption from any payment for prescribed medicine.
10 The book Equity in the Finance and Delivery of Health Care: an International Perspective by van Doorslaer et al.[39] includes some of the best
known articles on this subject; also see Wolfe,[40] the recent Future of Children[41] on child health and managed care, and Blackburn[42] and Blaxter.[43]
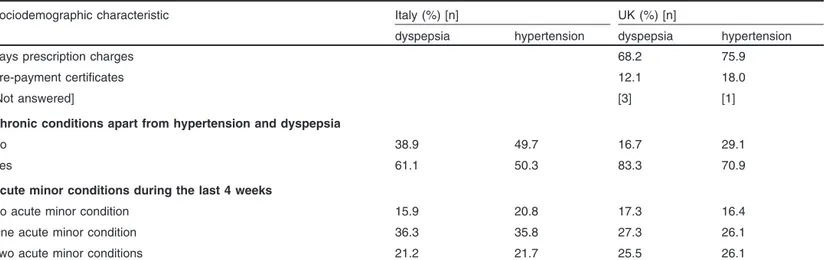
Table II. Proportions of patients who use various strategies to reduce the cost of their medication, by country, condition and affordability problemsa
Strategy group Italy UK
dyspepsia hypertension dyspepsia hypertension
no affordability no affordability no affordability no affordability
affordability problems affordability problems affordability problems affordability problems
problems problems problems problems
Patient-initiated strategies
Avoids GP visit 0.059 0.154 0.019 0.161 0.000 0.263 0.000 0.205
Drug not dispensed 0.206 0.474 0.038 0.376 0.000 0.313 0.023 0.227
Takes less drug, i.e. 0.059 0.192 0.019 0.204 0.000 0.200 0.000 0.148
reduces dose
Drug not dispensed until 0.029 0.308 0.058 0.247 0.000 0.363 0.000 0.443
patient gets paid
Only some of the items of 0.088 0.256 0.077 0.194 0.000 0.350 0.023 0.364
the prescription dispensed, i.e. prioritises
Borrows money 0.000 0.128 0.000 0.097 0.000 0.338 0.023 0.273
Self-medication strategies
Gets prescription because 0.471 0.590 0.327 0.570 0.036 0.288 0.023 0.295
OTC product too expensive
Asks pharmacist to 0.147 0.256 0.038 0.258 0.036 0.275 0.070 0.193
recommend cheaper OTC product
Considers price of OTC 0.353 0.538 0.173 0.452 0.214 0.588 0.256 0.682
product
Prefers OTC product to GP 0.206 0.282 0.212 0.312 0.536 0.538 0.442 0.614
visit
Does not takes anything 0.029 0.179 0.019 0.129 0.000 0.100 0.000 0.148
Buys cheaper of two OTC 0.176 0.397 0.077 0.204 0.107 0.413 0.140 0.489
products
a The complete wording of the attitude statements can be found in Schafheutle et al.[49]
GP = general practitioner; OTC = over the counter.
tion, etc.) could provide more important determinants than in- Questionnaire Design and Description of the Relevant Variables’),
come. and two further health status variables measured the number of
acute (minor) and chronic conditions, besides dyspepsia or
hyper-•
H2: Income level (Y) influences the patient’s health statustension. (HS). It is assumed that lower income groups are more likely to
have health problems.
•
H3: The level of affordability (AF) influences patients’ health status (HS). It is assumed that patients with affordability There is extensive literature on the links between income andhealth. Many researchers have also questioned whether there is a problems have poorer health status. reverse causation between health and income, whereby people
As already discussed, while the literature is extensive regarding with poor health status work less and therefore have a lower
the links between income and health, no similar evidence seems to income.[44] In this study, we presume that causation proceeds from
exist on the relationship between patient affordability and health income to health. In order to test this, a number of indicators were
status. used in the questionnaire to the measure health status and the
co-•
H4: The level of affordability (AF) influences cost-reducing morbidity of respondents. Three ‘subjective’ health statusvari-strategies (CRSs). It is assumed that patients with affordability ables were based on existing and validated large-scale national
Very little is known about whether and how medication costs Patient Affordability and Cost-Reducing Strategies: Some Stylised Facts
influence the way patients deal with their conditions and if they do anything to help them cope with medication cost issues,
particular-Our self-rated affordability measure showed that quite a large ly if they experience affordability problems. This study is unique
percentage of patients in our sample (70.3% in the UK and 66.5% in addressing this, and the following section will concentrate on
in Italy) have to think about the cost of medicines at least some-reporting the relevant results obtained from the survey.
times. As many as 24.3% and 16.3%, respectively, said they
•
H5: Income level (Y) influences the use of cost-reducing strate- always have to think about how much money they have available gies. It is assumed that lower income groups are higher users of to spend when they obtain medicines. Nearly two-thirds of respon-cost-reducing strategies. dents declared a level of household income on or below theaverage of the income distribution (table I). Even though in H4 we have already discussed the relationship
Table II shows the proportion of respondents who used individ-between patient affordability and patient cost-reducing behaviour,
ual strategies, subdivided as follows, to reduce the cost of medica-we believe that it is interesting to understand what the direct effect
tion: (i) those initiated by patients and (ii) those involving self of income level is on patient cost-reducing behaviour.
Neverthe-medication. The results show that patients with affordability less, we believe that a subjective measure of patient affordability
problems adopt numerous strategies, and use them more frequent-may constitute a better explanatory variable than income in
ex-ly. Cost-reducing behaviour is more pronounced in the UK than plaining cost-reducing behaviour. In fact, we know that income
Italy, particularly with respect to patients failing to have their measures normally include errors due to under-reporting in
drug(s) dispensed. surveys, while patient affordability, being a subjective, self-rated
According to the results shown in table II, the patient-initiated variable, should be more dependable. Furthermore, we believe that
strategy most commonly used by Italian respondents with afford-our affordability measure may represent a multidimensional
indi-ability problems is not having a medicine dispensed. In the UK, cator of patients’ economic, financial and social situations,
com-respondents with affordability problems most commonly delay the pared with the unidimensionality of income.
dispensing of drugs until they get paid. Other relatively commonly
•
H6: Health status (HS) influences the use of cost-reducing used strategies identified by these respondents were not visiting strategies. It is assumed that patients with a poor health status the GP to avoid incurring the cost of prescribed medication, and are higher users of cost-reducing strategies. reducing the dose below that prescribed to extend the course of It is has been observed in the literature that a poor health status medication.has a positive effect on demand for hospitalisation[45-47] and
physi-More important findings emerge when examining the use of cian visits.[48] No evidence seems to exist on the relationship self-medication strategies. Both Italian and UK respondents were
between health status and medication cost-reducing strategies cost conscious when choosing strategies involving OTC products. adopted by patients. Respondents with affordability problems were more likely to
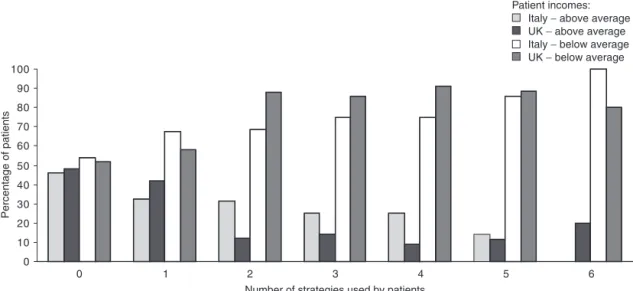
0 10 20 30 40 50 60 70 80 90 100 0 1 2 3 4 5 6
Number of strategies used by patients
Italy − above average
UK − above average
Italy − below average UK − below average Patient incomes:
Percentage of patients
0 10 20 30 40 50 60 70 80 90 100 0 1 2 3 4 5 6
Number of strategies used by patients
Italy − above average
UK − above average
Italy − below average UK − below average Patient incomes:
Percentage of patients
Fig. 3. Percentage of patients using self-medication strategies.
consider the price of an OTC product before buying it, or they cases, such as H1, H5 and H6, the relationship is quite straightfor-ward and could be modelled in the following way (equation 1–3): would ask for something cheaper if they could not afford a
particular OTC product. Again, affordability appears to have a H1: AFi = f(Yi, DEMi)
(Eq. 1) stronger effect on UK than Italian respondents. There are two
possible reasons for this. H5: CRSji = f(Yi, DEMi)
(Eq. 2) Firstly, this may be due to the different ways in which Italian
H6: CRSji = f(HSi, DEMi)
and UK patients were sampled. Italian patients with dyspepsia
(Eq. 3) were sampled only through GPs and may therefore be those more
where the index j represents the j-th cost-reducing strategy em-severely affected and/or less likely to be disposed towards self
ployed by the i-th patient and where DEM is a vector of patient medication. Secondly, and importantly, in Italy OTC products are
sociodemographic characteristics upon which the relationship is much more expensive in relation to the relatively low prescription
conditioned to take into account patient heterogeneity. The analy-charge than they are in the UK, where the prescription analy-charge is
sis becomes more complex by recognising, for example, that HS is high.[19] 11 This may also explain the finding that, independent of
a function of AF, which in turn is a function of Y. By exploiting the affordability, about half of all Italian respondents stated they get a
econometric properties of the recursive systems it is interesting to prescription because an OTC product is too expensive.
test the joint hypothesis of H1 and H3 (equation 4): In figure 2 and figure 3 we report, by country and income level,
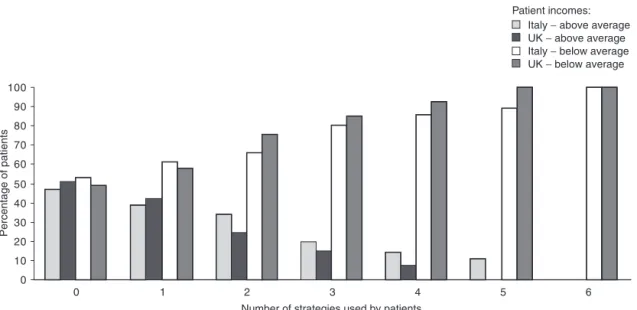
the percentage of respondents who adopt a certain number of
î í ì = = ) , ( ) , , ( : 3 & 1 DEM Y f AF DEM Y AF f HS H H
patient-initiated and self-medication strategies. This shows, for
(Eq. 4) both countries, that respondents with a below-average household
An even more complex structure appears when CRSs become the income use more strategies. Furthermore, in the UK, respondents
dependent variable. In this case, the system of structural equations generally use a larger number of strategies than in Italy. This
becomes (equation 5): phenomenon is more marked for self-medication strategies.
On the basis of this evidence, we ran an econometric analysis to test the theoretical hypotheses discussed in the section titled
Theo-retical Framework. The theoTheo-retical framework depicted in figure 1 ïî
ï í ì = = = ) , ( ) , , ( ) , , , ( : 6 & 5 & 4 & 3 & 2 & 1 DEM Y f AF DEM Y AF f HS DEM AF Y HS f CRS H H H H H H j
was analysed through a set of structural relationships. In some (Eq. 5)
11 In the UK, prices for OTC products for dyspepsia vary between approximately €0.60 and €3.50 for small packs of antacids, alginates and peppermint water, and approximately €3.30 to €4.00 for a small course of H2 antagonists.[50] Italian prices for the cheapest OTC products range from €4.20 for antacids to €5.90 for H2 antagonists.
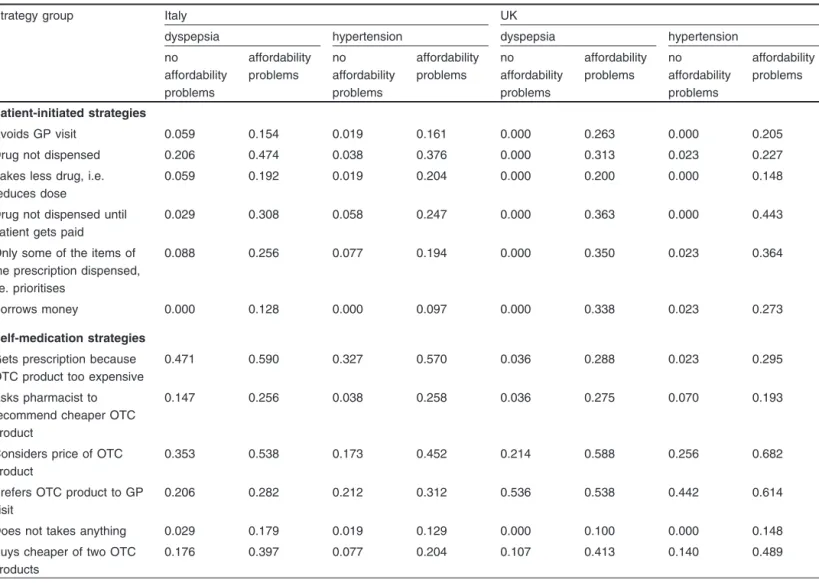
Table III. Econometric results from seemingly unrelated regression (SUR) estimation (simultaneous variance covariance matrix [VCE])
Explanatory variables Italy (n = 242) UK (n = 239)
parameter t-test p > |t| parameter t-test p > |t|
Equation 1. Dependent variable: level of income
Probit model Age –0.2246 –4.390 0.000 0.2334 3.310 0.001 Age squared 0.0020 4.670 0.000 –0.0026 –3.340 0.001 Sex 0.1817 0.980 0.328 –0.4359 –2.520 0.012 Education 0.5589 4.930 0.000 0.2978 3.840 0.000 Health status –0.2320 –1.630 0.104 –0.2881 –2.280 0.023 Family size 0.3048 3.330 0.001 0.0690 0.780 0.434
Number of acute conditions –0.1371 –2.290 0.022 –0.1301 –2.120 0.034
Constant 4.9642 2.860 0.004 –5.6348 –3.170 0.002
Equation 2. Dependent variable: patient affordability
Ordered probit model
Household income 0.7129 4.040 0.000 1.0469 5.850 0.000 Age 0.0441 1.300 0.192 –0.0758 –1.480 0.140 Age squared –0.0003 –1.110 0.268 0.0010 1.840 0.066 Education 0.1475 2.110 0.035 0.0403 0.810 0.417 Family size –0.0879 –1.150 0.249 –0.0068 –0.100 0.920 κ1 – cut-off point 1.3958 1.370 0.172 –0.4496 –0.350 0.728 κ2 – cut-off point 1.9521 1.900 0.057 0.0344 0.030 0.979 κ3 – cut-off point 3.0312 2.960 0.003 0.9176 0.720 0.472
Equation 3. Dependent variable: health status – number of chronic conditions
Poisson model
Level of patient affordability –0.0782 –2.170 0.030 –0.1281 –3.270 0.001
Age –0.0257 –2.870 0.004 0.0406 3.690 0.000 Age squared 0.0002 2.610 0.009 –0.0004 –2.680 0.007 Condition 0.7450 7.890 0.000 0.1518 1.800 0.073 Sex 0.0364 0.560 0.578 0.0980 1.190 0.235 Education –0.0471 –1.770 0.077 –0.0696 –2.170 0.030 Family size –0.0454 –1.670 0.094 –0.0092 –0.230 0.821
Equation 4. Dependent variable: number of patient-initiated strategies
Poisson model
Number of health problems 0.0267 0.580 0.564 –0.0550 –1.660 0.098
Number of chronic conditions –0.0085 –0.150 0.881 0.0464 0.630 0.532
Number of acute conditions 0.1907 3.620 0.000 0.0675 1.450 0.148
Level of patient affordability –0.4177 –6.160 0.000 –0.7865 –10.960 0.000
Age 0.0233 1.180 0.238 0.1133 5.220 0.000
Age squared –0.0002 –1.110 0.266 –0.0016 –5.930 0.000
Sex 0.1762 1.010 0.313 0.1341 0.970 0.330
Condition –0.0913 –0.510 0.607 –0.0146 –0.090 0.930
Table III. Contd
Explanatory variables Italy (n = 242) UK (n = 239)
parameter t-test p > |t| parameter t-test p > |t|
Equation 5. Dependent variable: number of self-medication strategies
Poisson model
Number of health problems –0.0254 –0.630 0.530 –0.0075 –0.290 0.771
Number of chronic conditions –0.0614 –0.770 0.439 –0.0631 –1.430 0.153
Number of acute conditions 0.0896 2.070 0.038 0.0870 2.390 0.017
Level of patient affordability –0.2651 –5.110 0.000 –0.2104 –4.770 0.000
Age 0.0502 3.580 0.000 0.0386 2.820 0.005
Age squared –0.0005 –3.140 0.002 –0.0006 –3.060 0.002
Sex 0.0569 0.470 0.637 0.1913 2.060 0.039
Condition –0.0676 –0.490 0.626 0.2068 1.880 0.060
By simply looking at the signs and statistical significance of the We explored two types of strategies that patients use to cope with medication cost: (i) those they initiated themselves in relation parameters, it was possible to make a formal test of the
earlier-to prescribed medication; and (ii) those involving self medication mentioned hypotheses. From an econometric point of view, a
with OTC products. The latter adds an innovative dimension, reasonable way to explore the data was to model the categorisation
particularly in terms of the level of detail examined in this survey. that took place when the data were created. In the case of
dichoto-Self medication can be an important alternative to prescribed mous dependent variables, a logit or probit model was used,
medication, as in the case of dyspepsia, and may provide an whereas in the case of polytomous dependent variables, an ordered
important way of managing cost.[54]
logit or probit model was used for this purpose.12 For those cases
There is a strong tendency for both Italian and UK respondents where a count variable exists, a count data model was employed.
to use medication cost-reducing strategies, and this is strongly Furthermore, as shown above, the existence of a recursive
struc-influenced by income and cost-related difficulties (i.e. patient ture in the theoretical model has allowed us to use a seemingly
affordability problems). Even though important in both countries, unrelated regression (SUR) estimation approach.
patient affordability affects the adoption of cost-reducing strate-The results obtained for Italy and the UK (table III and table IV)
gies differently in the samples from the two countries. For patient-clearly confirm almost all the theoretical framework presented in
initiated strategies, patient affordability has almost double the
figure 1. This is even though significant differences exist between
influence in the UK than is observed in Italy. Even though there respondents’ behaviour in Italy and the UK.13
may be several reasons for this, we believe that it may be account-ed for by the large difference between the levels of prescription
Discussion charges in Italy and the UK. The UK prescription charge (€9.80
per item) is much higher than that paid by Italian patients for class Our econometric model has allowed us to test several hypothe- A (€1.7), the most commonly prescribed category, even if costs ses. As a measure of respondents’ ability to pay for their medica- are adjusted for purchasing power parity.
tion, referred to here as ‘affordability’, we have introduced the Similar conclusions can be derived for self-medication strate-novel concept of a self-rated measure, rather than simply relying gies, yet there are marked differences between the two countries. on proxy measures such as income. In fact, even though our self- In Italy, the most commonly used strategy is to get a prescription, rated affordability measure is linked to income, we have found it to because buying an OTC product is too expensive. Again, this can be a stronger predictor of respondents’ use of cost-reducing strate- probably be explained by the relatively low Italian prescription gies than income. The fact that the same survey questionnaire was charge. UK respondents, on the other hand, most commonly applied in two European countries, i.e. Italy and the UK, has considered the cost of particular OTC products before buying allowed us to explore and compare respondents’ adoption of drug them. Therefore, the results show that respondents with affordabil-cost-containment strategies with an international perspective. ity problems are conscious of the cost of different management
12 See Greene[51] and Stata 8.0 Reference Manual.[52]
options and employ different strategies accordingly. The types of Atella et al.,[58] who explore the effect of co-payment changes on
drug compliance using a large panel of Italian patients treated for strategies vary depending on the constraints operating and the
hypertension (about 75 000 followed over 6 years). options available within individual countries (and reimbursement
It should be noted that noncompliance with medication because systems). Self-medication strategies may be a reasonable and
of affordability issues can have serious implications for health affordable alternative (when an OTC product is available, i.e. for
outcomes. Although research linking issues of medication cost to self-treatable conditions), particularly for UK patients.
health outcomes is scarce, two North American studies have There is evidence in the published literature that supports our
demonstrated just such a negative impact. Soumerai et al.[59]
findings. Studies have shown that price elasticity can vary between
showed increases in mental health service use, and Tamblyn et different therapeutic groups of drugs[55,56] and that increases in
co-al.[9] linked increased adverse events (e.g. emergency department
payments affect essential drugs to a lesser extent than
non-essen-visits or death) among low-income patients, to increases in cost tial drugs.[3,9] In addition, some of these studies showed a link to
sharing. socioeconomic groups[56] or income.[55] Kennedy et al.[57] provide
the most recent self-reported evidence for medication cost-related
Conclusions noncompliance and variation between subgroups. For example,
working-age adults, Medicaid and Medicare beneficiaries, those This cross-country survey has proven to be an important contri-with low incomes and those contri-without health insurance were most bution to the existing literature on the (potentially negative) im-severely affected. Furthermore, Lexchin and Grootendorst[13] and
pact of co-payment systems on the uptake of prescribed medica-Rice and Matsuoka[14] have recently reviewed the literature
specif-tion. The study is innovative in its approach, seeking individual ically exploring the impact of cost sharing on vulnerable groups patients’ views and experiences in coping with the cost of medica-such as seniors, the poor and those with chronic conditions. The tion, linking these with socioeconomic and health attributes, and strength of these US studies is that they demonstrate that, without allowing the level of heterogeneity existing at the patient level to aid or protection, those populations on the lowest incomes have be properly taken into account. Furthermore, by providing insight the lowest uptake of prescription medicines and thus the poorest into the range of behaviours adopted by patients who are unable to outcomes. Similar conclusions have recently been reached by meet the cost of prescribed medication given the competing
de-Table IV. Marginal effects of patient affordability on the probability of adopting patient-initiated strategies or self-medication strategies
Strategies Italy UK
dyspepsia hypertension dyspepsia hypertension
Patient-initiated strategies
Avoids GP visit 0.05a 0.04a 0.12 0.08
Drug not dispensed 0.14 0.17 0.14 0.10
Takes less drug, i.e. reduces dose 0.07a 0.10 0.07 0.04
Drug not dispensed until patient gets paid 0.13 0.05 0.19 0.20
Only some of the items of the prescription 0.09 0.08 0.19 0.14
dispensed, i.e. prioritises
Borrows money 0.05 0.01a 0.15 0.10
Self-medication strategies
Gets prescription because OTC product is too 0.12 0.09 0.06 0.03a
expensive
Asks pharmacist to recommend cheaper OTC 0.11 0.07 0.15 0.04a
product
Considers price of OTC product 0.19 0.15 0.16 0.09
Prefers OTC product to GP visit 0.03a 0.05a 0.00a 0.02a
Does not take anything 0.09 0.03a 0.00 0.05
Buys cheaper of two OTC products 0.18 0.09 0.11 0.11
a Nonsignificant at 5%.
10. Atella V. Drug cost containment policies in Italy: are they really effective in the
mands on their finances, it adds to the existing literature on
long-run? The case of minimum reference price. Health Policy 1999; 50:
medication co-payment and the associated problems of reduced 197-218
11. Atella V. Physicians’ prescription behavior and cost to the patients in Italy: first
consumption and affordability. It introduces the notion of a
self-evidence based on focus group techniques and prescription data. In: Huttin C,
rated affordability measure and explores its relationship with editor. Patient charges and decision-making behaviors of consumers and physi-income, health status and cost-containment behaviour. cians. IOS Press: Amsterdam, 2003: 63-91
12. Atella V, Rosati FC. Spesa, equit`a e politiche sanitarie in Italia negli anni ’90: quali
It is important to note that our results are not merely relevant to
insegnamenti per il futuro. Politica Sanitaria 2002; 3 (1): 3-17
the two countries from which the samples were drawn. Evidence is 13. Lexchin J, Grootendorst P. Effects of prescription drug user fees on drug and health
services use and on health status in vulnerable populations: a systematic review
emerging from US and Australian surveys that patients in very
of the evidence. Int J Health Serv 2004; 34: 101-22
different healthcare systems, when faced with the same problem,
14. Rice T, Matsuoka KY. The impact of cost-sharing on appropriate utilization and
i.e. that of affordability problems, use many similar cost-reducing health status: a review of the literature on seniors. Med Care Res Rev 2004; 61: 415-52
strategies.[60-62] However, some strategies differ, reflecting the
15. Freemantle N, Bloor K. Lessons from international experience in controlling
cultures or systems in which they occur. pharmaceutical expenditure: I. Influencing patients. BMJ 1996; 312: 1469-71 The findings from this study have important policy implica- 16. McManus P, Donnelly N, Henry D, et al. Prescription drug utilization following patient co-payment changes in Australia. Pharmacoepidemiol Drug Saf 1996; 5:
tions. Buying an equivalent OTC product for less than a
prescrip-385-92
tion charge is a reasonable substitution. However, the use of many 17. Hassell K, Atella V, Schafheutle EI, et al. Cost to the patient or cost to the
healthcare system? Which one matters the most for GP prescribing decisions? A
of the cost-reducing strategies detailed in this study would suggest
UK-Italy comparison. Eur J Public Health 2003; 13: 18-23
that patients, when faced with affordability problems, do not
18. Ham C. Health policy in Britain. Hampshire: McMillan Press Ltd, 1999
comply with prescribed therapy. This is the situation, for example, 19. Noyce PR, Huttin C, Atella V, et al. The cost of prescription medicines to patients.
Health Policy 2000; 52: 129-45
when patients use a lower than prescribed dose, or do not obtain
20. Department of Health. Prescriptions dispensed in the community, statistics for
some or any of their medication.
1993 to 2003: England, statistical bulletin 2004/12. London: Department of Health, 2004
21. Office for Population Censuses and Surveys. Health Survey for England 1995.
Acknowledgements
London: The Stationery Office, 1997
22. McInnes GT. Integrated approaches to management of hypertension: promoting This paper stems from research activity conducted as part of a wider
treatment acceptance. Am Heart J 1999; 138 (3 Pt 2): 252-5 research project sponsored by the BIOMED program (Framework IV) of the
23. Nathan A. A non-prescription medicines formulary: 5. Products for indigestion. European Union, contract number BMH4 – 98 – 3576. A special thank you is
Pharm J 1996; 256: 678-82 due to Roberto Chiaverini and Giulio Nati, who helped organise and run the
24. Jones R, Lydeard S. Prevalence of symptoms of dyspepsia in the community. BMJ surveys with patients and physicians. FIMMG, the Italian federation of
1989; 298: 30-2
general practitioners, provided invaluable logistic support. We would like to 25. Weiss MC, Hassell K, Schafheutle EI, et al. Strategies used by general practitioners
thank staff in the 21 UK community pharmacies, who assisted with patient to minimise the impact of the prescription charge. Eur J Gen Pract 2001; 7: 23-6
recruitment, and all respondents to this survey. The usual disclaimers apply. 26. Huttin C, Andral J. How the reimbursement system may influence physicians’
decisions: results from focus groups interviews in France. Health Policy 2000; The authors have no conflicts of interest that are directly relevant to the
54: 67-86 content of this study.
27. Schafheutle EI, Hassell K, Noyce PR, et al. Access to medicines: cost as an influence on the views and behaviour of patients. Health Soc Care Community 2002; 10: 187-95
References
28. Huttin C. Patient charges and decision-making behaviors of consumers and physi-1. Jacobzone S. Pharmaceutical policies in OECD countries: reconciling social and
cians. Amsterdam: IOS Press, 2003 industrial goals [occasional paper no. 40]. Paris: OECD Labour Market and
29. Schafheutle EI, Hassell K, Noyce PR. Developing an instrument for studying the Social Policy, 2000
impact of patient charge systems for pharmaceuticals on the uptake of 2. Leibowitz A, Manning W, Newhouse J. The demand for prescription drugs as a
medicines. Proceedings of the European Public Health Association (EUPHA) function of cost sharing. Soc Sci Med 1985; 21: 1063-9
congress; 2000 Dec 14-16; Paris. Vandoeuvres-l`es-Nancy: Soci´et´e Fran¸caise de 3. Soumerai SB, Avorn J, Ross-Degnan D, et al. Payment restrictions for drugs under
Sant´e Publique, 2000: 290 Medicaid: effects on therapy, cost and equity. N Engl J Med 1987; 317: 550-6
30. ISTAT (Istituto Nazionale di Statistica). Indagine multiscopo sulle famiglie. 4. O’Brien B. The effect of patient charges on the utilisation of prescription
Rome: Condizioni di salute, 1998 medicines. J Health Econ 1989; 8: 109-32
31. ISTAT Multi-purposes survey (Italy 1998) [online]. Available from URL: http:// 5. Harris BL, Stergachis A, Ried LD. The effect of drug co-payments on utilization
www.istat.it/dati/catalogo/20041214_00/ [Accessed 2005 Jun 20] and cost of pharmaceuticals in a health maintenance organization. Med Care
1990; 28: 907-17 32. European Community Household Panel (ECHP) [online]. Available from URL: http://forum.europa.eu.int/irc/dsis/echpanel/info/data/information.html [Ac-6. Ryan M, Birch S. Charging for health care: evidence on the utilization of NHS
cessed 2005 Jun 20] prescribed medicines. Soc Sci Med 1991; 33: 681-7
7. Huttin C. The use of prescription charges. Health Policy 1994; 27: 53-73 33. National Centre for Social Research and University College London. Department of Epidemiology and Public Health, Health Survey for England, 1999. 3rd 8. Hughes D, McGuire A. Patient charges and the utilization of NHS prescription
edition [online]. Available from URL: www.data-archive.ac.uk/doc/4365/ medicines: some estimates using a cointegration procedure. Health Econ 1995;
mrdoc/UKDA/UKDA_Study_4365_Information.htm [Accessed 2005 Jun 20] 4: 213-20
9. Tamblyn R, Laprise R, Hanley JA, et al. Adverse events associated with prescrip- 34. Department of Health. National Survey of NHS Patients 1998 [online]. Available tion drug cost-sharing among poor and elderly persons. JAMA 2001; 285: from URL: www.dh.gov.uk/PublicationsAndStatistics/PublishedSurvey/Nat
35. The Health Education Authority. Survey of activity and health; 1990 [online]. 51. Greene WH. Econometric analysis. 3rd ed. Upper Saddle River (NJ): Prentice Hall, Available from URL: http://qb.soc.surrey.ac.uk/surveys/sah/sah90.htm [Ac- 1993
cessed 2005 Jun 20]
52. Stata 8.0 Reference Manual. College Station (TX): Stata Corporation, 2003 36. Smith F. Health services research methods in pharmacy. Survey research: (1)
53. Atella V, Hassell K, Schafheutle E, et al. Do consumers adopt drug cost contain-design, samples and response. Int J Pharm Pract 1997; 5: 152-66
ment strategies? Empirical evidence from Italy and in UK [CEIS Working 37. Bank of Italy 1998 Survey on Household Income and Wealth. Supplementi al Paper no. 160]. Rome, 2004
bollettino statistico: note metodologiche e informazioni statistiche “I bilanci
54. Schafheutle EI, Hassell K, Seston EM, et al. Non-dispensing of NHS prescriptions delle famiglie italiane nell’anno 1998”. Rome: Bank of Italy, 2000
in community pharmacies. Int J Pharm Pract 2002; 10: 11-5 38. Office for National Statistics. Social trends 30. London: The Stationery Office,
55. Stuart B, Grana J. Ability to pay and the decision to medicate. Med Care 1998; 36: 2000: 92
202-11 39. Van Doorslaer E, Wagstaff A, Rutten F, editors. Equity in the finance and delivery
of health care: an international perspective. Oxford: Oxford Medical Publica- 56. Lundberg L, Johannesson M, Isacson DGL, et al. Effects of user charges on the use tions, 1993 of prescription medicines in different socio-economic groups. Health Policy
1998; 44: 123-34 40. Wolfe BL. Confronting poverty: prescriptions for change. In: Danziger SH,
Sandefur GD, Weinberg DH, editors. Reform of health care for the nonelderly
57. Kennedy J, Coyne J, Sclar D. Drug affordability and prescription noncompliance in poor. Cambridge and London: Harvard University Press, 1994: 253-88
the United States: 1997-2002. Clin Ther 2004; 26: 607-14 41. Future of children: children and managed health care. Vol. 8, no. 2 (summer-fall).
58. Atella V, Depalo D, Peracchi F, et al. Medical compliance, co-payment and health Los Altos (CA): The David and Lucille Packard Foundation, 1998
outcomes: evidence from a panel of Italian patients [online]. Available from 42. Blackburn C. Poverty and health. Milton Keynes: Open University Press, 1991 URL: http://www.econ.ku.dk/CAM/PanelDataConference/Papers/111_Atella. 43. Blaxter M. Health and lifestyles. London and New York: Tavistock/Routledge, pdf [Accessed 2005 Jun 27]
1990
59. Soumerai SB, McLaughlin TJ, Ross-Degnan D, et al. Effect of limiting Medicaid 44. Adams P, Hurd MD, McFadden D, et al. Healthy, wealthy, and wise? Tests for drug-reimbursement benefits on the use of psychotropic agents and acute direct causal paths between health and socioeconomic status. J Econom 2003; mental health services by patients with schizophrenia. N Engl J Med 1994; 331:
112 (1): 3-56 650-5
45. Wagstaff A. 1986. The demand for health: some new empirical evidence. J Health
60. Doran E, Robertson J, Rolfe I, et al. Patient co-payments and use of prescription Econ 1986; 5 (3): 195-233
medicines. Aust NZ J Public Health 2004; 28 (1): 62-7 46. Cameron AC, Trivedi PK, Milne F, et al. A microeconometric model of the
61. Cox ER, Henderson RR. Prescription use behaviour among Medicare beneficiaries demand for health care and health insurance in Australia. Rev Econ Stud 1988;
with capped prescription benefits. J Manag Care Pharm 2002; 8: 360-4 55: 85-106
62. Cox ER, Jernigan C, Joel Coons SJ, et al. Medicare beneficiaries’ management of 47. Windmeijer FAG, Santos Silva JMC. Endogeneity in count data models: an
capped prescription benefits. Med Care 2001; 39: 296-301 application to demand for health care. J Appl Econom 1997; 12: 281-94
48. Atella V, Brindisi F, Deb P, et al. The determinants of access to physician services: a latent class Probit approach. Health Econ 2004; 13: 657-68
Correspondence and offprints: Dr Vincenzo Atella, CEIS – SEFEMEQ, 49. Schafheutle EI, Hassell K, Noyce PR. Coping with prescription charges in the UK.
Faculty of Economics, University of Rome Tor Vergata, Via Columbia 2 – IJPP 2004; 12: 239-46
00133, Roma, Italy. 50. Chemist & Druggist Monthly Price List. Tonbridge: United Business Media, 2000

![Table III. Econometric results from seemingly unrelated regression (SUR) estimation (simultaneous variance covariance matrix [VCE])](https://thumb-eu.123doks.com/thumbv2/123dokorg/8037593.122652/9.897.58.863.152.1083/econometric-seemingly-unrelated-regression-estimation-simultaneous-variance-covariance.webp)


