Costanza Consolandi, Alessandro Innocenti
and Alessandro Vercelli
CSR, rationality and the ethical preferences
of investors in a laboratory experiment
6 / 2009
D
IPARTIMENTODIP
OLITICAE
CONOMICA, F
INANZA ES
VILUPPOU
NIVERSITÀ DIS
IENAD
EPFID
W
ORKING
P
APERS
DEPFID
D
EPARTMENT OFE
CONOMICP
OLICY, F
INANCE ANDD
EVELOPMENTU
NIVERSITY OFS
IENADEPFID Working Papers – 6 / September 2009
CSR, rationality and the ethical preferences of investors in a laboratory experiment
Costanza Consolandia, Alessandro Innocentib, and Alessandro Vercellib
Abstract
This experimental study aims to clarify to what extent and in which direction investors react to CSR (Corporate Social Responsibility) initiatives meant to upgrade the ethical standards of firms beyond the minimal requirements of law. Subjects in the laboratory were invited to invest their endowment in a portfolio of financial assets. We provided information on the expected returns of each stock and on its inclusion in an ethical index, or exclusion from it. Our findings show that subjects’ behavior appears to be a function not only of their individual pay-offs but also of the information on the ethical standards of the firms issuing stocks. Most of them, however, did not show a fully irrational behavior as they consistently correlated the share of stocks with their expected returns. We may conclude that the sizeable reaction of our sample’s investors to the inclusion of a stock in the ethical index, or its exclusion from it, is the fruit of a deliberate choice.
KEYWORDS: ethical stock indexes - Corporate Social Responsibility - investors - experiment
JEL CLASSIFICATION: G30, M14, QO1, Q 56.
CORRESPONDINGAUTHOR: [email protected]
ACKNOWLEDGEMENTS: We thank the Italian Ministry of University and MP Asset Management
SGR for financial support, and Francesco Lo Magistro for laboratory assistance.
aDipartimento di Studi Aziendali e Sociali, University of Siena
bDipartimento di Politica Economica, Finanza e Sviluppo (DEPFID), University of Siena
1. Introduction
This experimental study aims to clarify to what extent and in which direction investors react to new information on the ethical standards of firms. In recent years there has been a sharp growth of CSR (Corporate Social Responsibility) initiatives meant to upgrade the ethical standards of firms beyond the minimal requirements of law. The extensive literature on this issue is not unanimous. The demand of stocks is considered as uncorrelated, positively correlated, or negatively correlated with information on ethical excellence according to the theory embraced and/or the evidence examined (Orlitzky et al., 2003). In a perfect-competition market it is claimed by orthodox economists that maximization of returns by all firms also maximizes social welfare and satisfies at best the legitimate claims of the stakeholders (see, e.g., Friedman, 1970). In addition, the information efficiency attributed to competitive markets implies that specific information on the ethical standards of firms would be redundant, and thus unsubstantial. Real markets, however, are imperfectly competitive so that, in principle, CSR initiatives may affect social welfare for the better or for the worse (Borghesi and Vercelli, 2008, ch.7). A positive correlation is expected mainly because high CSR standards are believed to signal the high quality of management and/or to improve long-term returns (Derwall et al, 2005; Garz et al, 2002; Porter and Kramer, 2006). On the contrary, a negative correlation is expected mainly because the inclusion of all the stakeholders (not only shareholders) in the objective function of the firm may distort managerial choices (Jensen, 2001), while higher CSR standards are believed to imply higher production and commercialization costs that could impinge on returns, at least in the short period (Geczi et al, 2005).
This literature maintains that CSR initiatives may have a sizeable and persistent impact on the ethical standards of firms to the extent to which stakeholders actively and pro-actively react to information on the CSR standards by selecting the most responsible firms. In particular, consumers are expected to shift their demand towards products and services of the most responsible firms. Extensive research on consumer behavior suggests that their reaction to information on the CSR standards of firms is widespread, although rather weak (see, e.g., Sen and Battacharya, 2001). Less explored has been so far the reaction to information about CSR standards by investors selecting the stocks to be included in their personal portfolios. In this case, the sign of the empirical correlation between information about CSR standards and stocks demand cannot be easily established by examining the empirical evidence. Investment strategies are affected by a host of factors whose separate effects are difficult to identify. In
addition, investors are continuously hit by a flow of information about different issues concerning the firm that may include news relevant for the evaluation of the ethical standards of the firms. Thus, it is very difficult to identify the specific impact of CSR information on the investors' behavior.
A way out from this dilemma is offered by the so called ethical stock indexes, that select a subset of shares belonging to a certain stock exchange index complying with a series of requirements that assure the excellence of their CSR standards in their sectors of activity (well-known examples are the Domini 400 Social Index, the Dow Jones Sustainability Index and the FTSE4Goods). The periodic announcement of the stocks included in the index (and excluded from it) provides an information set that is unambiguous, authoritative, and sufficiently isolated from the ordinary information flow, to permit an empirical study of the investors’ reaction. Consolandi et al. (2008) explore the market reaction to such news in the case of the DJSI (Dow Jones Sustainability Index) through an “event study”, showing that a sizeable positive reaction is detectable in the case of inclusion, and a slightly bigger negative reaction in the case of exclusion. However, these results are still ambiguous, in particular because it is not clear whether they derive from a very small reaction of many investors, or from a more sizeable reaction of a limited number of investors. In addition, it is not clear if this reaction comes from the fact that the inclusion of a stock signals managerial excellence, or because ethics is an independent goal of investors’ behavior and, in this case, to what extent we may detect a trade-off between self-interest and ethics.
To answer these questions, we conducted a laboratory experiment to isolate the effects of information about the ethical standards of a firm from other information which may, in principle, affect its stock demand. Lab decision-makers receive an endowment and are invited to allocate it across lotteries simulated by a computer. Subjects are told that their allocations are representative of a financial investment to generate a portfolio of financial assets chosen from a limited list of stocks of the same industrial sector. We provide information on the expected returns of each share and on its inclusion in an ethical index, or exclusion from it. We intend to check whether investors react to information about firms’ ethical standards, as assessed by the ethical fund’s managers.
According to standard decision theory, self-interested decision makers are expected to be only concerned with the maximization of expected returns from their portfolio, so that they are not assumed to react to information on the ethical standards of the firms, unless they believe that such information may reveal relevant information on expected returns. According to the theory of efficient markets, even this possibility is ruled out, since all relevant
information is supposed to be conveyed by the price system. However, in the real world we cannot exclude that the utility function of decision makers also depends on the degree of compliance to the ethical values of the decision makers. This suggests that firms’ ethical standards, at least those that have to do with the well-being of other persons, may play a role in economic decision-making. More generally, in this paper we hypothesize that ethical judgment may influence the decision process. This role would be particularly significant in case we find evidence of a trade-off between expected returns and ethical standards. In this case, it would be in the interest of a profit-maximizing firm to invest in order to upgrade its own ethical standards, to the extent this is justified by the revealed ethical preferences of its would-be investors.
The paper proceeds as follows. Section 2 describes the design of our experiment. Section 3 reports the main experimental findings. Section 4 discusses the relationship between revealed ethical preferences and choice rationality. We conclude in Section 5.
2. Experimental design
Although the economic literature, both theoretical and empirical, increasingly focuses on the principle of Socially Responsible Investment (SRI), we are not aware of laboratory tests that seek to investigate the impact of “ethical” stock indexes on investors' behavior. The purpose of our experiment is to provide laboratory evidence on this issue by testing if investors’ decisions are affected by the disclosure of information on corporate environmental and social responsibility.
Previous empirical work (Hendricks, 1976; Belkaoui, 1980; Milne and Chan, 1999; Chan and Milne, 1999) addresses the issue by submitting questionnaires to professional investors (accountants, bankers, financial analysts). Holm and Rikhardsson (2008) test how the release of information on companies' environmental performance influences investors’ behavior. To answer this question, they pose a series of hypothetical choices to experienced (pension portfolio managers) and novice (graduate students) investors. In contrast, we decided to conduct a laboratory experiment by submitting real choices to students and by paying them on the basis of their actual decisions. Also, in our laboratory experiment, strategic interaction between decision makers was excluded in order to identify in vitro the determinants of individual behavior. We may thus say that this was an experiment on individual financial behavior, rather than on financial market behavior. We believe, however, that the first is a
necessary condition to study the latter.
The experiment was carried out between November 2007 and July 2008 and was conducted in two sessions of 25 subjects each. Participants were students of the University of Siena, recruited from Economics courses through billboards posted on the web and around the University campus. The experiment was computerized using a modified version of the software Z-tree (Fischbacher, 1999). Each subject received a fixed show-up fee of five euros and was paid immediately after the experiment according to the money earned. Each session lasted approximately an hour and subjects were given as much time as they wanted to make their investment allocations.
It was made clear to subjects that other participants were not able to attribute individual choices to individual people. To guarantee this anonymity, all subjects were initially directed to an isolated desk to make their decisions privately. Then, they received the written instructions that were read aloud by the monitor.
Each session was divided in five periods. Each period was composed by five sub-periods, in which subjects had to take a single investment decision. In each sub-period, participants were endowed with 100 tokens each. Subjects were told they had to allocate all the endowment on four stocks, denoted by Alpha, Beta, Gamma and Delta. It was made clear that these stocks were issued by companies belonging to the same industry in order to insulate the object of our experiment from spurious influences.
All the stocks were assigned the same price of 1 token and were differentiated only in terms of their expected returns and of being included, or not included, in an index of social and environmental responsibility.
Stocks’ expected returns probability distributions were fixed as shown in Table 1, which was included in the instructions sheet (see Appendix):
Insert Table 1 around here
---Parameters were chosen such that average expected returns of the four stocks were in decreasing order from Alpha to Delta, while their variances were identical. We choose to equal return variances to isolate investors’ behavior from their risk propensity, a subjective factor difficult to separate from ethical preferences. These probability distributions were kept constant during all sessions. These simple and stationary distributions were adopted to make subjects focus on the information that changed from period to period, namely, the inclusion of stocks in the index of social and environmental responsibility, or their exclusion from it. In
the instructions, it was clearly explained that this information would have been announced at the beginning of each of the five periods and that it was independent on subjects’ investment decisions in the previous periods.
The sequence of inclusions of stocks in the ethical index is presented in Table 2. --- Insert Table 2 around here
---In this way, we intended to investigate if the inclusion of a stock in the ethical index, or its exclusion from it, caused a shift in the investment allocation independently of stocks’ expected returns. Non-inclusion of all the stocks in the first and last periods was aimed at providing a benchmark describing portfolio decisions in the absence of discriminating information on the ethical standards of the stocks issuers.
The net gains from investment were calculated by multiplying the appropriate net return extracted from the given probability distributions by the invested amount. At the end of each session, the tokens possessed by subjects were converted in euros at a predetermined rate of 1 euro for 250 tokens.
Before starting the paid periods, a five-repetition trial was conducted to acquaint subjects with the design and the software.
3. Results
We can identify a few systematic patterns in the decision strategies of the experimental subjects. First of all, they diversify substantially their portfolio, although all stocks are equally risky, and have different expected returns (Table 3).
---Insert Table 3 around here ---As a consequence, portfolios’ expected returns are significantly lower than the maximum possible (Table 4).
---Insert Table 4 around here ---To clarify this point let’s compute expected returns from a portfolio in the following
way:
(1) R = rαxα + rβxβ + rγxγ + rδxδ,
where R designates the expected returns from the entire portfolio, rσ the return for stock σ, and
xσ is the number of stocks in the portfolio of the corresponding stock.
Since the risk of investment in the stocks is identical by construction, standard theory would prescribe to invest all the 100 tokens received in each round in the stock α, which has the highest expected returns (rα = 0.3) to maximize portfolio’s expected returns:
( 2 ) R = rαxα = 0.3 (100) = 30
On the contrary, the average share of α in our experiment takes values between 39.3% and 50.3% (Table 3). More surprisingly, investors always include in their portfolio a share of stock Delta, whose expected returns are nil.
The diversified structure of portfolios chosen by subjects of our sample implies that they sacrifice on average nearly one third of the expected portfolio returns across all periods (see Table 5).
---Insert Table 5 around here ---Although these findings heavily question the rationality of investors in its traditional meaning (maximization of expected returns), it would not be correct to draw the conclusion that their behavior is merely the consequence of sheer irrationality. On the contrary, we could comment, as Polonius with Hamlet’s behavior, “Though this be madness, yet there is method in it”. As a matter of fact, our findings show that investors follow consistently a few behavioral rules and exhibit a fairly high degree of behavioral coherence across time. First of all, expected returns from portfolios remain nearly constant in all the periods (Table 5). In addition, the share of stocks different from α regularly decreases with expected returns in periods 1 and 5, when none of the stocks is included in the ethical index (Table 3). The distribution of shares is modified in the other periods as a consequence of the inclusion or exclusion of stocks in the ethical index.
We wish to emphasize that the influence exerted by the inclusion or exclusion of a stock from the ethical index is consistent with the hypothesis that information on the ethical
standards of the firms matters. It is therefore worthwile a further analysis of the strength of these effects.
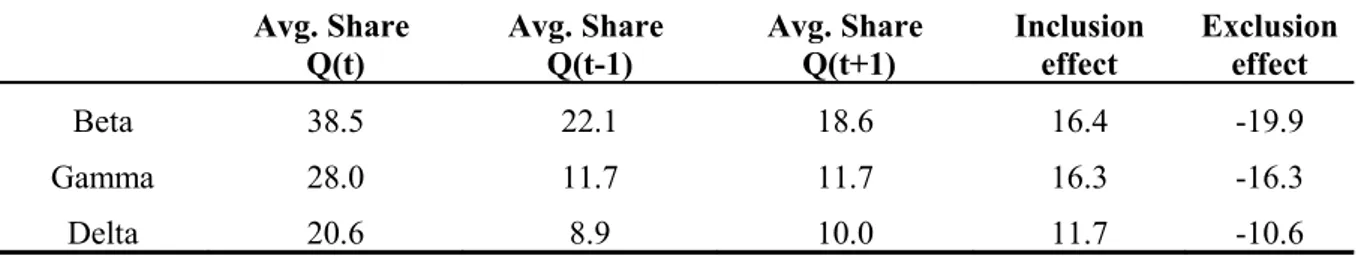
We define as inclusion effect the change in the share of a certain stock in consequence of its inclusion in the ethical index. For each stock, we measure the inclusion effect by computing the difference between the average share invested in the inclusion period, Q(t), and the average share invested in the preceding period, Q(t-1). We can observe, at the aggregate level, a relation between the expected returns and the inclusion effect (Table 6).
---Insert Table 6 around here ---On the other hand, exclusion effect is defined as the change in the share of a certain stock in consequence of its exclusion from the ethical index. We compute the exclusion effect as the difference between the stock’s share invested in the inclusion period, Q(t), and the share invested in the subsequent period, Q(t+1), in which, by construction, the stock is excluded from the ethical index. Results for the exclusion effect are shown in Table 6. As we can see, inclusion and exclusion effects have a similar impact.
Further insights on investors’ behavior can be provided by looking at the distribution across individuals of the inclusion effect. In order to disaggregate this effect, we calculate, for each subject, the ratio between the average share of the stock when it is included in the ethical index and the average share of the same stock in all periods. Then, we compute the average of the three ratios (for Beta, Gamma and Delta), which gives a measure of subjects’ bias toward CSR standards. This distribution is shown in Figure 1.
---Insert Figure 1 around here ---By construction, coefficient values greater than 1.0 denote that the investor’s choice is biased towards the ethical stock. Only 6 subjects over 50 exhibit a coefficient lower than 1.0 and the distribution is moderately right-skewed (mean 1.77 > median 1.71).
This evidence supports the conclusion that ethics matters in financial decisions. This is at variance with the basic principles of standard economic theory. In the latter, assuming a mean-variance utility function of investors, if Y is the set of options yn ∈ Y, and A the set of
agents interacting on the market, the behavior of the representative agent i ∈ A depends
( 3 ) ynit = φ1 ( Rit )
Our experiment suggests that the ethical evaluations of the decision maker i, Nit, may
play an autonomous role in the choice function, so that: ( 4 ) ynit = φ3 ( Rit, Νit ).
In the light of this hypothesis, we explore in the following section the relationship between rationality and ethical preferences also at the disaggregated level.
4. Rationality and ethical preferences
We have ascertained in the previous section that in our experiment the existence of ethical preferences affects investors’ decisions independently of self-interested returns. This is a clear deviation from the economic theory of rational behavior that considers, as argument of the investors’ utility function, only returns to be maximized. We could fear that our findings are just a reflection of sheer irrationality due to misunderstanding of the experimental setting or ignorance of the fundamentals of economic theory. In this section, we face this key issue in order to understand to what extent experimental subjects behaved irrationally and whether there is a correlation between their degree of irrationality and their ethical preferences. To this end, we define irrationality as deviation from the choice dictated by standard economic theory, and we measure it in terms of the return loss in consequence of such deviation. A series of random draws of portfolio distributions would tend towards a uniform distribution so that the portfolio expected returns would be:
( 4 ) R = 0.3(25) + 0.2(25) + 0.1(25) + 0(25) = 7.5 + 5 + 2.5 = 15
We consider this value as the threshold of complete non-rationality, since for values of expected returns not superior to these threshold considerations on returns do not appear to play the usual incentive role in decision making.
In Table 7 we partition agents in five clusters according to the average expected returns of their portfolios, depending on the value of R.
---Insert Table 7 around here ---As shown in Table 7, while the number of completely irrational investors (R ≤ 15) is very low, the bigger cluster is that of weakly rational investors. Since half of our sample appears to be “fairly rational” or “quasi-rational”, we explore to what extent we may identify a trade-off between expected returns and ethical motivations. First of all, we observe that the information about the inclusion of stocks in the ethical index in periods 2, 3 and 4 reduces by 0.90 points the average expected returns of the periods not “perturbed” by information on ethical standards (Table 8).
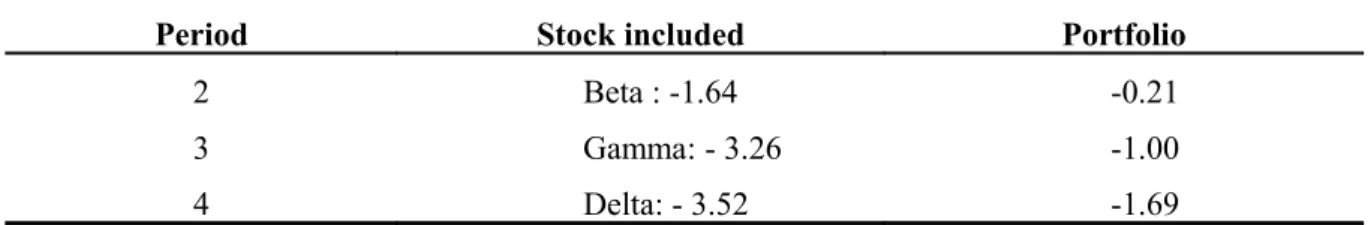
---Insert Table 8 around here ---Also notice that the overweight of the stock included in the index is inversely correlated with stocks’ expected return. This suggests that our investors reward the stock included in the ethical index, although its expected returns are significantly lower than those of the other stocks. However, the ensuing sacrifice is to some extent compensated by an apt restructuring of the portfolio in such a way to reduce the expected loss. To analyze this effect, we calculate, for each “ethical” stock i, the loss in expected returns as: (ri - rα)*xi and for each
“inclusion” period, the loss in expected returns of portfolios as the difference between portfolio expected return and the average returns of “non inclusion” periods (i.e. periods 1 and 5). Table 9 shows that, for each inclusion period, the loss in expected return for each “ethical” stock is higher than the loss in expected returns of portfolios.
---Insert Table 9 around here ---Finally, data show a certain degree of learning, as investors succeed to reduce significantly, although not completely, the expected loss consequent to their ethical preferences. The substitution of the included stock for the excluded stock tends to increasingly reduce the portfolio expected returns, but this effect is partially compensated by the growing share of stock Alpha in periods 3 and 4, as well as the growing share of stock Beta in period 4 (Table 3). This result seems to depend more than on calculations of expected returns on a rule of thumb being used by subjects, who are not fully rational but look quite sensible in their choices.
5. Concluding remarks
We provide laboratory evidence that experimental subjects, invited to act as investors, are not guided in their choices exclusively by the principle of expected return maximization, as is maintained by standard decision theory and by mainstream economic theory built on it. Rather, their behavior appears to be a function not only of their individual payoffs, but also of the information available about the ethical standards of the firms. In particular, investors react in a consistent and significant manner to the announcement that a certain stock is included in a representative ethical index, or excluded from it. The inclusion of a stock in the ethical index increases its share of about 30% in average, and its exclusion yields about the same deviation. Thus, beside the expected returns from the investors’ personal portfolio, we should add in their utility function a further argument that represents their ethical preferences.
In order to understand to what extent these results are significant, we consider whether the apparent existence of ethical preferences is just the by-product of the irrationality shown by our experimental subjects, or a deliberate strategy. In fact, none of the investors in our sample behave in a fully rational way in the standard sense (i.e., maximization of expected returns), because their portfolio always included a share of each of the four available stocks. Most of the investors, however, did not exhibit a fully irrational behavior but correlated the share of stocks with their expected returns. We thus evaluate the degree of decision makers’ irrationality as deviation from standard rationality measured as foregone expected returns in consequence of their effective choices. This allows us to exclude that the apparent ethical awareness of the investors in our sample is spurious, being just the consequence of their irrationality. We may thus conclude that the sizeable reaction of investors to the inclusion of a stock in the ethical index, or its exclusion from it, is the fruit of a deliberate choice strategy.
At the stage reached by the research line pursued in this paper, we cannot extend light-heartedly to the real world the results obtained in laboratory. We may say, however, that these results are consistent with the conviction that CSR self-regulation may exert a significant influence also in finance. To the extent that this potential will be confirmed by future research, it may be exploited in the future in order to upgrade the ethical standards of firms beyond the minimal requirement of legal regulation. The existence of identifiable ethical preferences in the utility function of investors may strengthen the enforcement of CSR self-regulation by giving positive incentives to the most responsible firms, and negative incentives to the others. In addition, between the two arguments of the utility function, we found in many
cases a small but significant trade-off. This seems to confirm that firms have good reasons to upgrade their ethical standards beyond the instrumental role of CSR initiatives, as a signal of competent management or as positive determinant of long-run returns.
References
Belkaoui, A., 1980. The impact of socio-economic accounting statements on the investment decision: An empirical study. Accounting, Organizations and Society 5, 263-283. Borghesi, S., Vercelli, A., 2008. Global Sustainability: Social and Environmental Conditions.
Houndmills, Basingstoke: Palgrave MacMillan.
Chan, C. C., Milne, M. J., 1999. Investor reactions to corporate environmental saints and sinners: an experimental analysis. Accounting and Business Research 29, 265-279. Consolandi, C., Jaiswal-Dale, A., Poggiani E., Vercelli, A., 2008. Global Standards and
Ethical Stock Indexes: The Case of the Dow Jones Sustainability Stoxx Index. Journal of Business Ethics. DOI 10.1007/s10551-008-9793-1.
Derwall, L., Guenster, N., Bauer, R., Koedijk, K., 2005. The Eco-Efficiency Premium Puzzle. Financial Analysts Journal 61, 51-63.
Fischbacher, U., 1999. Z-tree Manual, Institute for Empirical Research in Economics. University of Zurich.
Friedman, M., 1970. The Social Responsibility of Business is to Increase its Profits. The New York Time Magazine. 09/13/1970.
Garz H., Volk C., Gilles, M., 2002. More Gain than Pain- SRI: Sustainability Pays Off. West LB Panmure. Available at http://www.sustainability-indexes.com/djsi_pdf/ publications/Studies/ WestLB_0211_English.pdf.
Geczy, C. C., Sambaugh, R. F., Levin, D., 2005. Investing in Socially Responsible Mutual Funds. Wharton School Working Paper. Available at http://ssrn.com/ abstract=416380. Hendricks, J., 1976. The impact of human resource accounting information on stock
investment decisions: an empirical study. The Accounting Review 51, 292-305.
Holm, C., Rikhardsson, P., 2008. Experienced and Novice Investors: Does Environmental Information Influence Investment Allocation Decisions? European Accounting Review 17, 537-557.
Jensen, M. C., 2001. Value Maximization, Stakeholder Theory, and the Corporate Objective Function. Journal of Applied Corporate Finance 14, 8-21.
Milne, M. J., Chan C. C., 1999. Narrative corporate social disclosures: How much of a difference do they make to investment decision-making? British Accounting Review 31, 439-457.
Orlitzky, M., Schmidt, F. L., Rynes, S. L., 2003. Corporate Social Responsibility and Financial Performance: a Meta-analysis. Organization Studies 24, 403-441.
Porter, M. E., Kramer, M. R., 2006. Strategy and society: the link between competitive advantage and corporate social responsibility. Harvard Business Review 84, 78-92. Sen, S. and C. B. Bhattacharya, 2001. Does doing Good Always Lead to Doing Better?
Consumer Reactions to Corporate Social Responsibility. Journal of Marketing Research 38, 225-243.
Appendix Instructions
WELCOMETOTHELABORATORY
This is an experiment on decision making to construct an investment portfolio of equities. You play the role of an ordinary investor to construct an investment portfolio.
Each of you will receive a “door price” of euros 5.00 for agreeing to participate in this exercise. Depending on your investment decisions, you can earn additional funds. You will need to follow a set of instructions in order to make your investment decisions. The experiment is an individual experience. Both your choices and your profits will be confidential to all except you. The final payment will be paid immediately after the experiment. The payment amount is automatically compiled at the end of the simulation. You are invited to verify your information at the end of the simulation with your initials.
This experiment will produce best results if you respond to it individually without consulting other participants for the duration of the experiment.
You will be allowed to ask questions after we finish going over this documentation with you and/or just before you begin the experiment.
You will have trial sessions to hone your decision making skills before the actual experiment begins.
If you are ready, follow the experiment instructions given below.
THEINSTRUCTIONS
Each participant will receive at the beginning of the experiment investment funds of 100 units. The decision that each of you will make is how to invest all the funds to generate a portfolio of stocks. You will need to allocate all the 100 units while choosing among four different stocks: Alpha, Beta, Delta and Gamma. These are equity issues of companies all belonging to the same industry.
Allocate all of the 100 units among the four stocks by indicating your chosen amount in the empty boxes provided for your choices next to the four stocks. Below is the window that will prompt you to allocate your 100 units. There will be an error message if you do not allocate the entire 100 units. You cannot proceed ahead without completely allocating the 100 units. You are required to provide a figure in each box and this figure can also take the value 0.
All stocks have the same market price but differ (a) in terms of expected market return and (b) they may or may not be included in a socially and environmentally responsible stock index as per the rating of the company with regard to environmental and social issues. The environmentally and socially responsible stock index is updated quarterly.
The returns of the four stocks have a random normal distribution based on historical data for the past five years as indicated in the tables below.
Stock return: Alpha (price= 1)
Probability 1/6 1/6 1/6 1/6 1/6 1/6
Profit/loss -0.2 +0.1 +0.2 +0.4 +0.5 +0.8
Mean = +0.3 Variance = 0.12
Stock return: Beta (price = 1)
Probability 1/6 1/6 1/6 1/6 1/6 1/6
Profit/loss
-0.3 0 +0.1 +0.3 +0,4 +0,7
Mean = +0.2 Variance = 0.12
Stock return: Gamma (price= 1)
Probability 1/6 1/6 1/6 1/6 1/6 1/6
Profit/loss -0.4 -0.1 0 +0.2 +0,3 +0,6
Mean = +0.1 Variance = 0.12
Stock return: Delta (price = 1)
Probability 1/6 1/6 1/6 1/6 1/6 1/6
Profit/loss -0.5 -0.2 -0.1 +0.1 +0,2 +0,5
Mean = 0 Variance = 0.12
The exercise for decision making covers a total period of 5 quarters. Each quarter requires five sets of allocation of funds among the four stocks. Thus your investment decisions are repeated 5*5= 25 times. You are provided 100 units for each of the 25 allocations you make. Each quarter is likely to have a different stock that has been rated for inclusion in the socially and environmentally responsible stock index. The stock included in
the socially and environmentally responsible stock index is indicated in green. See the example below.
Every time you complete one allocation, one investment decision among the four stocks, you will confirm your choices by clicking OK. At this time the market will close and your returns for this portfolio will be calculated and indicated to you on the screen. The amount you gain or lose is an exclusive function of your investment decisions. Your profit is calculated as indicated below.
Total Revenue= Amount invested + {stock return * amount invested}
Stock return is randomly chosen by the software from the probability distribution of each stock. The following examples show the calculation of your profit for different allocations as you build your portfolio
Example one:
Investment allocation: 40 for stock X + 60 for stock Y Stock return for X =0.5
Stock return for Y = -0.2
Total Revenue = {40+(0.5*40)+60+(-0.2*60)} = 60+48 = 108 Example two:
Investment allocation: 20 for stock X + 50 for stock Y + 20 for stock Z + 10 for stock K Stock return for X = 0.2
Stock return for Y = -0.3 Stock return for Z = 0.2 Stock return for K = 0.4
Total Revenue= {20+(0.2*20) + 50+(-0.3*50)+20+(0.2*20)+10+(0.4*10)} = 24+35+24+14=97
To move to the next allocation, you will click Ok after you have read your total profits.
Your final overall revenue for the totality of allocations is the sum of your profits in each of the 25 allocations. At the end of the experiment your profits will be translated to real euros using a translation rate of
200 profit units = 1 euro
If you need additional information, now is a good time to ask. Once you begin the experiment you cannot stop for information or clarifications.
Before the experiment begins you are given trial sessions to practice your allocations. Any profits obtained during these trial sessions are not included in your total profits for this experiment.
Any questions?
Table 1- Probability distributions of expected returns attributed to stocks
This table shows the expected returns probability distributions attributed to each of the four stocks throughout the experiment
Alpha’s return
Probability 1/6 1/6 1/6 1/6 1/6 1/6 Net Return (absolute value) -0.2 +0.1 +0.2 +0.4 +0.5 +0.8
mean = +0.3 variance = 0.12
Beta’s return
Probability 1/6 1/6 1/6 1/6 1/6 1/6 Net Return (absolute value) -0.3 0 +0.1 +0.3 +0.4 +0.7
mean = +0.2 variance = 0.12
Gamma’s return
Probability 1/6 1/6 1/6 1/6 1/6 1/6 Net Return (absolute value) -0.4 -0.1 0 +0.2 +0.3 +0.6
mean = +0.1 variance = 0.12
Delta’s return
Probability 1/6 1/6 1/6 1/6 1/6 1/6 Net Return (absolute value) -0.5 -0.2 -0.1 +0.1 +0.2 +0.5
mean = 0 variance = 0.12
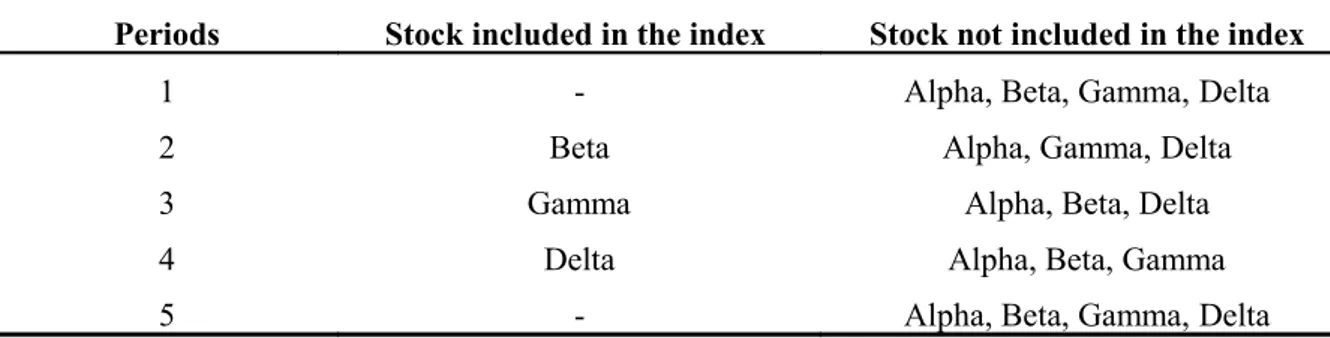
Table 2 Stocks included in the index of social and environmental responsibility and excluded from it
This table shows which stock is included in the ethical index in each period. In period 1 and 5 none of the stocks is included in the index; Beta is included in period 2, Gamma in period 3 and Delta in period 4.
Periods Stock included in the index Stock not included in the index
1 - Alpha, Beta, Gamma, Delta 2 Beta Alpha, Gamma, Delta 3 Gamma Alpha, Beta, Delta 4 Delta Alpha, Beta, Gamma 5 - Alpha, Beta, Gamma, Delta
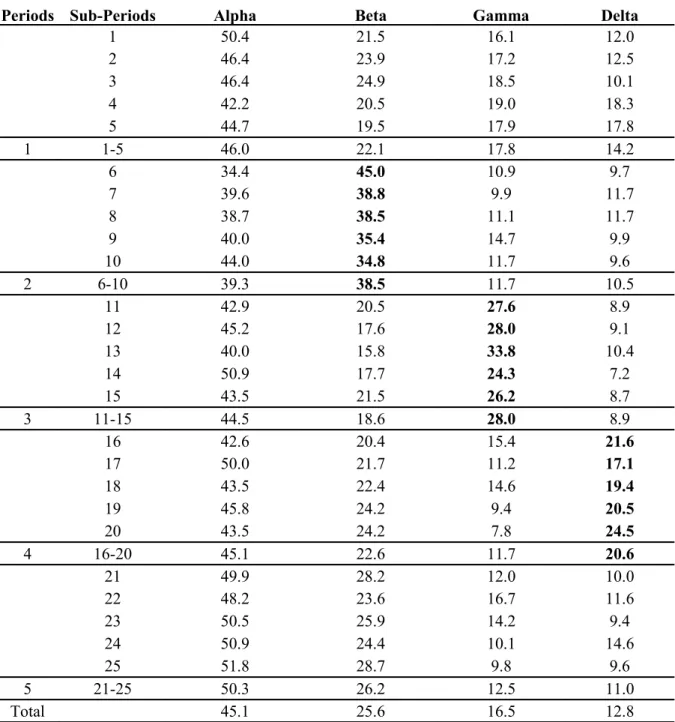
Table 3 Portfolio allocation (average shares)
This table presents the average share of each stock within subjects’ portfolios for each period. In bold the share of the stock included in the ethical index in each period.
Periods Sub-Periods Alpha Beta Gamma Delta
1 50.4 21.5 16.1 12.0 2 46.4 23.9 17.2 12.5 3 46.4 24.9 18.5 10.1 4 42.2 20.5 19.0 18.3 5 44.7 19.5 17.9 17.8 1 1-5 46.0 22.1 17.8 14.2 6 34.4 45.0 10.9 9.7 7 39.6 38.8 9.9 11.7 8 38.7 38.5 11.1 11.7 9 40.0 35.4 14.7 9.9 10 44.0 34.8 11.7 9.6 2 6-10 39.3 38.5 11.7 10.5 11 42.9 20.5 27.6 8.9 12 45.2 17.6 28.0 9.1 13 40.0 15.8 33.8 10.4 14 50.9 17.7 24.3 7.2 15 43.5 21.5 26.2 8.7 3 11-15 44.5 18.6 28.0 8.9 16 42.6 20.4 15.4 21.6 17 50.0 21.7 11.2 17.1 18 43.5 22.4 14.6 19.4 19 45.8 24.2 9.4 20.5 20 43.5 24.2 7.8 24.5 4 16-20 45.1 22.6 11.7 20.6 21 49.9 28.2 12.0 10.0 22 48.2 23.6 16.7 11.6 23 50.5 25.9 14.2 9.4 24 50.9 24.4 10.1 14.6 25 51.8 28.7 9.8 9.6 5 21-25 50.3 26.2 12.5 11.0 Total 45.1 25.6 16.5 12.8
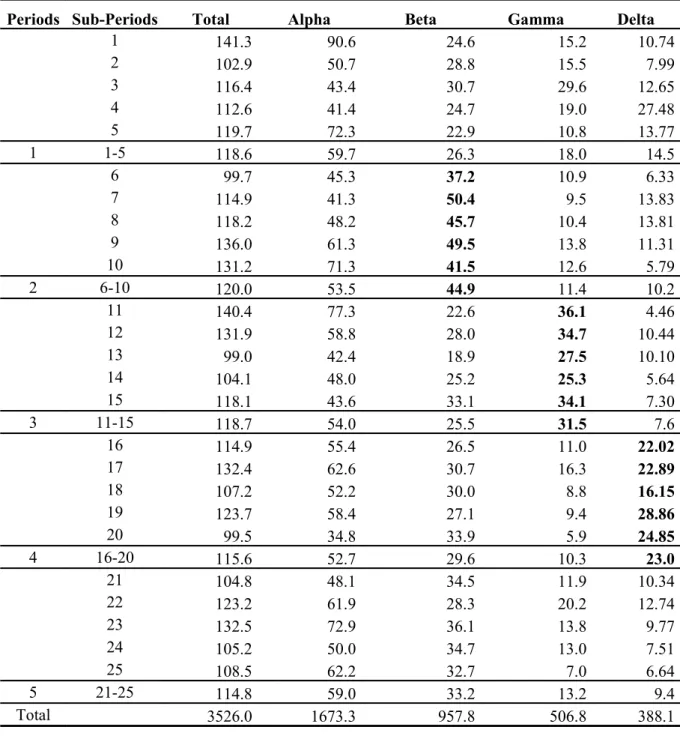
Table 4 Average Individual Earnings
This table presents the average individual earnings for each period and sub-period. In bold the earnings of the stocks included in the ethical index.
Periods Sub-Periods Total Alpha Beta Gamma Delta
1 141.3 90.6 24.6 15.2 10.74 2 102.9 50.7 28.8 15.5 7.99 3 116.4 43.4 30.7 29.6 12.65 4 112.6 41.4 24.7 19.0 27.48 5 119.7 72.3 22.9 10.8 13.77 1 1-5 118.6 59.7 26.3 18.0 14.5 6 99.7 45.3 37.2 10.9 6.33 7 114.9 41.3 50.4 9.5 13.83 8 118.2 48.2 45.7 10.4 13.81 9 136.0 61.3 49.5 13.8 11.31 10 131.2 71.3 41.5 12.6 5.79 2 6-10 120.0 53.5 44.9 11.4 10.2 11 140.4 77.3 22.6 36.1 4.46 12 131.9 58.8 28.0 34.7 10.44 13 99.0 42.4 18.9 27.5 10.10 14 104.1 48.0 25.2 25.3 5.64 15 118.1 43.6 33.1 34.1 7.30 3 11-15 118.7 54.0 25.5 31.5 7.6 16 114.9 55.4 26.5 11.0 22.02 17 132.4 62.6 30.7 16.3 22.89 18 107.2 52.2 30.0 8.8 16.15 19 123.7 58.4 27.1 9.4 28.86 20 99.5 34.8 33.9 5.9 24.85 4 16-20 115.6 52.7 29.6 10.3 23.0 21 104.8 48.1 34.5 11.9 10.34 22 123.2 61.9 28.3 20.2 12.74 23 132.5 72.9 36.1 13.8 9.77 24 105.2 50.0 34.7 13.0 7.51 25 108.5 62.2 32.7 7.0 6.64 5 21-25 114.8 59.0 33.2 13.2 9.4 Total 3526.0 1673.3 957.8 506.8 388.1
Table 5 Average portfolios’ expected returns in each period
This table reports portfolios’ average expected returns for each period. Portfolios’ expected returns (R) were computed as: R = rαxα + rβxβ + rγxγ + rδxδ, , where rα, , rβ, rγ andrδ represent expected returns of Alpha, Beta,
Gamma and Delta respectively and xα, xβ, xγand xδ represent the average number of each stock invested during
the period.
Period Sub-Periods Expected returns
1 1-5 20.00
2 5-10 21.19
3 10-15 19.87
4 15-20 19.15
5 20-25 21.75
Table 6 Inclusion and exclusion effects
This table shows inclusion and exclusion effects of a stock in the socially and environmentally responsible index. Inclusion effect was computed as a difference between the average share of the stock during the inclusion period Q(t) and the average share invested in the preceding period. Exclusion effect was computed as the difference between the average share of the stock during the inclusion period Q(t) and the average share of the stock in the subsequent period Q(t+1). Avg. Share Q(t) Avg. Share Q(t-1) Avg. Share Q(t+1) Inclusion effect Exclusion effect Beta 38.5 22.1 18.6 16.4 -19.9 Gamma 28.0 11.7 11.7 16.3 -16.3 Delta 20.6 8.9 10.0 11.7 -10.6
Table 7 Clusters of investors according to the average R
This table shows the number of subject included in each cluster of investors. Clusters were defined according to different level of R
Investors Expected returns N. of agents
Rational R = 30 0
Quasi-rational 25 ≤ R < 30 10 Fairly rational 20 ≤ R < 25 15 Weakly rational 15 ≤ R < 20 22
Irrational R ≤ 15 3
Table 8 ΔR inclusion / non inclusion periods
This table shows the average values of R in inclusion periods (i.e., periods in which one of the stocks is included in the ethical index) and non inclusion periods (i.e. periods in which none of the stocks is included in the index)
Average values of R in the inclusion periods (2, 3, 4) 19.97 Average values of R in the non inclusion periods (1, 5) 20.87 Average loss of expected returns 0.90
Table 9 Lost expected returns
This table shows the loss in expected returns due to an allocation of investors’ wealth in the stock included in the socially and environmentally responsible index.
Period Stock included Portfolio
2 Beta : -1.64 -0.21 3 Gamma: - 3.26 -1.00 4 Delta: - 3.52 -1.69