Muscle patterns underlying voluntary
modulation of co-contraction
Daniele Borzelli1,2, Benedetta Cesqui1,3, Denise J. Berger1, Etienne Burdet4, Andrea d’AvellaID1,2*
1 Laboratory of Neuromotor Physiology, IRCCS Fondazione Santa Lucia, Rome, Italy, 2 Department of
Biomedical and Dental Sciences and Morphofunctional Imaging, Universitàdi Messina, Messina, Italy,
3 Centre of Space Bio-medicine, Universitàdi Roma Tor Vergata, Rome, Italy, 4 Department of Bioengineering, Imperial College of Science, Technology and Medicine, London, United Kingdom
Abstract
Manipulative actions involving unstable interactions with the environment require controlling mechanical impedance through muscle co-contraction. While much research has focused on how the central nervous system (CNS) selects the muscle patterns underlying a desired movement or point force, the coordination strategies used to achieve a desired end-point impedance have received considerably less attention. We recorded isometric forces at the hand and electromyographic (EMG) signals in subjects performing a reaching task with an external disturbance. In a virtual environment, subjects displaced a cursor by applying iso-metric forces and were instructed to reach targets in 20 spatial locations. The motion of the cursor was then perturbed by disturbances whose effects could be attenuated by increasing co-contraction. All subjects could voluntarily modulate co-contraction when disturbances of different magnitudes were applied. For most muscles, activation was modulated by target direction according to a cosine tuning function with an offset and an amplitude increasing with disturbance magnitude. Co-contraction was characterized by projecting the muscle activation vector onto the null space of the EMG-to-force mapping. Even in the baseline the magnitude of the null space projection was larger than the minimum magnitude required for non-nega-tive muscle activations. Moreover, the increase in co-contraction was not obtained by scaling the baseline null space projection, scaling the difference between the null space projections in any block and the projection of the non-negative minimum-norm muscle vector, or scaling the difference between the null space projections in the perturbed blocks and the baseline null space projection. However, the null space projections in the perturbed blocks were obtained by linear combination of the baseline null space projection and the muscle activation used to increase co-contraction without generating any force. The failure of scaling rules in explaining voluntary modulation of arm co-contraction suggests that muscle pattern genera-tion may be constrained by muscle synergies.
a1111111111 a1111111111 a1111111111 a1111111111 a1111111111 OPEN ACCESS
Citation: Borzelli D, Cesqui B, Berger DJ, Burdet E, d’Avella A (2018) Muscle patterns underlying voluntary modulation of co-contraction. PLoS ONE 13(10): e0205911.https://doi.org/10.1371/journal. pone.0205911
Editor: Luigi Cattaneo, Universita degli Studi di Verona, ITALY
Received: April 9, 2018 Accepted: October 3, 2018 Published: October 19, 2018
Copyright:© 2018 Borzelli et al. This is an open access article distributed under the terms of the Creative Commons Attribution License, which permits unrestricted use, distribution, and reproduction in any medium, provided the original author and source are credited.
Data Availability Statement: All relevant data are within the paper and its Supporting Information files.
Funding: This work was supported by the Italian Ministry of Health (RF-2011-02347869) to AdA (http://www.salute.gov.it/portale/temi/p2_6.jsp? lingua=italiano&id=4517&area=Ricerca% 20sanitaria&menu=finalizzata), the Italian Ministry of Education, University and Research (PRIN-2015-HFWRYY) to AdA (http://attiministeriali.miur. it/anno-2016/novembre/dd-07112016-(1).aspx), the Human Frontier Science Program Organization
Introduction
During daily life, we often perform manipulative actions that involve unstable interactions between the hand and the environment or the rejection of external disturbances, such as when working with tools. Successful performance of these actions requires controlling the endpoint impedance through muscle co-contraction [1,2,3,4]. Increasing endpoint impedance reduces the perturbing effect of an external force [2,3,5,6,7] and improves movement accuracy [8,9,10,11]. Impedance is modulated through muscle co-contraction to facilitate ball catching [12] while an overall decrease is associated with practice when learning a new motor task [13,14,15].
Arm impedance can be characterized by inertia, damping, and stiffness. Many studies have characterized these components both during static tasks [16,17,18,19,20,21,22,23] and dynamic tasks [3,6,7,8,11,24,25,26]. Because inertia cannot be controlled for a given arm posture, damp-ing co-varies with stiffness, and mechanical interactions with the environment occur usually at the hand, past studies mostly focused on end-point stiffness for the characterization of the mus-cular control of impedance.
The musculoskeletal system can perform the same action with different end-point trajecto-ries or force profiles, the same end-point trajectory or force profiles can be achieved with dif-ferent joint trajectories or torque profiles, and the same joint trajectories or torque profiles can be generated by different muscle activation patterns [27]. Thus, infinitely many different mus-cle activation patterns generate the same action. While much research in motor control has focused on investigating how the CNS selects the muscle patterns underlying a desired move-ment or end-point force, the strategies used to coordinate many muscles to achieve a desired end-point impedance have received considerably less attention. Indeed, there is a redundancy resolution (and exploitation) problem also for the control of impedance. For anantagonist
pair of muscles with opposite actions on a single joint, joint torque is the sum of the torques generated by each muscle, which have opposite signs. Thus, as each muscle torque is a function of muscle activation, net joint torque depends on thedifference between the muscle activations
appropriately weighted to account for the moment arms and forces of each muscle. In contrast, impedance depends on thesum of weighted muscle activations. One can then define the co-contraction as any activation of two muscles that generates no net torque (i.e. zero weighted
activation difference) and thelevel of co-contraction as the specific value of the weighted sum
of the two activations. However, for a multi-muscle multi-joint system such as the arm, there are infinite muscle co-contraction patterns that the CNS can select to achieve not only a desired end-point force but also a desired end-point impedance. How the CNS selects one of these infinite muscles patterns is still an open question.
Muscle activations underlying stiffness modulation have been studied during both pointing and force exertion tasks [28,29]. However, previous studies recorded only a few agonist-antago-nist muscles pairs. A small number of muscles may not be adequate to characterize the coordi-nation strategies that the CNS employs to exploit the flexibility deriving from the redundancy of the musculoskeletal system. Moreover, the identification of an agonist-antagonist muscle pair may be valid only for specific tasks and experimental constraints [30] and the notion of agonist-antagonist muscle pairs is not well defined for a multi-muscle multi-joint system. Thus, our goal was to characterize the muscle coordination strategies that the CNS uses to control imped-ance by recording from many arm muscles rather than a few agonist-antagonist pairs.
In a multi-muscle, multi-joint system,co-contraction requires a multivariate
characteriza-tion. If we consider the vector space of all muscle activation patterns, co-contraction patterns constitute the null space of the mapping of muscle patterns onto end-point forces. If the map-ping is linear, the null space is a vector subspace that can be directly characterized from the (program grant RGP11/2008) to AdA (http://www.
hfsp.org/awardees/awards-archive), the European Union’s Seventh Framework programme (under Grant Agreement 248311-AMARSi,https://www. amarsi-project.eu/), and the European Union’s Horizon 2020 research and innovation programme (under Grant Agreement 644727-CogIMon,https:// cogimon.eu/). The funders had no role in study design, data collection and analysis, decision to publish, or preparation of the manuscript. Competing interests: The authors have declared that no competing interests exist.
muscle-to-force matrix. Thus, if such matrix is known, it is possible to decompose muscle pat-terns into a force-generating component and a null space component. The CNS must change the null space component of the muscle activation vector to modulate impedance while main-taining a given end-point force. Thus, we designed an experimental protocol to investigate how the CNS changes muscle patterns and their null space projections during voluntary mod-ulation of arm muscles co-contraction.
We used a multidirectional isometric force generation task with a simulated perturbation to investigate the components of the muscle activation vector in the null space. We asked partici-pants to displace a cursor in a virtual reality environment by generating submaximal isometric forces to reach multiple targets in different spatial directions. We could then approximate the mapping of muscle activations (EMG) to end-point forces with a linear relation [29,31,32], esti-mate the EMG-to-force matrix by linear regression of the recorded forces and EMG, and com-pute the associated null space matrix. We then induced subjects to voluntary modulate co-contraction by simulating a disturbing force. We perturbed the cursor and we instructed sub-jects to reduce its oscillation by increasing the co-contraction of their arm muscles [33]. We used the projection of the instantaneous muscle activation vector in the null space to adjust the stiffness of the coupling between the hand and the cursor, thus allowing the subject to attenuate the effect of the perturbation by increasing co-contraction.
We first tested if subjects could succeed in this novel task by voluntarily increasing co-con-traction to overcome the virtual disturbance. As all subjects could increase co-conco-con-traction by modulating the projection of the muscle activations in the null space, we then investigated how the CNS coordinates a redundant set of muscles to increase co-contraction. We character-ized the modulation of the muscle activations both at the level of individual muscles and in terms of null space projections. We assessed how co-contraction affects the directional tuning of individual muscles by fitting cosine functions [32]. We then investigated how the null space projections of the muscle activation vectors change with different levels of co-contraction. We first tested if the CNS increases co-contraction by scaling of the null space vector observed dur-ing isometric force generation without any simulated instability (baseline condition). How-ever, the null space projections of the muscle patterns in the baseline condition may derive from the skeletal geometry and the physiological non-negativity constraint for the muscle acti-vations. In fact, even if the CNS selects muscle patterns by minimizing muscular effort, a non-zero null space component is required to achieve the minimum norm solution because of the non-negativity constraint. We then examined whether different co-contraction levels are obtained by affine scaling of the null space component that is added to the non-negative mini-mum norm muscle activation vector in the baseline condition. We also examined whether dif-ferent co-contraction levels, recorded during perturbation conditions, are obtained by affine scaling of the null space component that is added to the muscle activation vector observed dur-ing the baseline condition in the perturbed conditions. Finally, we assessed whether the null space components of the perturbed conditions, in which both force and co-contraction are required, are obtained as a linear combination of the null space vector observed during the force only condition and the muscle activation vector observed during pure co-contraction condition.
Materials and methods
Subjects were asked to apply isometric forces at the hand for displacing a cursor in a virtual reality environment, and to co-contract their arm muscles for attenuating the effect of a sinu-soidal disturbance on the position of the cursor. The cursor’s movement was simulated as two connected mass-spring-damper systems. The position of the first mass was controlled by the
isometric force applied by the subject. The position of the second mass, which was not affected by the position of the first mass, corresponded to the position of the cursor and was perturbed by a virtual sinusoidal force. The stiffness of the virtual spring connecting the two masses was adjusted in real-time by the projection of the muscle activation vector in the null space thus allowing the subject to attenuate the effect of the perturbation by increasing co-contraction. Therefore, the stiffness of the virtual spring during isometric force generation simulated the stiffness of the hand during a disturbance rejection task.
Participants
Nine right handed subjects (age 23.8± 3.5, mean ± SD, 6 females) participated in the experi-ment after giving written informed consent. All procedures were conducted in conformity with the Declaration of Helsinki and were approved by the Ethical Review Board of the Santa Lucia Foundation (Prot. CE/AG4-PROG.222-34).
Experimental apparatus and data acquisition
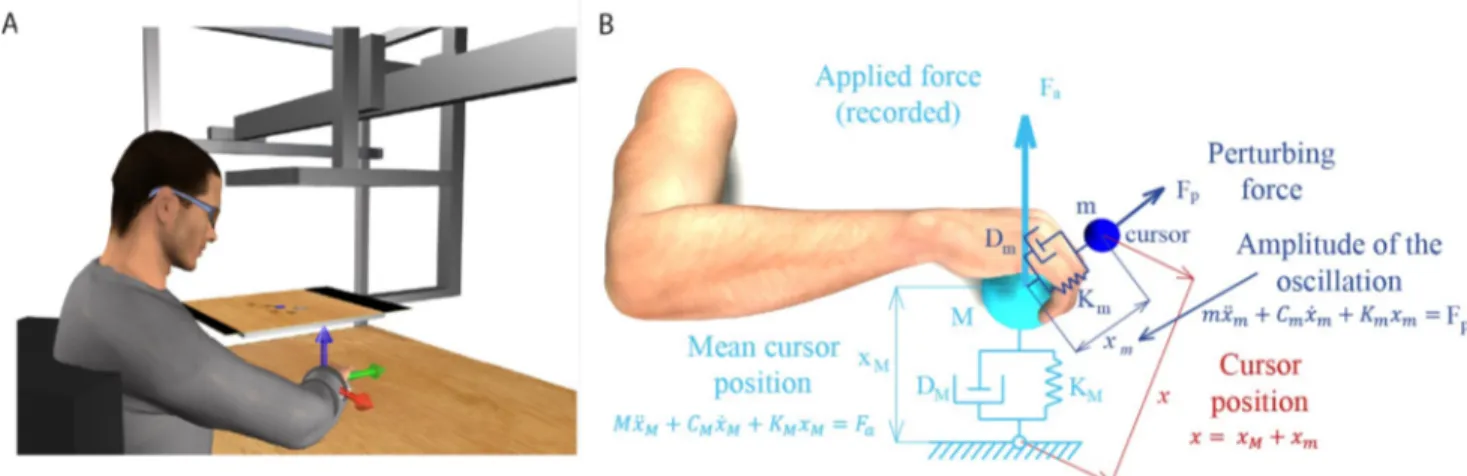
Subjects sat in front of a desktop on a racing car chair. Trunk and shoulders were immobilized by four-point safety belts and the right forearm was inserted into a splint that fully supported the hand and the forearm and immobilized the wrist joint. A steel rod connected the splint with a 6-axis force transducer (Delta F/T Sensor, ATI Industrial Automation, Apex, NC, USA) fixed below the desktop (Fig 1A). The position in the medio-lateral direction of the center of the palm in the splint was aligned with the body midline. The height of the desktop was adjusted such that the palm was at the height of the sternum. The distance between the desktop and the chair was adjusted to achieve an elbow flexion angle of 90˚. This position was comfort-able for the subjects and allowed them to remain still during the entire duration of the experi-ment. A mirror (29.7 x 21 cm), positioned parallel to the desktop approximately half-way between the hand and the eyes, occluded the hand. It reflected the image of a virtual scene
Fig 1. Experimental apparatus and cursor motion modeling. (A) Subjects sat in front of a desktop and inserted their right forearm into a splint connected to a 6 axis force transducer. The view of the hand was occluded by a mirror that reflected a virtual scene projected by a LCD monitor. The monitor displayed stereoscopically a desktop matching the real desktop and a blue spherical cursor whose position, when the subject was relaxed, was approximately at the center of the palm. The cursor position in space was simulated using two mass-spring-damper system and depended on the force applied by the subject. Adapted from [32]. (B) The position of the cursor was computed as the position of one mass (xm, mass m) connected through a
spring (stiffness Km) and a damper (damping coefficient Dm) to the position of a second mass (xM, mass M) connected to the center of the palm through
another spring (stiffness KM) and damper (damping coefficient DM). The force applied isometrically by the hand to the splint (Fa) was used to compute
xM. Mass m oscillated around mass M while the position of mass M was not influenced by the position of mass m. The instantaneous muscle activation,
projected onto the null space of the EMG-to-force matrix, was used to calculate the stiffness Kmand determined the amplitude of the oscillation of the
cursor around its mean position (xM).
displayed by a 21-inch LCD monitor (Syncmaster 2233, Samsung Electronics Italia S.p.A., Cer-nusco sul Naviglio, MI, Italy), parallel to the desktop and positioned approximately at the height of the eyes. During the experiment subjects wore 3D shutter glasses (3D Vision P854, NVIDIA Corporation, Santa Clara, CA, USA) and viewed stereoscopically a virtual scene reproducing the real desktop and a spherical blue cursor. The cursor appeared, at rest, approxi-mately at the position of the center of the occluded palm. The virtual scene was rendered by a 3D graphic card (Quadro Fx 3800, NVIDIA) on a PC workstation, using custom software. The scene was updated at 60 Hz with the cursor position processed by a second dedicated data-acquisition PC workstation running a real-time operating system. The cursor position was transmitted to the first workstation through an Ethernet link using the UDP protocol.
Surface EMG activity was recorded from 17 muscles acting on the elbow and the shoulder: teres major (TeresMaj), infraspinatus (InfraSp), latissimus dorsi (LatDorsi), inferior trapezius (TrapInf), middle trapezius (TrapMid), superior trapezius (TrapSup), brachioradialis (BracRad), biceps brachii, long head (BicLong), biceps brachii, short head (BicShort), triceps brachii, lateral head (TriLat), triceps brachii, long head (TriLong), triceps brachii, medial head (TriMed), ante-rior deltoid (DeltA), middle deltoid (DeltM), posteante-rior deltoid (DeltP), pectoralis major clavicu-lar portion (PectClav), pectoralis major sternal portion (PectStern). The correct electrodes placement was verified by observing the activation of each muscle during specific maneuvers. EMG activity was recorded with active bipolar electrodes (DE 2.1, Delsys Inc., Boston, MA), after band pass filtering (20–450 Hz) and amplification (gain 1000, Bagnoli-16, Delsys Inc.). Both force and EMG data were digitalized at 1 kHz using an analog-to-digital PCI board (PCI-6229; National Instruments, Austin, TX, USA). Only force components were used to compute cursor motion (torque components were recorded but not used) and they were defined as: Fxas the component along the medio-lateral axis, positive to the right; Fyalong the antero-posterior axis, positive away from the chest; Fzalong the vertical axis, positive up.
The cursor position was computed in real-time using two mass-spring-damper systems (Fig 1B). At rest and without any perturbing force, the cursor was displayed at a position corre-sponding to the center of the palm. An isometric force (Fa) applied by the subject to the splint
displaced a first mass (M) connected through a spring and a damper to the position of the
cen-ter of the palm (origin). The spring constant (KM) was set such that a constant force with a
magnitude corresponding to 20% of the mean maximum voluntary force (MVF) across force directions (see below), would have maintained the cursor at 5 cm from the origin. The mass (M) was adjusted adaptively in the range 15–140 g as in [34] to reduce the end-point force fluc-tuation due to the muscle signal dependent noise. The damping constant (DM) was set to make
the system critically damped. This mass-spring-damper system behaved like a low-pass filter for the mean motion of the cursor because it reduced the physiological high frequency fluctua-tions of the exerted forces, increasing during the co-contraction, and made the control of the cursor easier. The position of the cursor (x) corresponded to the position (xm) of a second
mass (m) relative to the position of the first mass (xM). The two masses were connected by a
spring and a damper whose stiffness (Km) and damping constant (Dm) were adjusted in
real-time according to level of muscle co-contraction expressed by the norm of the instantaneous projection of the muscle activation vector onto the null space of the EMG-to-force matrix (see below and Appendix).
EMG-to-force matrix and its null space
The relation between the vector of recorded EMG signals (m) and the recorded isometric
end-point forceFawas approximated as linear,Fa¼H � m, where the EMG-to-force matrix (H)
number of space dimensions,nm¼ 17 number of recorded muscles). The EMG signals from
all muscles, after rectification, baseline subtraction, filtering, re-sampling at 100 Hz, normali-zation by the maximum voluntary contraction (MVC) level, were regressed on each force com-ponent (2ndorder Butterworth low-pass filtered, 5 Hz cutoff) recorded during the hold phase in all baseline trials. Despite the relationship between muscle activation and end-point isomet-ric force is generally non-linear, a linear relationship provides an adequate approximation for low muscle activation levels, as the one required to reach the 20% MVF targets in our experi-ment. The quality of the reconstruction of the forces, recorded during the static phase in the baseline condition (see below) was used to assess the validity of the linear approximation in each participant. The R2value of the reconstruction was higher than 0.76 in all participants except one, who presented a R2equal to 0.61, and was thus excluded from the analysis. The mean R2value of the remaining participants (labeled as Subject 1 to 8) was 0.83± 0.05 (std, n = 8).
The set of muscle activation vectors that did not generate any end-point force, forming a subspace of the muscle activation vector space, was estimated computing the null space matrix
N of the EMG-to-force matrix H with the Matlab function null. The dimensions of N were
nm� ðnm ndÞ. The instantaneous projection of the muscle activation vector in the null space
vectorn, used to set the stiffness Kmand the dampingDm(see Appendix), was calculated at
each time samplei as the product of the transposed null space matrix by the EMG activation
vector:ni¼N Tm
i.
Experimental protocol
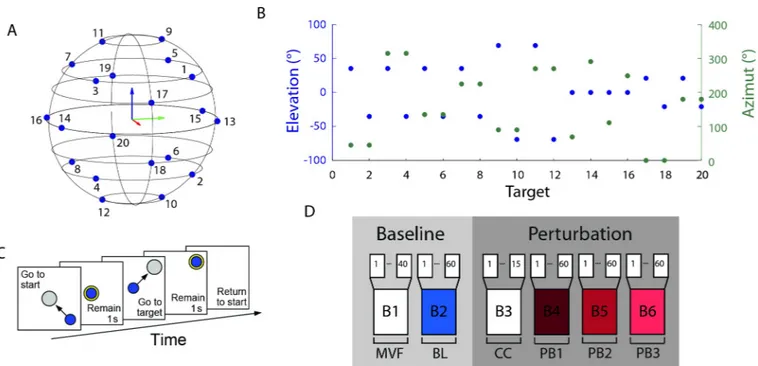
The experiment was subdivided in 6 blocks (Fig 2D), each consisting in a sequence of trials. In the first block (B1, MVF block) subjects had to generate maximum voluntary force in 20 differ-ent target directions twice (40 trials). The target directions were defined as the directions of the vertices of a dodecahedron with respect to its center in the origin (Fig 2A). In each trial the subjects saw an arrow starting from the origin and with a length and direction corresponding to the magnitude and direction of the applied force. The target force direction was displayed as a transparent gray cylinder. Subjects were instructed to apply a maximal force in the target direction and to maintain it for 1 s. A new trial started in a different direction 8 s after the end of the previous trial. Data collected from this block were used to establish the mean MVF across all directions of the maximum force applied. Forces were filtered by a second order But-terworth filter with a 5 Hz low-pass cutoff. During the second block (B2, baseline block), sub-jects had to displace the cursor to reach one of 20 targets. Targets were positioned at the vertices of a dodecahedron inscribed in a sphere centered at the origin and whose radius was 20% MVF (Fig 2A and 2B). Each target was presented 3 times, for a total of 60 trials. At the beginning of each trial, subjects were instructed to remain relaxed (rest phase) and maintain for 1 s the cursor inside a sphere centered at the origin and whose radius was 2% MVF larger than the radius of the cursor (Fig 2C). During the rest phase EMG signals collected from each muscle (rectified, filtered, re-sampled, baseline subtracted, MVC normalized) were averaged and their means, identified as baseline noise, were subtracted from the EMG signals collected during the rest of the trial. At the end of the rest phase a transparent gray sphere, whose radius was 3% MVF larger than the radius of the cursor, was displayed in one of the 20 possible target locations, randomly selected in each repetition. Subjects were instructed to apply a force to dis-place the cursor from the origin to the target, and to maintain it within the target sphere for 1 s (hold phase) for successfully completing the trial. The target color switched from gray to yel-low when the cursor was inside it. Subjects were required to complete the trial within 15 s. The baseline block was used to calculate both the EMG-to-force matrix and the mean norm of the
muscle activation projected onto the null space, which would be used to normalize the norm of the null space projection in the following blocks (see Appendix).
The third block (B3, pure co-contraction block) was introduced to familiarize subjects with the co-contraction task; it was composed of 15 trials in which the target sphere was positioned at the origin. At the end of the baseline block, subjects were informed that an oscillation would perturb the cursor in the following trials and that they could reduce it by stiffening their arm. The action of the perturbation on the cursor started after the end of the rest phase and finished with the end of the hold phase. Subjects were required to maintain the cursor, which was per-turbed with a noise force of magnitude level 2 (see Appendix), within the target (3% MVF tol-erance) during the 1s hold phase. A time-out of 15 s was used to avoid fatigue if subjects were not able to maintain the cursor in the target for the requested time. In the last three blocks (B4, B5, and B6, perturbed blocks) subjects had to reach one of 20 targets positioned at the vertices of a dodecahedron inscribed in a sphere of 20% MVF radius and centered at the origin. Each target was presented three times for a total of 60 trials in each block. The cursor was perturbed by a disturbing force (see Appendix) with a magnitude of level 1 in B4, level 2 in B5, and level 3 in B6. A trial was successful if the cursor remained inside the target for 1 s and a 15 s time-out was used to avoid fatigue. Two breaks were scheduled. The first break was necessary, after the baseline block, to allow for the automatic processing of the data for the calculation of theH
andN matrixes, and to explain the co-contraction task to the subject. The second break was
scheduled after the fifth block to allow subjects to rest. In addition to the scheduled breaks, subjects could pause at any time.
Fig 2. Experimental protocol. (A, B) Targets were equally distributed on the vertices of a dodecahedron inscribed in a sphere whose radius was 20% MVF. (C) Subjects were instructed to perform a reaching task. At the beginning of the trial subjects had to maintain the cursor in the central location for 1 s. When a transparent gray sphere appeared in one of the target positions, subjects had to apply a force to move the cursor inside the sphere. The color of the sphere switched from gray to yellow when the cursor was fully inside the larger target sphere. Subjects had to match the force target with a tolerance of 3% MVC to maintain the cursor inside the sphere for 1 s (hold phase). Finally, subjects had to relax all muscles to make the cursor return to the initial position. (D) Each subject performed a single experimental session consisting of 40 trials of maximum voluntary force generation along the 20 directions (B1), 60 trials of reaching to targets along the 20 directions (B2), 15 trials of pure co-contraction (B3), and 3 blocks of 60 reaching to targets trials along the 20 directions with three different levels of perturbation magnitude (B4, B5, B6).
Data analysis
EMG directional tuning curves, their fits with a spatial cosine function, and the projection of the muscle activation in the null space were calculated and compared among blocks. Since the muscle activations for all muscles in each trial can be described as a vector in muscle space, the angle between muscle activation vectors recorded during different blocks were calculated. A few trials (19.1± 12.6, mean ± SD across all subjects, over 195 trials performed by each subject) were excluded from the analysis after visual inspection because of: 1) high level of noise contam-inating the EMG signal likely due to suboptimal contact of the electrodes with the skin; 2) arte-facts in the EMG signal likely due to accidental contact of the subjects with metallic elements of the apparatus; 3) transients in the force likely due to accidental impact of the subject’s left arm with the force transducer; 4) muscle activity during the rest phase. A trial-specific baseline noise level was estimated as the mean activation of each muscle recorded at the beginning of each trial (rest phase). Data recorded during the last 0.4 s of rest phase of each trial, in which movements anticipation may occur, were excluded in the evaluation of the trial-specific noise level. The trial-specific baseline noise was subtracted from the rest of the data of each trial.
Task performance. A trial was successful if the cursor remained inside the target sphere
(3% MVF tolerance) during the 1 s hold phase. In successful trials, we definedtime-to-criterion
as the interval from target appearance to the beginning of the hold phase. In unsuccessful trials, for which no hold phase could be defined, the time-to-criterion was defined as the interval from target appearance to the last time in the trial in which the cursor entered the target. The time interval between the first moment the subject reached the target and the end of the hold phase, in successful trials, or the end of the trial in unsuccessful trials, was defined as attempt-ing time. The attemptattempt-ing time represents the time the subject tried, successfully or not, to
maintain the cursor inside the target. The norm of the difference between the applied force, normalized to MVF, averaged during the attempting time, and the force target was defined
force error. The norm of the difference between the cursor position displayed to the subject,
and the position of the target was calculated and converted to force units through the stiffness of the first mass-spring-damper system. This difference, normalized to MVF, averaged during the attempting time, was defined ascursor error.
Directional tuning of muscle activations. EMG waveforms were rectified, digitally
low-pass filtered (zero-phase, second order Butterworth, 5Hz cutoff), and re-sampled at 100 Hz to reduce data size. The rectified and filtered EMG signals for each muscle were normalized to the maximum voluntary contraction across directions (MVC) recorded during the MVF block. The waveforms of each muscle were averaged during the hold phase and the mean val-ues recorded during the trials of the same block and with the same target direction, were aver-aged to construct the directional tuning curves.
The directional tuning of each muscle, calculated separately from each block, was fitted by a spatial cosine function, defined by four parameters: azimuth WPD, elevationφPD, amplitudefPD, and offsetmoffset. These parameters were estimated with a multiple linear regression (Matlab
functionregress). The equation that defined the spatial cosine function for each muscle was
[32]:
mðf ; fPD;moffsetÞ ¼f T
�fPDþmoffset ¼fPD cosφ � cosφPDþsinφ � sinφPD�cosðW WPDÞ
� þmoffset
wheref is the unit vector pointing in the force direction, defined by azimuth and elevation
angles W andφ; fPDis the preferred direction vector. We considered a muscle to be cosine
tuned if the regression was significant (p < 0.05) and the quality of the fit acceptable (R2> 0.5). Only muscles whose directional tuning was cosine tuned in the baseline and in at least
Null space components. Themuscle space is defined as the space whose coordinates are
the activations of each muscle, so its dimensionality is the number of EMG signals recorded. In this space, the activation of all muscles recorded at a specific time sample is represented by a vector. Each vector (i.e. each muscle activation pattern) can be decomposed into two vectors obtained by projection onto two orthogonal subspaces [35,36]: thenull space of H, whose
ele-ments are mapped by theH matrix onto zero end-point force, and the row space of H or force
space, whose elements are mapped by the H matrix onto non-zero end-point force. Any
mus-cle activation vector can be thus uniquely decomposed into two orthogonal vectors by projec-tion onto these two subspaces (Fig 3). The null space projection was computed with the Matlab functionnull and the force space projection was computed as the Moore-Penrose
pseudo-inverse of theH matrix (H+) with the Matlab functionpinv. However, the
pseudo-inverse does not necessarily provide a physiological muscle vectorm that generates a desired
forceF. In fact, mmin=H+f is the solution to the underdetermined system of equations f = H m with minimum norm but mminmay have negative components. To solve thef = H m
equa-tion with the physiological constraint of non-negative muscle activaequa-tions, i.e.mi� 0 for all
i = 1. . .nm, in general it is necessary to add tomminan appropriate null space vectorn.
Since muscle activations generating the same end-point force have the same projection in the force space, two muscle activation vectors with different levels of co-contraction only differ for their projection in the null space. Thus, the CNS modulates co-contraction when generating a given endpoint force by varying the projection of the muscle activation in the null space. For a given force target, different levels of co-contractions can be achieved by many different choices of the null space component. A vector scaling strategy consists in changing the amplitude of the null space component without changing its direction (hypothesis 1,Fig 4A). Indeed, with a scal-ing strategy the level of co-contraction, and thus the magnitude of end-point impedance, may
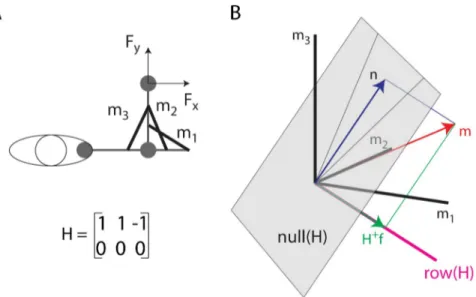
Fig 3. Illustration of the decomposition of a muscle vector onto the null space and the row space of the EMG-to-force matrix. (A) Toy model of a 2 DOF arm with three muscles (m1, m2: elbow extensors; m3: elbow flexor)
generating force along the x-axis according to the specified EMG-to-force matrix (H). (B) A muscle pattern m (in the [2 2 1]Tdirection) is illustrated as a vector (
red arrow) in a three-dimensional space (coordinate axes: black lines)
together with its projectionn (blue arrow) onto the null space of the H matrix (gray plane) and its projection H+f
(green arrow) onto therow (or force) space of the H matrix (magenta line, in the [1 1–1]Tdirection). Because the force space has a negative m3component, the minimum norm solution of theF = H m equation (H+f) cannot be achieved
with non-negative muscle activations and the non-negative muscle vectorm is generated adding a null space vector component (n).
be controlled by a single parameter, a scaling coefficient. Such scaling strategy can be detected by checking the cosine of the angle between the null space projections of muscle activations with different levels of co-contraction. This cosine should remain close to 1, despite the physio-logical EMG variability whose effect we estimated (see Statistical analysis below) by computing the angles between the null space projections of muscle activations recorded during different repetitions of the same baseline target.
The baseline null space projection of the muscle activation vector may not be generated according to an explicit impedance control strategy but rather be a consequence of the fact that physiological muscle activations are non-negative. Moreover, subject might minimize effort while achieving the primary goal of generating a desired force. Thus, we also computed,
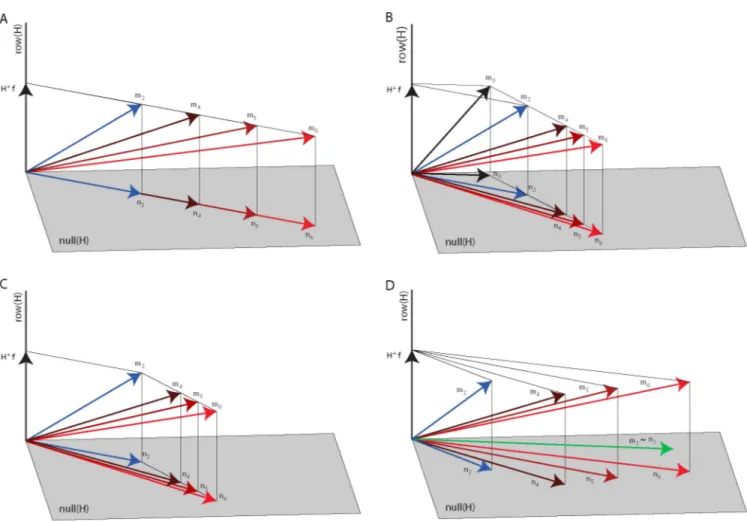
Fig 4. Null space modulation with co-contraction. Four hypotheses on the changes of the null space vector with an increase of co-contraction are illustrated in a three-dimensional muscle space with a two-dimensional null space (gray plane) and a one-dimensional row or force space (black line) orthogonal to the
null space. (A) According to the first hypothesis, the null space vector (n2,blue arrow) associated with the baseline block muscle vector (m2,blue arrow) is
scaled in amplitude to increase co-contraction (n4,n5,n6,red arrows) to generate the muscle vectors in the perturbed blocks (m4,m5,m6,red arrows, all
generating the same force vectorf). Thus, n4,n5, andn6are collinear withn2. (B) According to the second hypothesis, the null space vector (n2,blue arrow)
associated with the baseline block muscle vector (m2,blue arrow) is generated adding a null space vector (n2–n0) to the minimum-norm non-negative
muscle vector (m0) generating the target force (f) and such vector is scaled in amplitude to increase co-contraction. Thus, the difference between the null
space vectors in the perturbed blocks (n4,n5,n6) andn0are collinear with (n2–n0). (C) According to the third hypothesis, the null space vector of the
perturbed blocks (n4,n5,n6,red arrows) associated with the perturbed blocks muscle vector (m4,m5,m6,red arrows) is generated adding a null space vector
(ni−n2withi = 4, 5, 6) to the muscle vector recorded during the baseline (m2) generating the target force (f). Such vector is scaled in amplitude to increase
co-contraction. Thus, the difference between the null space vectors in the perturbed blocks (n4,n5,n6) andn2are collinear with each other but are not collinear
withn2or (n2–n0). (D) According to the fourth hypothesis, the null space vectors of the perturbed blocks (n4,n5,n6,red arrows) associated with the
perturbed blocks muscle vector (m4,m5,m6,red arrows) are generated as a linear combination of the null space vector of the baseline block (n2, bluearrow)
associated with the baseline block muscle vector (m2,blue arrow) and the pure co-contraction block muscle vector (m2,green arrow).
for each force target, the minimum-norm non-negative muscle activationm0:
m0¼arg min (jj m jj) such that f ¼ H � m and mi� 0with i ¼ 1 . . . nm
wheref is the applied force and nmthe number of muscles. The Matlab functionquadprog was
used to calculate these minima. We then tested an alternative affine scaling strategy considering that the CNS might generate co-contraction patterns starting from the minimum-norm non-negative muscle vectorm0and increasing null space activation along a unique direction
(hypoth-esis 2,Fig 4B). We thus considered the differences between the muscle activation vectors (m) observed for each force target in different blocks andm0and we tested whether increased
co-contraction levels were achieved by scalingm m0which is, by construction, a null space vector.
Angles betweenm m0, recorded during trials with the same endpoint force target and different
co-contraction levels were calculated. The cosine of the angles betweenm m0calculated dur-ing different blocks should be close to 1, despite the physiological EMG variability whose effect we assessed, as for the first hypothesis, by computing the angle between them m0vectors
cal-culated during different repetitions of the same baseline target.
We also tested whether the CNS used an affine scaling law obtained by scaling the differ-ence of the muscle vector observed in each perturbed condition and the mean muscle vector observed, for each target, in the baseline condition (m m2) (hypothesis 3,Fig 4C). In this
case the cosine of the angles betweenm m2calculated during different perturbed blocks
should be close to 1, despite the physiological EMG variability whose effect we estimated by computing the angle betweenm2 m2in each baseline repetition respect with the mean
among the baseline repetitions (m2).
Finally, we tested an additional hypothesis involving the mean muscle activation vector recorded during the pure co-contraction block (m3or equivalentlyn3as such vector does not
generate any actual force and thus belongs to the null space of H). For each target, the null space projection of the muscle vector observed in each perturbed condition (n4,n5,n6) might
be obtained by a linear combination of the null space projection of the muscle vector in the baseline condition (n2) and the pure co-contraction vectorm3(hypothesis 4,Fig 4D). In this
case the cosine of the angles between the null space vectorsni(averaged over repetitions
dur-ing different perturbed blocks, i = 4,5,6) and the subspace spanned byn2andm3should be
close to 1, despite the physiological EMG variability whose effect we estimated by computing the angle between the null space projection of different repetitions of the baseline vectors (n2Þ
with respect to the subspace spanned by the mean of the projection of the other repetitions andm3. The EMG data used to test the four hypotheses were obtained by averaging the time
samples in the static phase.
Statistical analysis. Repeated measures ANOVA was performed on time-to-criterion,
force and cursor errors, amplitude and offset of the muscle activation cosine tuning with block as factor (4 levels: baseline B2 and three noise levels B4, B5, B6) to assess the effect of the per-turbation. Post-hoc tests were performed to check the relationships between different blocks, based on the ANOVA outcomes. To this end multiple comparisons were carried out via six t-tests comparing the distributions in each pair of experimental blocks. Due to the unequal sam-ple size between blocks the Welch Two Samsam-ple t-test was applied.
The effect of the perturbation on the preferred directions angles of cosine tuning was tested comparing the cosines of the angles between preferred directions of all pairs of 4 blocks (6 lev-els). As Kolmogorov-Smirnov tests indicated that the cosines of the angles were not normally distributed, the Kruskal-Wallis (KW) non-parametric test was used to compare the medians across block pairs. Post-hoc Bonferroni corrections were applied to post-hoc comparisons.
Assuming that the muscle patterns in different repetitions of the same baseline target were generated according to the same co-contraction strategy, i.e. with collinear null space vectors, we used the observed directional variability of the muscle activation vectors recorded during different repetitions of the same baseline target to estimate the effect of the physiological vari-ability and EMG noise on the assessment of the collinearity between null space vectors among different blocks. Thus, we used the distribution of the values of the cosine of the angles between null space vectors recorded during different repetitions in the baseline block to assess whether a cosine value smaller than 1 between perturbed and baseline nulls space vectors was significantly different from the value expected in presence of only physiological variability and EMG noise, indicating a deviation from collinearity.
To test the first hypothesis on null space vectors scaling, we computed the angles between the null space projections of each target repetition of perturbed blocks trials with respect to each repetition of baseline block trials for the same target, and we compared its distribution with the distribution of the angles among each target repetition of the null space projections of baseline trials.
To test the second hypothesis on null space vectors scaling, we computed the difference between the observed muscle activation vector (mi, i = 2 for baseline, i = 4,5,6 for perturbed
blocks) and the non-negative minimum-norm muscle activation vector (m0) for each target.
The distribution of the angle between all the repetitions of the m4,5,6-m0calculated during the
perturbed blocks and all the repetitions of the m2-m0calculated during the baseline block was
compared with the distribution of the angle among the different repetitions of the m2-m0
cal-culated during the baseline block.
To test the third hypothesis on null space vectors scaling, we subtracted the muscle activa-tion vector, recorded during the baseline block and averaged among the repetiactiva-tions of the same target, from each repetition of the muscle activation recorded during the perturbed blocks (mp m2). Its distribution was compared with the distribution of the angle among the
different repetitions of them2 m2calculated during the baseline block.
Finally, to test the fourth hypothesis, for which the generation of null space vectors when additional co-contraction was required was achieved as linear combination of the null space component of the muscle vector recorded during the baseline condition (force-only) and the muscle vector recorded during the pure co-contraction condition, for each target, we com-puted the angle between the mean null space projection (averaged over repetitions) of the mus-cle activation vector of each perturbed block (ni, i = 4,5,6) and the subspace spanned by the
mean null space projection of force-only muscle activation vector (n2) and mean muscle
acti-vation vector recorded during the pure co-contraction block (m3). To assess the deviation for
a perfect alignment with the subspace due to physiological variability and EMG noise, for each target, we computed the angle between the null space projection of the muscle vectors for each repetition in force-only condition and the subspace spanned by the mean of the null space pro-jection of the remaining repetitions and the mean muscle activation vector in the pure co-con-traction condition, and we averaged the angles obtained for the different repetitions. Then, for each perturbed block, the distribution of the angles for all targets was compared with the distri-bution of the angles due to noise.
For all four tests, a Wilcoxon singed rank test was used to test the statistical difference, with a p-value threshold of 0.05.
Results
All subjects could reach and maintain the cursor within each target with the required 3% MVF tolerance when no perturbation was applied to the cursor (baseline). All subjects could also
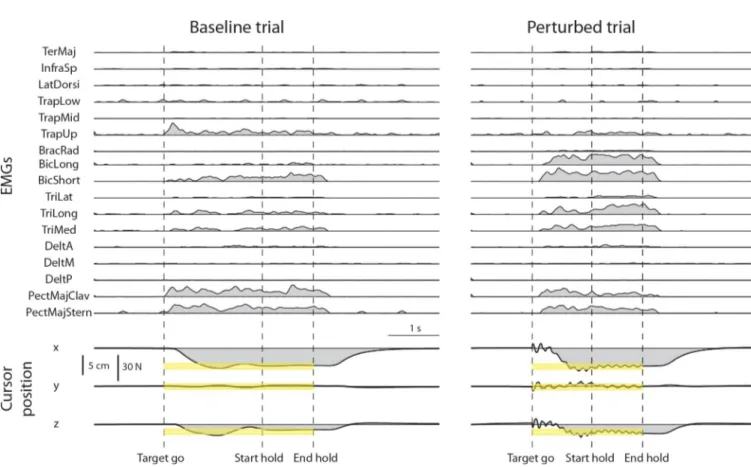
reach each target and increase co-contraction to maintain the cursor within the target with the required 3% MVF tolerance during at least one trial of each perturbed block. Examples of rec-tified, filtered, resampled, baseline subtracted, and MVC normalized EMG signals are shown inFig 5(top) together with the cursor position (bottom) for a baseline trial (left) and a
per-turbed trial (noise level 2,right).
Task performance
The number of selected successful trials was: 46.9± 9.3 (mean ± SD across subjects, see indi-vidual performance inFig 6A) over 60 baseline trials, 11.1± 3.9 over 15 pure co-contraction trials, 48.7± 9.1 over 60 perturbed trials of noise level 1, 46.4 ± 9.0 over 60 perturbed trials of noise level 2, 42.4± 13.5 over 60 perturbed trials of noise level 3. The time required to reach and hold the target position (time-to-criterion,Fig 6B) increased in the perturbed blocks. The ANOVA performed on time-to-criterion showed a significant effect of the block factor (F1, 1770= 243.7, p < 0.001). Post-hoc comparisons (Welch t-test) indicated that significant differ-ences were present between the baseline block and all perturbed blocks and between all pairs of perturbed blocks (B2-B4: t(812.8) = -10.8, p <0.001; B2-B5: t(773.8) = -11.5, p <0.001; B2-B6: t(742.6) = -16.3, p <0.001; B4-B5: t(895.8) = -1.11, p = 0.27; B4-B6: t(882.3) = -6.3, p <0.001; B5-B6: t(899.7) = 5.1, p <0.001).
Fig 5. Examples of muscle activity and cursor position time-course in a baseline and a perturbed trial. A trial of the baseline block (left) and a trial of the perturbed block with perturbation magnitude level 2 (right) for the same force target (target 20 ofFig 2) are shown. EMG data were rectified, low-pass filtered, resampled, baseline subtracted, and normalized to the MVC of each muscle. Cursor position was resampled. Targets were positioned at 20% MVF
(corresponding to a displacement of 5 cm from the origin) with a tolerance around the target of 3% MVF (yellow bands). The dashed vertical lines indicate the time of target appearance (Target go), the last time of the trial in which the cursor entered the target (Start hold), and the end of the hold phase, i.e. the 1s interval in which the cursor remained in the target (End hold). In perturbed blocks (right) the oscillation of the cursor started at Target go and ended at End hold.
The comparison between force and cursor errors provided an indication of the perturbation compensation strategy used by each subject. Subjects could succeed in the task if they managed to combine a reduction of the cursor oscillation, achieved by increasing co-contraction, and an increase in the accuracy of the end-point force exertion. Thus, the required accuracy could be obtained with different combinations of co-contraction and force accuracy increments. The mean cursor position error (Fig 7B) reflects the combination of both force accuracy and co-con-traction, while the mean force error (Fig 7C) only reflects force accuracy. The difference between the cursor error and the force during baseline block was due to the filtering effect of the first mass-spring-damper system. Significant effects of the block factor were observed both for the force error (F1,1778= 209.7, p < 0.001) and the cursor error (F1, 1778= 45.4, p < 0.001). Post-hoc comparisons (Welch t-test) indicated that significant differences in the force error were present between the baseline block and all perturbed blocks but not between perturbed blocks (B2-B4: t(549.7) = 12.4, p < 0.001; B2-B5: t(743.1) = 10.75, p < 0.001; B2-B6: t(754.9) = 12.01, p < 0.001), B4-B5: t(737.4) = -0.47, p = 0.6; B4-B6: t(753.6) = 1.48, p = 0.13; B5-B6: t(914) = -1.62, p = 0.11). Post-hoc comparisons (Welch t-test) indicated that significant differences in the cursor error were present between the baseline block and all perturbed blocks, between B4 and B6, but not between B4 and B5 and between B5 and B6 (B2-B4: t(456.6) = 8.8, p < 0.001; B2-B5: t(767.9) = 6.53, p < 0.001; B2-B6: t(730.9) = 5.3, p < 0.001; B4-B5: t(545.6) = -1.25, p = 0.212; B4-B6: t(584.5) = -3.7, p < 0.001; B5-B6: t(903.1) = -1.70, p = 0.09). Thus, subjects implemented a strategy that reduced the applied force error and performed the force-reaching task more accurately with the noise perturbation; i.e., both force and impedance adaptation occurred, similarly to what observed when learning to reach in a divergent force field [8]. Fig 6. Task performance. (A) Success rate. The mean fraction of successful trials is shown for each subject and each noise condition together with its mean among subjects. The bars represented the percentage of selected trials that were successful (subjects were able to remain within the target for 1 s). The color indicated the noise level (blue: no noise, dark red: noise level 1, medium red: noise level 2, light red: noise level 3). (B) Time-to-criterion (mean± SD) for each subject and noise condition together with its mean among subjects. Time-to-criterion was the time required by the subject to reach and hold the target position. It corresponded to the beginning of the hold phase for successful trials and to the last time the subject got inside the target for the non-successful trials.
Muscle activation and its projection in the null space
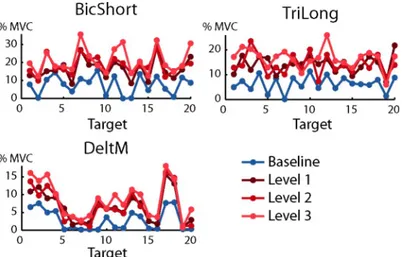
As in previous studies [32,37,38,39] the activation of most muscles was modulated by force tar-get direction.Fig 8shows the dependence of the activation of three muscles, recorded in sub-ject 8 during baseline (blue) and perturbed blocks (red), as a function of the target. As
expected, muscles were more active during perturbed blocks with respect to baseline block. Each muscle applies an end-point force along one direction, its ‘pulling vector’, i.e. the col-umn of theH matrix corresponding to that muscle. The direction of the pulling vector
gener-ally does not coincide with the direction of peak activation [40]. During isometric conditions, if no co-contraction is required and the target force has a direction that is opposed to the pull-ing direction of a muscle, that muscle should not be active [38,41]. Data recorded during the baseline block (target directions 2, 13, and 18 for BicShort, 7 and 19 for TriLong, 5, 7, and 19 Fig 7. Cursor position and exerted force errors. (A) Example of the actual force exerted by the subject (red), used to calculate the force error, and the feedback of force given as the cursor displacement (green), used to calculate the cursor error, along the x component. The trial is the same as in the right side of theFig 5. The target position is in dark yellow and the tolerance in yellow. (B) The cursor position was converted into the force exerted by the subject. This cursor force differed from the force applied by the subject because of the perturbation. The figure represents the norm of the difference between the force related to the cursor position and the target force, averaged during the hold time and normalized to MVF, for different blocks and subjects (mean± SD across trials). On the right side the cursor error was averaged among subjects (mean± SD across subjects). Blue bars are baseline block (no noise), red bars represent the perturbed blocks with different noise levels (noise 1 dark red, noise 2 medium red and noise 3 light red). (C) Norm of the difference between the force applied by the subject at the endpoint and the target force, averaged during the hold time and normalized to MVF, for different blocks and subjects (mean± SD across trials). On the right side, the force error was averaged among subjects (mean ± SD across subjects). Blue bars are baseline block (no noise), red bars represent the perturbed blocks with different noise levels (noise 1 dark red, noise 2 medium red and noise 3 light red).
for DeltM in the examples ofFig 8,blue lines) indeed showed that most muscles exhibited little
activation for targets in directions opposite to their pulling vector. In contrast, data recorded during perturbed blocks show that most muscles were active for all target directions. This Fig 8. Examples of directional tuning of muscle activations. The mean muscle activation of three muscles recorded from subject 7 are shown as a function of target number (seeFig 2A and 2B) in baseline (blue) and perturbed blocks
with perturbation magnitude level 1 (dark red), level 2 (medium red) and level 3 (light red). Note that the targets,
defined inFig 2A, are arranged at the vertices of a dodecahedron. Muscle activation is expressed as the fraction of the MVC recorded during the MVF block (B1).
https://doi.org/10.1371/journal.pone.0205911.g008
Fig 9. Null space component of the muscle activation vector. (A) Example of the ratio between the norm of the muscle activation vector and the norm of the projection of the muscle activation vector in the null space of theH matrix. Data were recorded from subject 8 in the baseline block (blue) and in perturbed blocks with magnitude level 1
(dark red), level 2 (medium red) and level 3 (light red) and averaged over repetitions of the same target. (B) Null space
projection of the muscle activations, normalized to MVC, of successful trials averaged during hold phase and repetitions (mean± SD among directions and repetitions) for all subjects. On the right side, the null space projection of the muscle activations, normalized to MVC, of successful trials averaged during hold phase and repetitions was averaged among subjects (mean± SD across subjects).
indicates that, if the task requires stiffening the arm while exerting an isometric force along a direction, the CNS activates muscles that were silent during the pure force exertion task, possi-bly to counteract the forces generated by other muscles whose activity increases to module co-contraction. To quantify the increase in muscle activation we then computed the norm of the muscle activation vector. Significant effects on the norm of the muscle activation vectors were observed for the block factor (F1,1778= 696.3, p < 0.001). The Welch t-test comparisons indi-cated that significant differences were present between baseline block and the other perturba-tion condiperturba-tions and between B4 and both B5 and B6 but not between B5 and B6 (B2-B4: t (699.76) = -22.9, p < 0.001; B2-B5: t(741.3) = -28.3, p < 0.001; B2-B6: t(761.46) = -30.4, p < 0.001; B4-B5: t(891.78) = -2.4, p = 0.02; B4-B6: t(905.02) = -4.1, p < 0.001; B5-B6: t (913.88) = 1.86, p = 0.06).
To assess how the magnitude of the null space projection with respect to the magnitude of the muscle activation vector changes with co-contraction, we computed their ratio for each tar-get direction (Fig 9A). As expected, the norm of the null space component in perturbed blocks was higher than in the baseline block. The mean fraction observed in the baseline block was: 0.909± 0.021 (mean ± SD across subjects of the fraction averaged for each subject across direc-tions), and was statistically different from the mean fraction observed in the perturbed blocks (0.966± 0.010 in the perturbed block with perturbation magnitude level 1, 0.970 ± 0.012 in per-turbed block with level 2, 0.968± 0.013 in perturbed block with level 3). The statistical differ-ence was tested with a two-sided Wilcoxon rank sum test with a p-value threshold equal to 0.05.
Even in the baseline condition, the null space projection represented a large fraction of the norm of the muscle activation vector. As a non-zero projection of the muscle activation vector in the null space is necessary to satisfy the physiological constraint of non-negativity of the mus-cle activations, we wondered whether the observed fraction of the norm of the null space com-ponent could be due to the non-negativity constraint rather than to a neural control strategy. Thus, we estimated the non-negative muscle activation vector with minimum norm required to generate the applied force (seeMethods) and projected such vector onto the null space. The average ratio between the norm of this projection and the norm of the baseline muscle activa-tion vector across direcactiva-tions and subjects was 0.60± 0.06 (mean among subjects ± SD), which was tested to be significantly different from the ratio observed in all blocks and all subjects with a Wilcoxon rank sum (p-value threshold 0.05) and smaller than it. This indicated that a compo-nent of the observed muscle activation vectors was not due to the constraint of non-negative muscle activation.
Fig 9Bshows the norm of the projection of the muscle activation vector in the null space (mean± SD across directions) for all subjects and all blocks. Significant effects on the norm of the null space projection of the muscle activation vectors were observed for the block factor (F1,1778= 713.3, p < 0.001). The Welch t-test comparisons indicated that significant differences were present between baseline block and perturbed blocks and between the perturbed blocks Fig 10. Cosine tuning of muscle activation. A-D: Example of the parameters of a spatial cosine function characterizing the directional tuning of three muscles (Biceps short head, Triceps long head, and Deltoid middle) of subject 8. Muscles with non-significant fit (p � 0.05) or low quality of the fit (R2� 0.5) for each noise level is reported in black, otherwise baseline (no noise) is reported in blue and perturbed blocks in red (perturbation magnitude level 1 indark red, level 2 in medium red and level 3 in light red). Cosine tuning functions are fitted on MVC normalized muscle activations and therefore amplitude and offset also represent
normalized values. (A) Projection of the preferred directions on the horizontal (x-y, first column), frontal (x-z, second column) and sagittal (y-z, third column) planes (the preferred directions amplitude was normalized to 1). (B) Amplitude of the cosine tuning (data normalized to MVC). (C) Offset of the cosine tuning. (D) R2of the reconstruction. E-H: Comparison of the cosine tuning for different blocks (mean
± SD) among muscles with significant (p < 0.05) and good quality (R2> 0.5) fit in the baseline block and in at least one perturbed blocks. (E) Angle (in degrees) between the preferred directions in the baseline block and in
perturbed blocks. (F) Amplitude of the cosine tuning. (G) Offset of the cosine tuning. (H) R2of the cosine fit. I-N: Comparison of the cosine tuning for different blocks, mean± SD among subjects. (I) Angle (in degrees) between the preferred direction in the baseline block and in the perturbed blocks. (L) Amplitude of the cosine tuning. (M) Offset of the cosine tuning. (N) R2of the cosine fit.
(B2-B4: t(708.84) = -23.5, p < 0.001; B2-B5: t(748.57) = -28.8, p < 0.001; B2-B6: t(773.18) = -30.8, p < 0.001; B4-B5: t(892.83) = -2.43, p = 0.015; B4-B6: t(903.68) = -3.94, p <0.001; B5-B6: t(913.53) = 1.6, p = 0.11). Thus, subjects increased the null space component of their muscle activation vector as the level of the perturbing force increased.
Cosine tuning
The dependence on the target of the activation of most muscles could be fitted by a spatial cosine function (Fig 10). The number of muscles with a non-significant (i.e., p � 0.05) cosine fit was 1.1± 0.8 (mean ± SD across subjects, n = 8) in the baseline block, 1.6 ± 2.1 in the per-turbed block with perturbation magnitude level 1, 2.5± 3.4 in the perturbed block with level 2, and 2.1± 2.5 in the perturbed block with level 3. Thus, most of the 17 recorded muscles had a significant cosine-tuning in all conditions even if there was a small decrease in the number of muscles with a significant cosine-tuning when higher co-contraction was required. As muscle activation could have a significant cosine tuning even if the cosine function did not capture most of the variation, we also quantified the number of muscles with a R2value lower than 0.5. The number of muscles with a low quality of the cosine tuning fit (R2� 0.5) was 2.2± 1.6 (mean± SD across subjects, n = 8) in the baseline block, 3.5 ± 3.3 in the perturbed block with perturbation magnitude level 1, 4.0± 4.3 in the perturbed block with level 2, and 3.4 ± 3.1 in the perturbed block with level 3. We then selected for further analysis only the activations of the muscles with a significant cosine tuning and a value of the cosine fit R2> 0.5. The number
of muscles whose baseline block activation and at least one perturbed block activation satisfied these selection criteria was 14.1± 2.3 (mean ± SD across subjects, n = 8) out of 17 recorded muscles. Thus, most of the muscles, in each subject, had activations that were cosine tuned both in the baseline block and in at least one perturbed block. The number of perturbed blocks in which muscle activation was cosine-tuned, if the baseline block activation was cosine-tuned, was 2.7± 0.7 out of 3 perturbed blocks. Thus, a muscle that was cosine-tuned in the baseline block was in most cases also cosine-tuned in at least two of the perturbed blocks.
The angles between the preferred directions (Fig 10E) in baseline and perturbed blocks were calculated together with the cosine tuning amplitude (Fig 10F), offset (Fig 10G) and R2 (Fig 10H) values. Examples of the cosine tuning parameters for three muscles (as inFig 8) are shown inFig 10A,10B,10C and 10D. The mean angle between the baseline preferred direction and the preferred direction in any perturbed block, for muscles with a significant and high R2 (> 0.5) cosine tuning, was 21.2˚± 5.6˚ (mean ± SD across subjects,Fig 9E). The percent increase in the values of the cosine tuning amplitude and offset in any perturbed block with respect to the baseline block were 38%± 13% (mean ± SD across subjects,Fig 9F) and 166%± 73% (mean± SD across subjects,Fig 9F) respectively. Thus, when increased co-contraction was required, the preferred direction slightly rotated while the amplitude and especially the offset of the cosine tuning increased. Statistical analysis revealed significant effects of the block factor on the cosine tuning amplitude (F1,436= 10.18, p < 0.01) and offset (F1,436= 87.32, p < 0.001). Post-hoc comparisons (Welch test) identified significant differences between the baseline block and perturbed blocks but not between the perturbed blocks both for the cosine tuning amplitude (B2-B4: t(236.56) = -2.1, p = 0.04; B2-B5: t(215.35) = -2.6, p = 0.01; B2-B6: t (219.27) = -2.9, p <0.01; B4-B5: t(209.8) = -0.47, p = 0.63; B4-B6: t(214.8) = -0.9, p = 0.37; B5-B6: t(211) = 0.44, p = 0.66) and offset (B2-B4: t(149.2) = -8.5, p < 0.001; B2-B5: t(130.15) = -8.7, p < 0.001; B2-B6: t(137.54) = -9.24, p < 0.001; B4-B5: t(199.65) = -1.32, p = 0.19; B4-B6: t (207.97) = -1.7, p = 0.1; B5-B6: t(210.58) = 0.29, p = 0.77). Furthermore, there was a significant effect of block pair on the cosines of the angles between preferred directions (KW: df = 5,χ2
= 16.84, p < 0.01). Post-hoc tests however showed that only the difference between the cosines
of the angles between the preferred directions in the baseline (B2) and in the last perturbed blocks (B6) and between the first (B4) and in the second (B5) perturbed blocks was significant (p = 0.016).
Null space components
As muscle activation vectors generating the same force with different levels of co-contraction differ only in their projection onto the null space of the EMG-to-force matrix, to characterize the co-contraction strategies we first tested whether subjects increased their co-contraction by linearly scaling the null space projection observed in the baseline condition (hypothesis 1). Such scaling strategy predicts, in the absence of any physiological variability in the activation of the muscles and EMG noise, the cosine of the angles between the null space component in the baseline block and those in the perturbed blocks to be equal to 1. To assess the significance of a deviation from a cosine value of 1 in presence of variability of the EMG signal, we esti-mated the distribution of the values of the cosine of the angles between the null space projec-tions recorded during different repetiprojec-tions of the same baseline target. The distribution of the cosines of the angles between the null space projection recorded during the block with distur-bance magnitude level 1 and the null space projections recorded during the baseline block was significantly different (p < 0.05) from the distribution of the cosines of the angles among the different repetitions of the baseline block in 5 out of 8 subjects (subject id: 1, 2, 3, 4, 7; p-values of subjects 5, 6, 8 were respectively: 0.203, 0.233, and 0.488). In the block with disturbance magnitude level 2 the differences were significant in 6 out of 8 subjects (subject id: 1, 2, 3, 4, 5, 7; p-values of subjects 6, 8 were respectively: 0.094, and 0.054) and in the block with distur-bance magnitude level the differences were significant in all subjects. Therefore, as a non-col-linearity between the null space projection of the muscle activation recorded during the perturbed blocks and the null space projection of the muscle activation recorded during the baseline was observed in most subjects and disturbance magnitudes, the first hypothesis was not supported.
We then tested whether the changes in null space components observed when higher co-contraction was required could be explained by scaling of the null space vector representing the difference between the observed muscle activation vector (mi, i = 2 for baseline, i = 4,5,6
for perturbed blocks) and the non-negative minimum-norm muscle activation vector (m0see Methods) for each given target (hypothesis 2). The distribution of the cosine of the angles between the m4-m0recorded during the block with disturbance magnitude level 1 respect with
the m2-m0recorded during the baseline block was significantly different (p < 0.05) from the
distribution of the cosines of the angles among the different repetitions of the baseline block in 5 out of 8 subjects (subject id: 1, 2, 3, 4, 7, p-values of subjects 5, 6, 8 were respectively: 0.186, 0.122, and 0.723). In the case of disturbance magnitude level 2 the difference was significant in 6 out of 8 subjects (subject id: 1, 2, 3, 4, 5, 7, p-values of subjects 6, 8 were respectively: 0.073, and 0.365) and in the case of disturbance magnitude level 3 the difference was significant in all subjects. Thus, in most cases m4,5,6-m0recorded during perturbed blocks was not obtained by
scaling the m2-m0recorded during the baseline block, indicating that also the second
hypothe-sis was not supported.
We then further tested whether the changes in null space components observed when higher co-contraction was required could be explained by scaling of the null space vector rep-resenting the difference between the muscle activation vector recorded during the perturbed blocks (m4, 5, 6) and the muscle activation vector recorded during the baseline block (m2) for
each given target (hypothesis 3). The muscle activation recorded during the baseline block, averaged among the repetitions of the same target, was subtracted from the muscle activation