QUADERNI DEL DIPARTIMENTO DI ECONOMIA POLITICA E STATISTICA
Martina Cioni Giovanni Federico Michelangelo Vasta
Ninety years of publications in Economic History: evidence from the top five field journals
(1927-2017)
Ninety years of publications in Economic History:
evidence from the top five field journals
(1927-2017)
Martina Cioni(Department of Economics and Statistics, University of Siena) Giovanni Federico
(Department of Economics and Management, University of Pisa and CEPR)
Michelangelo Vasta
(Department of Economics and Statistics, University of Siena)
ABSTRACT: The growing appeal of the long run perspective among economists and the fiftieth anniversary of the of the publication of the Conrad and Meyer article (1958), which signed the Cliometric Revolution, have attracted a lot of interest on the origin and the development of Economic history. This paper explores the evolution of the field with a new articulated database of all the 6,516
articles published in five journals (Economic History Review, Journal of Economic History, Explorations
in Economic History, European Review of Economic History and Cliometrica) from their establishment to 2017. We show that these journals are the most important in the field, with a wide influence also outside it. Our main results are that the Cliometric Revolution took quite a long time to fully display its effects, which became evident only in the 1990s, when personal computer and software packages became available. Finally, as for the last two decades, we find that the process of integration of economic history into economics is, so far, slower than previously suggested and limited to US. On the other hand, the most striking and neglected change is the overall success of Continental European scholars within the field. Are these changes the harbinger of a new divergence between the two shores of the Atlantic with the rise of a new paradigm based on the “Historical economics” approach? It is too early to tell.
ACKNOWLEDGEMENT: we would like to thank Valeria Battisti, Giulia Cecchetti, Paolo Jonica Nova, Valentina Nanni, Valentina Savelli, Andrea Severini, Federico Terzi, Francesco Tonen, Valeria Vitale, Giorgia Vitucci, Nicolò Zavarise and, particularly, Alberto Montesi and Sara Pecchioli for research assistance. We are grateful to Alberto Baccini, Lucio Barabesi and Sara Franceschi for helpful suggestions.
JEL classification: N01
2
1. Introduction
Economists are paying a lot of interest to economic history in recent times, after
decades of relative neglect, and this shift has rekindled the interest in the history of the field. The conventional wisdom singles out two major breakthroughs, the Cliometric Revolution of the 1960s and the currently on-going “integration of economic history into economics” (Margo 2018). The Cliometric Revolution is credited to have changed economic history from a
historical discipline, relying on descriptions of events based on archival material into an economic one, heavily relying on economic reasoning and statistical testing of hypotheses (Andreano 1970, Fogel and Elton 1984, Lyons, Cain and Williamson 2007, Boldizzoni 2011, Boldizzoni and Hudson 2016, Haupert 2016, Diebolt and Haupert 2018a). This Revolution started with the publication of the seminal article on slavery by Conrad and Meyer (1958), in the Journal of Political Economy, swept the United States in the 1960s and diffused in United Kingdom in the 1970s and 1980s and in Continental Europe in the 1990s. The second major change, spearheaded by the publication of the hugely influential paper on The colonial origins of comparative development (Acemoglu, Johnson and Robinson 2001), can be
interpreted as a further, and possibly final, step in the same direction. Cliometricians still aimed at preserving a specific role of economic history as a bridge between economics and history, and at speaking to historians as well as to economists (Sutch 1991, Collins 2015, Lamoreaux 2015). In contrast, the new generation of economic historians mimics the
economists’ approach, and tries to convince them that economic history is relevant not just for the sake of knowledge, but also to understand the present (McCloskey 1976, Arrow 1985, Nunn 2014, Abramitzky 2015, Temin 2016). Many recent papers directly link current
outcomes (GDP per capita or similar data) to specific historical events, such as colonial institutions in the already quoted paper by Acemoglu Johnson and Robinson (2001) or slave trade in another famous paper by Nunn (2008).
This conventional wisdom has long been based on anecdotal evidence, but recent works show a welcome shift towards a quantitative approach, which had been pioneered by Harte (1977). Yet, all this literature is partial in a way or another. Some deal with a journal only,
3
such as the Economic History Review (Wrigley 1999), the Journal of Economic History (Whaples 1991, 2002) and the Australian Economic History Review (Morgan and Shanahan 2010, Selzer 2018): Di Vaio and Weisdorf (2010) compare the citations success of thirteen economic history journals but cover only the citations from other journals of that specific sample to articles published in 2007, while Ojala et al (2017) focus on the most cited articles in the two long-established Business History and Business History Review. Other works deal with one specific research question, such as the causes of the growth in co-authorship (Selzer and Hamermesh 2018), the growing interest in non-Western economic history (Fourie and Gardner 2014), the spread of quantitative methods in business history (Eloranta, Ojala and Valtonen 2010), the increase of articles on economic history in economic journals
(Abramitzky 2015, Diebolt and Haupert 2018b) and the diffusion of advanced statistical techniques in economic history journals (Margo 2018, Wehrheim 2018).
This paper contributes to this line of research by addressing a wide range of issues with a comprehensive database, covering five economic history journals (henceforth T5-EH), Economic History Review (EHR), Journal of Economic History (JEH), Explorations in Economic History (EEH), European Review of Economic History (EREH) and Cliometrica
(CLIO). Our database includes a total of 6,516 articles – i.e. articles published in these
journals from their establishment (respectively in 1927, 1941, 1969, 1997 and 2007) to 2017. Moreover, we explore the integration of economic history into history by comparing the articles in T5-EH with articles on economic history published, since 2001 up to 2017, in the top five economics journals (henceforth T5-E): the American Economic Review (AER), Econometrica (ECMA), the Journal of Political Economy (JPE), the Quarterly Journal of Economics (QJE), and the Review of Economic Studies (RES).
We justify our selection of the T5-EH in Section 2 by showing that they have been the most quoted in the field since the data are available and that they form a strong network, which attracts a lot of citations from economics and other disciplines. We describe our databases in Section 3, while in Section 4 and 5 we outline the main trends in economic history using respectively as unit of analysis papers and authors. Section 6 explores the long-term evolution of citations received by articles contained in the database, while Section 7
4
compares the recent trends of economic history research in the T5-EH and in the T5-E. Section 8 concludes.
2. A bibliometric analysis of economic history journals
According to a recent survey (Poelmans and Rousseau 2016), the decision of the outlet of the publications of economic historians is heavily affected by the kind of department they are affiliated with.1 Economic historians working in economics department aim at publishing their work as articles in international journals with Impact Factor (IF). They regard journals without IF as the second best and books with major international publishing houses only as their third option. This ranking is deeply different for their colleagues working in history departments, who deem books with international publishing houses as the best option and rank journals according to their general standing rather than their IF. Although there is no comparable survey for the 1950s, all anecdotal evidence suggests that the pre-eminence of journals outlets for advanced research in economic history is by itself a product of the
Cliometric Revolution. The first journal in economic and social history, the Vierteljahrschrift
für Sozial- und Wirtschaftsgeschichte, had been founded in 1903, the first business history
journal (the Bulletin of the Business Historical Society, renamed in 1954 as Business History Review) in 1926 and the first journal specialized in economic history, the Economic History Review, one year later. Yet economic historians traditionally published their main work in books, and earlier Cliometricians imitated them (Margo 2018). The two 1993 Nobel
laureates, Robert Fogel and Douglas North published most of their path-breaking researches in books (Fogel 1964, 1989, Fogel and Engerman 1974, North and Thomas 1973, North 1981, 1990). Nowadays, economic historians still write more books than economists, either as traditional research books (e.g. Mokyr 1990, 2002, Pomeranz 2001, Clark 2007, Allen 2009, Rosenthal and Bin Wong 2011) or, as general, non-technical synthesis of papers in journals (Williamson 2011).
1 The survey received 332 responses on a total of a list, assembled on the basis of different criteria, of about
5
In the last decades, the number of economic history journals in the world has greatly increased and trace all of them would be impossible. Thus, we consider only journals which are listed at least in one of the two main citation databases, Web of Science (WoS) and
Scopus and thus arguably fit the definition of “international journal” referred above. This
choice is certainly restrictive, as it omits journals of long tradition, such as the already quoted Vierteljahrschrift or the Italian Rivista di Storia Economica, established in 1936. It can be justified by the careful vetting which journals are subject to before being included in the databases. We adopt a quite wide definition of economic history, including business history, even if many consider it as a separate subfield (Ojala et al 2017) and
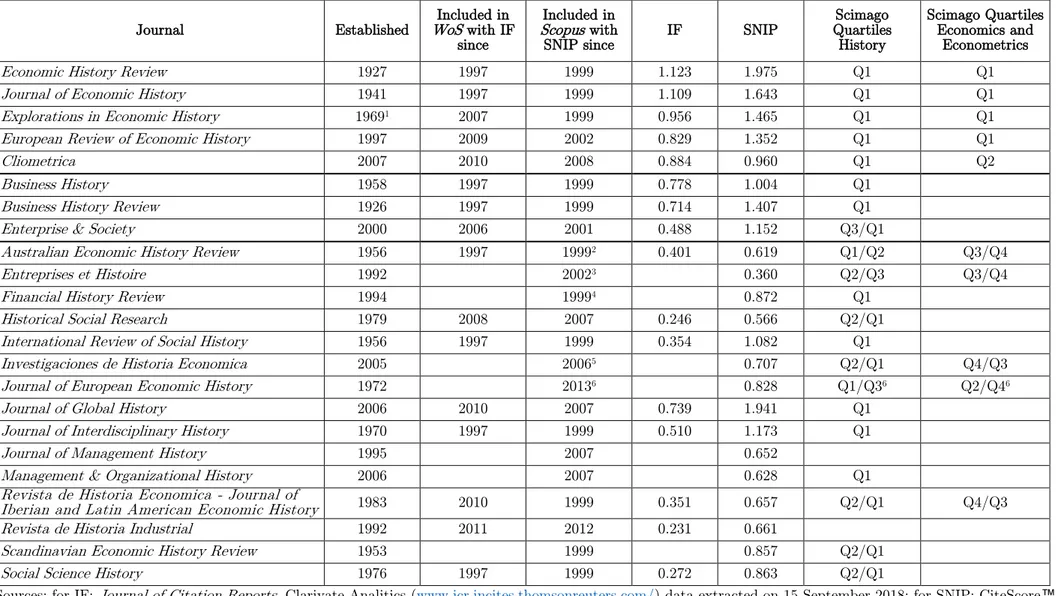
interdisciplinary journals with a strong interest in social and economic history.2 The two databases provide various measures of relevance of journals, such as the IF and 5-Year Impact Factor (IF5) for WoS and the SJR (SCImago Journal Rank) and SNIP (Source Normalised Impact per Paper) for Scopus.3 We have selected the two most representative measures of impact, the IF and SNIP, which we report in Table 1 for the last five years, alongside the position by quartiles in the two main subject area (History, and Economics and Econometrics) in the SCImago ranking. The results are quite neat. No other economic
history or business history journal matches the selected five for any criteria, and only two of
2 Di Vaio and Weisdorf (2010) adopt a more restrictive definition of economic history, but they include in their
list some journals outside the WoS such as the Irish Economic and Social History, Jarhbuch für
Wirtschaftsgeschichte and Rivista di Storia Economica as well as the Annales.
3 The IF is computed for each year according to different methods:
i) IF in a given year refers to citations received in the same year by articles published in the two previous years:
𝐼𝐹𝑡=
𝐶𝑖𝑡_𝑡𝑡−2+ 𝐶𝑖𝑡_𝑡𝑡−1
𝐴𝑡−2+ 𝐴𝑡−1
where, t is the year for which the IF is computed; Cit_tt is the number of citations received by the articles in
the same year for which the IF is computed; At is the number of citable articles.
ii) IF5 refers to citations received in a given year by articles published in the five previous years:
5𝑦𝐼𝐹𝑡=
∑𝑡−5𝑡−1𝐶𝑖𝑡_𝑡𝑡
∑𝑡−5𝑡−1𝐴𝑡
where, t is the year for which the 5yIF is computed; Cit_tt is the number of citations received by the articles in
the same year for which the 5yIF is computed; At is the number of citable articles.
The SJR is the number of weighted citations received in the selected year by the documents published in the previous years and it takes into account the prestige of the journals where citations come from, while the SNIP measures contextual citation impact by weighting citations based on the total number of citations in a subject field, using Scopus data. Anyway, all measures are fairly well correlated and IF is also well correlated with the H-index by Google scholar (Hamermesh 2018). For detailed information on all these indicators, see Todeschini and Baccini (2016).
6
the interdisciplinary ones have a comparable SNIP (but they are well behind on the two other indicators). On the other hand, no economic history journal can match the impact of top economic journals: in the same years, the T5-E journals had an average IF around 4.4 and a SNIP around 4.7, both almost four times higher than for the T5-EH.
Table 1 about here
The prominent role of the T5-EH is confirmed by two other pieces of evidence. They appear top of the ranking by Di Vaio and Weisdorf (2010: 11), both in their basic,
unadjusted measure of all citations from other economic history journals, and in their preferred “baseline” one, which adjusts for self-citation, age and size of the journal. Second, as Table 2 shows, the T5-EH are ranked quite high in three major international rankings, the Categorization of Journals in Economics and Management by the French Comite National de la Recherche Scientifique (CNRS 2017), the Academic Journal Guide by the Association of Business Schools (ABS 2018) and the Academic journals in Economics by Kalaitzidakis, Mamuneas and Stengos (KMS 2011). In this latter, the JEH, EEH, and EHR are in the top 100, while EREH and CLIO do not feature at all, having too short track record to be included. For the same reason, they are in the second or third tier in the two other rankings. Other journals from Table 1 are not ranked at all or are ranked much below the top three. Academic journals in Economics includes only the Australian Economic History Review, as 173th, while for the Categorization of Journals in Economics and Management, Business History is in the second class.
Table 2 about here
Given this evidence, we are confident that the T5-EH are representative of the state of the art in economic history. It is however important to remind the differences among them, which reflect their institutional history. The EEH had been established in 1948 as
Explorations in entrepreneurial history, but it was taken over and re-named, in 1969, by “new” economic historians. We include it in the database only after this change and thus for all purposes it appears as a Cliometric journal. The EREH was established, in 1997, as the
7
journal of the European Historical Economics Society (Sharp 2013) and CLIO, in 2007, as
the journal of the Association Francaise de Cliométrie. Thus all three journals, to some
extent, were “native cliometrician”. In contrast, the JEH and the EHR had a long tradition and changed progressively since the 1960s, as the result of a progressive take over by a new generation of cliometricians (Diebolt and Haupert 2016).
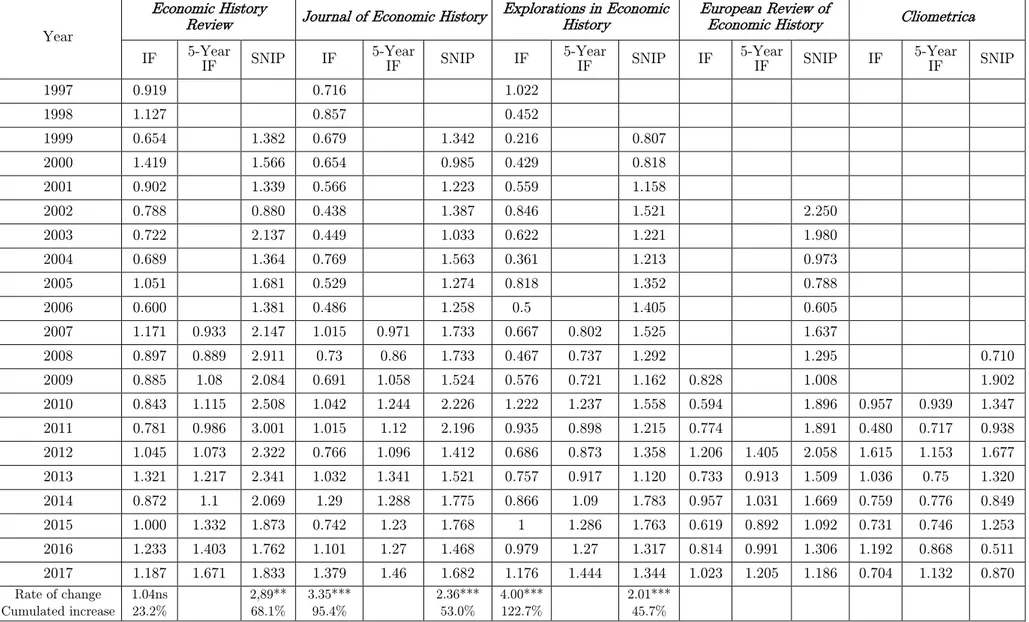
The discussion so far has focused on the past five years, which might not be representative of long term trends. Unfortunately, it is impossible to extend the comparison back in time for most journals, including EREH and CLIO, because they have entered in the databases only in recent years (Table 1). Sufficiently long series are available only for three of the T5-EH (Table 3).
Table 3 about here
The data suggest at least three stylized facts. First, in general, the impact of the T5-EH has been rising, as shown by the results of a simple log regression with time. The rates of change (Table 3, last two rows) are always positive and, with one exception only, significant over the whole period. They imply an increase in the impact measures from 23 to 122
percent. This rise is to some extent a natural consequence of the growing number of journals in the WoS and Scopus databases, but the differences between journals suggest that other factors mattered as well. We will explore them in Section 4 and in a companion paper (Cioni, Federico and Vasta 2019). Second, the indexes are rather, but not excessively
volatile, with standard deviations of residuals ranging from 0.16 to 0.34, and, at least for IF, volatility is declining.4 Last but not least, the ranking of IF and SNIP coincide for the whole period 1999-2007 (first EHR, then JEH and third EEH), but their yearly movements differ a lot. The crude coefficients of correlation between the two indexes are quite low for EEH (0.63) and JEH (0.64) and much lower for the EHR (0.13). The correlations are even lower
4 The standard deviations are 0.251 (IF) and 0.167 (5-Year IF) for JEH, 0.221 and 0.251 for EHR and 0.345
and 0.168 for EEH. The volatility declined between 1997-2006 and 2007-2017 by a half to one third according
8
(0.42 for JEH, 0.49 for EEH, and 0.04 for the EHR) if computed on residuals from the regression, which measure more precisely the short-run fluctuations.
The citations are useful not only as a general measure of impact of a specific journal, but also to map the scientific connections within the field or among journals of different fields. We explore these connections by extracting all citations received and done in 1997 by the EHR, JEH and EEH, and in 2017 by all the T5-EH from the Journal of Citation Report (Clarivate Analytics). This source is very detailed, but it has some limitations. First, it does not list items, including journals, which cite or are cited by the journals only once. They are lumped together in the generic category “other”, which in the case at hand accounts for over a half of all citations done (56 percent in both years) and for a small share for citations received (16 percent in 1997 and 22 percent in 2017). Second, the source includes books and documents other than journal articles (e.g. primary sources, working papers, and PhD dissertations) only in citations done but exclude them from the citations received. We deal with this asymmetry by excluding this material from our analysis, which thus refers only to journals. It is however important to remind that books are still a relevant source of ideas and information, accounting at least for 22.2 percent of citations in 1997 and for 19.2 percent in 2017.5 Furthermore, these figures might be underestimated the share of books, because books, especially in languages other than English, are likely to account for a large proportion of the items cited only once.
We analyze the citation patterns of T5-EH by reporting separately the data for each journal (and for their sum), plus the sum of citations to and from seven groups: i) the T5-E, ii) the top three journals in business history (T3-BH) -Business History, Business History Review and Enterprise & Society -, iii) the other economic history journals as listed in Table 1, iv) other economic journals, v) other social science journals, vi) history journals; vii) other journals, a residual category which includes different subject areas, such as chemistry or computer science and so on. Economic history journals not in the Journal of Citation Report
5 Books have been singled out on the basis of abbreviation of the titles of individual items or of series (such as
Routledge Research in Gender and History or The Cambridge History of Science). Thus there is a margin of uncertainty in the classification.
9
database are all included among “other social science” journals, and thus our computation underestimates the impact of the T5-EH in the field.
The most striking feature of citations done (Table 4a-b) is the permanent strength of the network of the T5-EH. In 1997, citations to the T3-EH accounted for 33.8 percent of the total, and citation to the same journal (self-citations) for 18.6 percent. Twenty years later, the total number of citations within the network had increased by two thirds, and their share on total was still 29.2 percent. This slight decrease is entirely accounted by the fall in citations to the same journal down to 10.1 percent (11.4 percent for the T3-EH, with a decrease also in absolute number). The citations to other journals, excluding self-citations, increase to 19.1 percent, as the result of the doubling of the share for the EHR and of the high propensity of the two newcomer journals, EREH and CLIO, to cite the other top EH journals. In contrast, JEH and EEH cited roughly the same number of times both themselves and the other four top journals in 1997 and 2017.
Table 4a-b about here
The share of “history” journals halved, even if the absolute number of citations
increased by 60 percent, the share of “other social sciences” and other fields remained stable, while citations to economic journals (the T5-E plus other “economics”) soared, from 356 to 1,221 – i.e. from 23.9 to 42.2 percent. In 2017, the T5-EH cited economics journals more frequently than economic history ones. This shift was spearheaded by the EEH, which, in 1997, had cited economics journals less than the JEH. In 2017, all economics journals accounted for almost two thirds of all citation for EEH and the T5-E for almost a quarter, i.e. 4 percentage points more than the share of T5-EH (23.9 percent vs. 19.5). In contrast, the EHR is still strongly oriented towards the journals of the field, with the share of citations to T5-EH (30.4 percent), significantly above the share of all economics journals (25.6 percent).
The distribution by group of citations received, rather than done (Table 5a-b) features a sharp decline in the share of T5-EH which, given the overall increase in total number,
10
corresponds to a small increase (from 502 in 1997 to 841 in 2017). In contrast, the combined share of T3-BH and “other economic history” journals increased by a couple percentage points, from 11.1 to 13.4 percent. Clearly the T5-EH are a landmark for these latter. On the other hand, the bulk of the increase in citations comes from journals outside the field, as result of growing size of the database and/or of the increasing interest towards economic history.
Table 5a-b and about here
The share of citations from “history” journals remained constant around 15 percent of the total and thus the absolute number increased fourfold. The citations from “other social sciences” and, above all, from other fields (“others”) increased massively in relative and absolute terms. Yet, the most relevant change is the rise of citations from economics journals, or more precisely from “other economics” journals. They jumped from 149 in 1997 to 1,010 in 2017, accounting for almost a third of the total increase of citations received by the T5-EH. In contrast, the T5-E showed little interest in T5-EH, citing them only 21 times in 1997 and 33 in 2017. This scarce attention contrasts with the recent increase of articles on economic history issues in those journals (Section 7). The difference among the T5-EH emerges quite clearly also in citations received in 2017. Economic journals cited mostly the JEH and EEH, which accounted for three quarters (76.5 percent) of all citations received from the T5-EH. Unsurprisingly given its age, CLIO got few citations from economics journals, but these citations accounted for a large proportion of the total citation it got (29 on 78). The EHR exhibits a more traditional pattern, with most citations from economic history journals and almost as many citations from “history” (327) than from economics (173), “other social sciences” (136) and “others” (135). The EREH stands out for the success it got among other field journals. In 2017, it received about a third of its citations from the other top four EH journals, and a further 18 percent from “EH journals” and “business history” journals.
11
Figure 1a-b compares the citations network in 1997 and 2017, allowing to better highlight the massive change in the citation pattern outside the field both from the citing and the cited sides.
Figure 1a-b about here
3. The databases
As said, our main database includes all articles published in the T5-EH since their establishment (see Table 1) to the last issue of 2017, inclusive of short notes, comments, replays, rejoinders, rebuttals, and essays in bibliography. We prefer to include all these non-research articles, unlike Hamermesh (2018), for two reasons. In the early period, the
distinction between regular articles and short research notes is not so clear and, although their number is small (about 2.5 percent of the total), the movements in the yearly share on total articles reveal some relevant changes in the scholarly debate in economic history (see Section 4). On the other side, the database excludes book reviews, summary and reviews of PhD thesis, conferences introduction and obituaries, that are obviously not refereed. These criteria yield a total of 6,516 articles (Table 6).
Table 6 about here
Half of all these articles (3,247) have been published in the last thirty years and almost four fifths (5,182) in the last fifty (Figure 2). Before 1940, the EHR published on average 12 articles per year and its size shrank remarkably during WWII. The establishment of the JEH, which since its beginning was double the size of the pre-war EHR, marked a first major discontinuity. The total number of articles increased steadily in the 1950s and 1960s, especially in the EHR, and jumped again to over one hundred after the transformation of the EEH into an economic history journal in 1969. It declined somewhat in the early 1990s, and grew in the last years up to 140 and beyond. In 2012, the T5-EH journals published a total of 159 articles, five more than the whole period 1927-1940. The establishment of the EREH in 1997 and of CLIO in 2007 account for slightly more than half of this increase: in
2015-12
2017 they published on average 21 articles per year, while the other three journals 18 articles more than in 1994-1996. Furthermore, the number of articles biases downward the number of pages, as the length of articles has been growing from about 15 pages until the mid-1980s up to a peak close to 30 in the mid-2000s.
Figure 2 about here
We have collected for all the 6,516 articles in the database the key bibliographic references (names of the authors, title, issue of the journal and length in pages) and four different sets of information, referring to authors, content (topic, geographical area and period), methods (tables, figures and econometrics tools) and impact, as measured by citations.
The information on author(s) include name, gender and the affiliation at the time of publication, as stated in the article. A small number of articles (0.7 percent), especially in the early years reports only a name of city without institutional affiliation, possibly because authors were independent scholars. Unfortunately, a large number of articles specifies only the University (or college) and thus we cannot keep the distinction between departments of Economics and History, which would have been informative (Poelmans and Rousseau 2016). We have classified the articles by topic by looking at the title, abstract and, in some
controversial cases, directly at the text. We have decided not to use the JEL codes of the American Economic Association because we deem then too aggregate. Thus, we have defined 17 categories, trying to achieve the maximum level of detail without being forced to allocate arbitrarily articles on broad issues. Table 7 identifies and briefly describes them, reporting also the corresponding JEL codes.
Table 7 about here
Our basic classification by period follows the standard division in “Classical history” (before 476), “Medieval history” (476-1492), “Early modern history” (1492-1815) and “Modern history” (1815-present). We have labelled “long period” articles which deal with more than one period such as from 1700 to 1870. The “Modern period” accounts for most of the articles
13
and thus he have further distinguished four sub-periods (1815-1870, 1871-1913, 1914-1945 and after 1945), five extended periods (1815-1913, 1870-1945, 1914-present, 1915-1945 and 1870-present) and a residual category which includes paper dealing with all the period from 1815 to present (“all modern”). We group in a category “no period” theoretical and
methodological articles.
We distinguish five different geographical area categories, referring to: i) the whole world, ii) one continent without further specification, iii) two or more countries in the same continent, iv) two or more countries in different continents, and v) a single country. Then, we add a residual category of “no area”, for all the cases in which the article's content could not be referred to a geographical area (i.e. theoretical and methodological articles).
We consider three different definitions of quantitative methods, with an increasing level of sophistication. The lowest level features simple quantitative tools (tables, figures and graphs), the intermediate (“econometric methods”) the use of regression analysis, and the highest the use of “advanced” econometric and statistical methods. Following Margo (2018), we have singled out articles in the third category by looking for words related to six different techniques (differences in differences, instrumental variables, panel regression, propensity score matching, vector-autoregression or VAR, and vector error correction model or VECM), with the advanced search tool of Google Scholar. This method might yield false positives, if these words are quoted in the references, in the literature survey, or appear in negative statements (“we cannot use panel regression”). Thus, in any doubtful case, we have double-checked the results with a direct reading of the selected articles.
Finally, we have collected the information on the yearly number of citations received from Scopus, which we prefer because it has a wider coverage and a simple method to
retrieve data. The database provides the number of citations received from 1970 to nowadays to any article published in the T5-EH. The data provide a good coverage for articles
published since 1970 and excellent from the 1990s, while they underestimate the impact of older articles as they omit citations from the publication date to 1969. The citation count is
14
missing for 241 articles (3.7 percent) in the database. Overall, the total number of citations in the database, as of 15 September 2018, is 100,861.
For our analysis of the integration of economic history into economics (Section 7), we have collected the same information for all articles on economic history issues published in the T5-E since 2001. As a general rule, we include in this database articles which explore the relations between some events, institutional changes or a given situation in the past and economic outcomes, either in the past or in the present. We have selected these articles looking at the abstracts and/or at their contents and, when available, at the JEL code by choosing all the N category (Economic History). As said in the Introduction, the main methodological innovation of recent trends is the explanation of current outcomes as the consequence of specific past events, as in already mentioned article by Acemoglu, Johnson and Robinson (2001). We define articles with this research question as “Historical
economics”, as opposed to “History” ones, which deal with past outcomes, such as the effect of different endowment of upper tail human capital on the regional differences in the
diffusion of modern technologies in XIX century France (Squicciarini and Voigtlander 2015). Since almost all articles of these two categories use econometrics tools, we can distinguish them by looking at the specification of the dependent variable in the main regression of the work. Following McCloskey (1976), we classify as “Model testing” the articles, such as
Cervellati and Sunde (2005) on life expectancy and economic growth, which test an economic model with historical data without providing any information about historical context, such as a description of institutions or information about relevant events.
4. The evolution of economic history: articles
The distribution of articles in time (Figure 2) has some important consequences for our results. First, by definition, before 1940 our analysis is limited to the EHR, which mainly published works by British scholars on the economic history of the United Kingdom (Section 5). Second, the combined effect of their earlier establishment and their bigger size implies that JEH and EHR dominate the database, accounting for three quarters of all articles
15
(Table 6). Third, the overall growth in the number of articles augmented the number of pages corresponding to any given share of the total: a 1 percent share corresponds to 0.1 article per year before 1940, to 0.4 in the 1940s and 1950s, to around 1 from early 1960s to mid-2000s and finally to 1.5 articles after 2007. Last but not least, the hump in the number of articles per year in the 1970s and 1980s (Figure 2) reflects the large number of short articles, which accounted for 5.7 percent of the total from 1968 to 1984, with a peak of 11.2 percent in 1977. Arguably, this increase is a consequence of the Cliometric Revolution, which stimulated the discussion on methods and results. A single discussion between Leunig and Voth and Razzell on stunting of boys in XVIII century London produced 5 articles in the late 1990s. These kind of exchanges has largely disappeared in more recent years (the share of short articles in 1997-2017 is only 0.25 percent), because the research works are subject to much more intense scrutiny in seminars and conferences and are quite often published as working papers before submission, reducing the scope for ex post comments.
In the following, we take into account the changes in the coverage of the database as well as the effects of the two major methodological breakthroughs (the Cliometric Revolution and the “integration of economic history into economics”) by dividing the ninety years in five periods: before 1940, the “British period”; 1941-1960, “the traditional economic history”; 1961-1996, “the age of the Cliometric Revolution”; and 1997-2017, “the rise of the new European journals”, which broadly coincide with the integration of economic history into economics.
Table 8 illustrates the change, by period, in the shares of the 17 topics on total number of articles and Figure 3 plots, for each topic, the evolution over time. The distribution by topic varied considerably across periods: a chi-square test rejects the null hypothesis of equal distribution at 1 percent for the long run comparison between 1927-1940 and 1997-2017, and also for all pairwise comparisons between subsequent periods except between the second and the third.
16
Some of these changes can be interpreted rather easily. For instance, the decline of “Institutions” from top the list of issues in the first to fifth in 1961-1996 and its return to the top in the last period reflects a deep change in the object of interest. The early works
described organizations such as the Islamic guilds (Lewis 1937), the more recent ones, such as the article by North and Weingast (1989) on property rights and debt management after the Glorious revolution, reflects the modern definition of institutions as rules of the game. The articles on “Economic History as discipline” in the British period informed readers of the EHR about teaching of Economic history, on economic history in other countries and similar topics. This type of articles disappeared rather early, but the issue remained relevant, with several burst of interests — the last one in the 1970s for the methodological controversies after the Cliometric Revolution. The increase in the shares of articles on “Firms” (i.e. business history) and of “History of Economic Thought” (HET) after 1940 reflects mostly, although not entirely, the addition of JEH to the database, as both issues were widely studied by American economic historians. In the fourteen years from 1927 to 1940, the EHR had published 10 articles in these two categories: in the next fourteen years, the JEH
published 38 articles on “Firms” and 23 on “HET” (and the EHR additional 8 and 10). Both declined, in relative and absolute terms, from the late 1960s onwards, as in the Australian Economic History Review (Morgan and Shanahan 2010), for the combined effect of the Cliometric Revolution and the growing availability of alternative opportunities of publication in specialized journals, such as Business History (since 1958), Enterprise & Society (since 2000) and History of Political Economy (since 1969). In the 1940s and 1950s, the articles about productive sectors (“Agriculture”, “Industry” and “Services”) accounting for about a quarter of the total, consisted mostly of general analysis of descriptions and discussion of trends. These categories declined, with some partial exceptions (e.g. “Agriculture” during the Cliometric Revolution), because scholars moved to more specific research questions, which are classified under other categories, such as “Innovation” or “Firms”. The big increase of articles on “Labour” in the mid-1970s reflects the spurt of interest in slavery after the
17
publication of the seminal book of Fogel and Engerman Time on a cross (1974). Other categories, such as “Growth” or “Trade” remained broadly constant in percentage, and thus increased in total number of articles. The most conspicuous recent trend is the rise of interest in “Finance” and in issues related to personal conditions and behavior, such as “Human capital”, “Population and demography”, “Income distribution” and, above all, “Standard of living”. These latter four topics accounted for less than 5 percent of articles in the 1940s and 1950s and rose a lot in the last period – up to almost a third of total in 2015-2017. Articles published in these last three years account for 6.5 percent of the total in the database, but for 9.4 percent of articles on the “Standard of living”, 9.7 percent of articles on “Population and demography”, 17 percent of articles on “Income distribution” and for 20 percent of articles on “Human capital”. This means that these issues are really fashionable amongst economic historians nowadays.
Unsurprising, economic history was a local field at its beginning and, somewhat more surprisingly, it has largely remained such (Figure 4). All comparative articles (i.e. papers dealing with more than one polity) account for slightly more than a sixth of the total of the whole database. The share fluctuated significantly, especially in the early years, but there is no clear upward trend. The aggregate share for T5-EH is still stuck around a fifth in 2013-2017, although it is a bit higher in the two newcomer journals, CLIO and EREH. The editorial statement for this latter quotes comparison within Europe as a key interest area of the journal (Hatton, Persson and Zamagni 1997) and yet comparative papers accounted for less than a third on average in the whole history of the journal.
Figure 4 about here
Our definition of “comparative” article is arguably rather generous, as it includes any paper dealing with two polities in the same continent. Articles dealing with polities in different continents (or “intercontinental”) accounted for about a quarter of the comparative ones (i.e. for about 3 percent of total) until 1960, rose after the Cliometric Revolution, up to
18
a maximum slightly about a half in the 1990s and then declined again (Figure 5). In spite of the hype on globalization, since 2007, the T5-EH have published only 115 “intercontinental” articles, about a third of the comparative ones but less than a tenth of all articles. Last but not least, only a minority of these papers would be classified as intercontinental if the category included only articles dealing with all the world, or with representative samples of polities in several continents. In spite of the diffusion of the on-line sources, it remains rather difficult to build really intercontinental dataset, a notable exception being the Maddison project for GDP data (Bolt and Van Zanden 2014).
Figure 5 about here
The high share of single country papers reflects the strong home bias which has
featured economic history for almost the whole period: scholars worked mostly on their own country and published mainly on national (or area-specific) journals. Thus, the shares of papers by area reflected closely the distribution of articles by journal (Figure 6a-c), and ultimately the distribution of authors by country, which we will discuss in Section 5.6
Figure 6a-c about here
Before 1940, United Kingdom accounted for about 70 percent of the articles in the EHR and Continental Europe, including 17 comparative papers with United Kingdom, for almost all the rest. Only 7 papers out of 150 dealt with other continents. The start of publications of the JEH and later of the EEH boosted the share of North America, from 1.3 percent (2 articles) to 25.3 percent in 1941-1960 and 34.2 percent in 1961-1996. These latter figures were not as high as one would expect because American journals were slightly less home-biased than the EHR. Articles on North America accounted for about half the total, while articles on the United Kingdom for about four fifths of the articles in the EHR. The distribution changed since the mid-1990s, when the share of articles on Continental Europe doubled.7 These articles accounted for most articles in the EREH (72.5 percent) and CLIO
6 These shares are computed on a total of 5,903 articles, which excludes “no area” and “intercontinental” papers.
7 Continental Europe includes also comparative articles dealing with United Kingdom and other European
19
(52.4 percent) but also for a growing share of articles in the Anglo-Saxon journals. In 1997-2017, the paper on Continental Europe accounted for about 25 percent of the articles in the JEH and about 30 percent in the EHR and EEH. Remarkably, in 2016-2017, the EHR published more articles on Continental Europe than on the United Kingdom.
In contrast with these substantial changes, the share of articles on the rest of the world (“others”) remained remarkably stable, around 10 percent, until the end of the century, and increased a little only in the last years. The EHR had published five articles on Asia in the first fourteen years, 3.3 percent of the total, and since then the share of Asia has
fluctuated widely around 5 percent, with peaks around or over 10 percent in 1947 (3
articles), 1959 (4), 1963 (5) 78 (9), 2009 (12) 2014 (12) and 2017 (14), but also years without a single article (e.g. 1960, 1962, 1976). Oceania remained always below 1 percent, and the only big movement was the “renaissance” of African economic history (Austin and
Broadberry 2014). Actually, economic history of Africa was not totally absent from the T5-EH: the earliest research on African economic history had appeared as early as 1954 in an article (The under-developed economies) by Hancock (1954) in EHR and in an article (Some economic factors in the political development of the Gold Coast) by Apter (1954) in JEH. Yet there is a striking contrast between the 61 articles published until 2003 and 44 from 2007 to 2017 (13 in 2014 alone).
Most of the research in economic history in the last ninety years has focused on the modern period (1815 to present) and especially on the “long XIX century” from Waterloo to WWI.8 They account respectively for two thirds (4,091) and for a third (2,169) of all articles in the database. There are 724 articles exclusively on interwar years (11.2 percent) and only 287 (4.4 percent) exclusively on the period after 1945.9 The low share of articles on post-1945 period cannot be explained only by the lack of historical depth, as it has risen only
marginally in most recent years, up to 6.2 percent of the total since 1997 (9.6 percent adding
8 In this case the total is 6,437 articles omitting “no period” ones. Articles on pre-476 have always been very few
(a total of 39 – i.e. 0.6 percent). In contrast, a sizable number of articles encompass more than one macro-period – most often “Early modern” and “Modern” ones, a total around 10 percent for each year.
9 These figures do not change much if we add the articles dealing with interwar years and the period before
20
articles dealing also with the interwar period). As Figure 7 shows, the establishment of the
JEH tilted decidedly the distribution by period towards “Modern history”.
Figure 7 about here
Before 1940, the EHR had published as many articles in “Early modern” (53) and
almost as many in “Medieval history” (38) as in “Modern history” (53) and its distribution changed little in 1941-1960. It still published more articles in “Early modern history” (174) than either “Modern history” (103) or “Medieval history” (60). In the same period, the JEH published 214 articles on “Modern history”, three times more than “Medieval history” and “Early modern history” combined (respectively 24 and 48). The strong focus on more recent period in the JEH is hardly surprising, given the overall home bias of the economic historians and the prevalence of Americans among its authors (Section 5). The Cliometric Revolution shifted further the distribution of articles towards modern issues in the JEH (by about ten percentage points) and, somewhat belatedly, in the EHR, up to about a half in the 1970s. The overall prevalence of “Modern history” was sealed by the establishment of EEH, the EREH and CLIO, where articles on “Modern history” accounted respectively for 78 percent,
70 percent and 74 percent of total (plus 5 percent, 8 percent and 10 percent in the long-run which often covers modern period). By definition, the relative rise of “Modern history” reduced the share of articles on “Medieval” and “Early modern history”, but to a different extent. The total number of articles in “Medieval history” remained low but constant around four per year since the 1970s (most of them in the EHR) with a correspondingly low but stable share. In contrast, the decline of “Early modern” issues has been more gradual, and the total number of articles has even increased, from 12 articles per year on average in the 1940s and 1950s (a third of the total) to about 20 (a sixth) after 1997. Since 2007, the share of article in “Early modern history” has risen somewhat in all journals, and it has tripled in the EREH, from 9 to 27 percent (vs. 24 for the EHR in the same years). It is too early to tell whether this recent trend signals a permanent shift in the interests of economic historians.
21
The defining characteristic of the Cliometric Revolution was the combination of economic theory and statistic tools for the interpretation of history. It is not possible, unfortunately, to measure the use of economic theory and thus, as anticipated, we focus on the use of tables, graphs and econometric methods. To be sure, tables and figures are not an exclusive feature of Cliometric articles: the so called histoire serielle was a major current of the Annales school in the 1960s (Chanu 1970). Yet, as pointed out by Wrigley (1999), tables and graphs can be considered a harbinger of the methodological change. Indeed, before 1950, only a quarter of articles had at least one table and almost none a figure. As Figure 8 shows, the proportion of articles with tables has been rising steadily, up to over 90 percent in the 2000s.
Figure 8 about here
Figures may be considered more representative of the Cliometric Revolution, as they include the graphical illustration of economic models, starting from the market equilibria. Yet, their number has risen much more slowly, possibly because drawing good figures was technically challenging before the age of personal computer. As late as the 1980s, only about a quarter of the articles had any figure, and even in most recent years a quarter has no visual help.
The first regression appeared, in 1950, in the JEH in an article (The quantitative study of government activity) by Fabricant (1950), who was part of the National Bureau of
Economic Research (NBER) team directed by Kuznets, and in the EHR 11 years later in an article (Emigration and demographic change in Ireland, 1851-1861) by Cousens (1961). These early regressions were used as an illustrative device rather than to test hypotheses and the results are literally “hidden” in the text rather than reported in tables. The first article to present a proper regression with some coefficients is a reply by Landes (1958) in JEH to a
note by Danière (1958). This is part of an articulated debate on French income and prices in
late XVIII century France originated by two books by Labrousse (1932) and Chabert (1949) harshly criticized by Landes (1950). The first two authors to report the results in the
“modern” style, with an explicit equation, were Fishlow (1961) and Williamson (1962), respectively in articles on trustees banks in the United States in 1817-1861 and on the
22
balance of payments between United Kingdom and United States in 1820-1913, both in the JEH.
The number of articles with econometrics remained very low in the 1960s (a total of 22 articles in 1961-1969, less than 4 percent of the total) and jumped in the early 1970 to around a third (Figure 9). Their share fluctuated between a quarter and a third until the 1990s and then rose further, up to about three quarters.
Figure 9 about here
These aggregate figures conceal substantial difference between journals, arguably greater than for any other feature we have discussed so far, as Figure 10 shows. From one hand, CLIO and, with few exceptions in the 1960s and early 1970s, EEH have always
published mostly econometric articles. The EREH joined the club in 2004, when the share of econometric papers almost doubled, from 42 percent to 81 percent. On the other hand, the diffusion of econometric techniques in the EHR and, somewhat surprisingly, in the JEH has been rather slow and both journals still publish a relevant number of non-econometric papers.10
Figure 10 about here
Economic historians do not use advanced econometric techniques, as defined in Section 3, as often as economists. There were some distinguished pioneers, such as Newell (1973), who used instrumental variable in an article (The Agricultural Revolution in Nineteenth-Century France) published in 1973 in JEH and Rosenbloom and Sundstrom (1999) who computed the first panel regression in an article (The sources of regional variation in the severity of the Great Depression: Evidence from U.S. manufacturing, 1919-1937) published in the JEH in 1999. However, these pioneers found few imitators: the number of articles with
10 Our results for JEH and EEH tally well with results by Margo (2018), who measures the diffusion of
econometric words by using Google Scholar. The results are only partially consistent with those by Wehrheim
(2018), who extracts clusters of words from JEH and label them. In particular, he defines “descriptive language”
a cluster including words related to tables with words such as “annual”, “large”, etc. and “econometric language” another cluster comprising words such as “regression”, “test”, “estimated”, etc. While trends from this latter are not too dissimilar to ours, the “descriptive language” cluster grew during the 1950s and the 1960s and then declined rather than rising smoothly as in Figure 10.
23
advanced econometrics remained negligible until the late 1990s and they are still a minority. The peak was reached in 2014 with 21 articles out of 103 with some econometrics and out of 131 articles overall. The still limited resort to advanced techniques reflects probably data limitations: it is unlikely that scholars trained in modern economics are unaware of the potential of VECM or panel regression for the historical analysis.
As in the case of econometrics, there used to be differences among journals, especially before 2006. Advanced econometric techniques were used in about a tenth of articles in JEH, EEH and EREH, and in no article in the EHR. The difference is less evident in the last decade, when the share of advanced econometric articles in the EHR has risen to 8.6 percent in comparison with values between 10 and 16.4 percent for all other journals (Figure 11).
Figure 11 about here
5. The evolution of economic history: authors
The 6,516 articles have a total of 8,597 authors, many of whom authored more than one paper. Thus, the database lists a total of 3,884 individuals.11 One can compare this figure with the estimate of about 10,700 active economic historians in the world around 2010
(Baten and Muschallik 2012), taking into account the life-cycle of people in the database. One can get an upper bound of active authors in the T5-EH by assuming that economic historians publish the first article at 30 years of age and their last at 72 (after having retired at 70).12 These assumptions yield a total of 2,889 individuals. Even with fairly optimist assumptions, only a quarter of active economic historians have succeeded to publish in their career, at least, once in a T5-EH.
11 This figure may be slightly overstated, as the earlier issues of EHR reported, for some authors, only the
initial of the given name.
12 These assumptions are an upper bound for a number of reasons. First, they imply that all individuals who
published at least one article since 1975 were professional economic historians, and that they have continued to work in the field throughout all their career. This is unlikely. Several authors belonged to other fields
(Weingast, co-author of the most cited paper in the JEH, is a political scientist), others may have changed field
in the meanwhile, or may have left academia, or, sadly, may have passed away. Second, it is more likely than an author publish their first article after, than before, her 30 birthday. Third, the estimate includes authors who have published in recent years but were not active around 2010.
24
Figure 12 shows that economic history has always been and still is a male dominated field, even if slightly less so than economics (dots in the Figure). Women account for 12.2 percent of all authors (1,045 out of 8,597) and for 14.8 percent of individuals (574 out of 3,884). Women were quite well represented in the early years. From 1927 to 1947, 30
different women authored 39 articles (out of 359 in total), with all-time peaks of 3 out of 10 articles in 1930 and 4 out of 13 in 1932. After 1948, the share of female authors dropped dramatically: from that year to 1960, they published only 25 articles out of 604 (4.1 percent) and only 7 out of 275 in the JEH (2.5 percent). The situation did not change much in the early years of the Cliometric Revolution: female authors accounted for 5.1 percent of total authors in 1961-1978, with a share more than double in the more traditional EHR (6.8 percent), than in the hardline cliometric EEH (3.0 percent). Then, the share of female authors rebounded up to almost a fifth in 1994-1996. Since then, it has fluctuated between 10 and 20 percent without a clear trend and in the last five years, has been on the low side (14.9 percent), exceeding a fifth only in the women-friendly EHR.
Figure 12 about here
Before 1970, co-authored papers were quite exceptional, around one out of twenty (Figure 13). Their share increased to a sixth in the 1970s and 1980s, to a third in the 1990s, eventually exceeding a half of the articles since 2010. Thus, economic historians have
followed, with a substantial lag, the path of economists, where co-authored papers exceeded a half already in 1993 (Hamermesh 2013, table 2). Indeed, Selzer and Hamermesh (2018) suggest that the rise in co-authorship in economic history reflects the push in economics departments towards more publications without penalties for co-authorship. Moreover, collaborations in economic history have been and, to some extent, still are quite limited undertakings in comparison not only with sciences but also with economics.
Figure 13 about here
Most co-authored articles are the work by two individuals only (Table 9). The first article (The nature and the profitability of the Liverpool slave trade) with three authors was
25
published, in 1953, in EHR (Hyde, Parkinson and Marriner 1953) and the first (Real inequality in Europe since 1500) with four ones in the JEH in 2002 (Hoffman et al 2002), when articles with more than three authors exceeded a tenth of the total for the first time. There are only three articles with five authors, two in 2011 (Allen et al 2011, Breschi et al 2011) and the third two years later (Boppart et al 2013). Economic history lags clearly behind economics from this point of view (Hamermesh 2013: table 2): in 2011 all co-authored articles accounted for 79.1 percent of the total of the T5-E (vs. 55.1 percent in T5-EH) and articles with three authors or more for 38.5 percent (vs. 17.9 percent). This overall increase has coincided with the rise of cross-gender collaborations, from only 8 articles (out of 64 written by at least one woman) in the first two periods, to 288 in 1997-2017 (over a half). In the last three years, these cross-gender collaborations accounted for two thirds of all articles authored by women and for 18 percent of all articles.
Table 9 about here
Until very recently, very few articles were co-authored by individuals affiliated to universities in different countries (Figure 14). The share of these transnational collaborations remained very low, around 15 percent of co-authored articles (and thus less than 2 percent of all articles) until the late 1970s. Thereafter the share rose slowly but steadily, up to a third and beyond, corresponding to a sixth of all articles in the database, after 1997. Articles from the last period account for two thirds of all transnational co-operations. These trends
affected all journals, but to a different extent. In 1997-2017, co-authored articles accounted for over a half of the total in the EEH (and internationally co-authored ones for 18 percent) but only for a third (13 percent) in the EHR.
Figure 14 about here
We measure the influence of each country with the number of authors affiliated to each of its institutions at the time of the publication of the article. We do not take into
consideration the nationality of the author, nor her affiliation before or after the publication of the article. Moreover, we use fractional counting in order to avoid distortions from the rise
26
in co-authorship. We assign to each author (and thus to her institution and, ultimately, to country) the inverse of the number of authors of the article (0.5 if there are two authors, 0.33 if there are three and so on). We distinguish fractionally weighted articles from unweighted ones by using the word “contribution” instead of “article”.
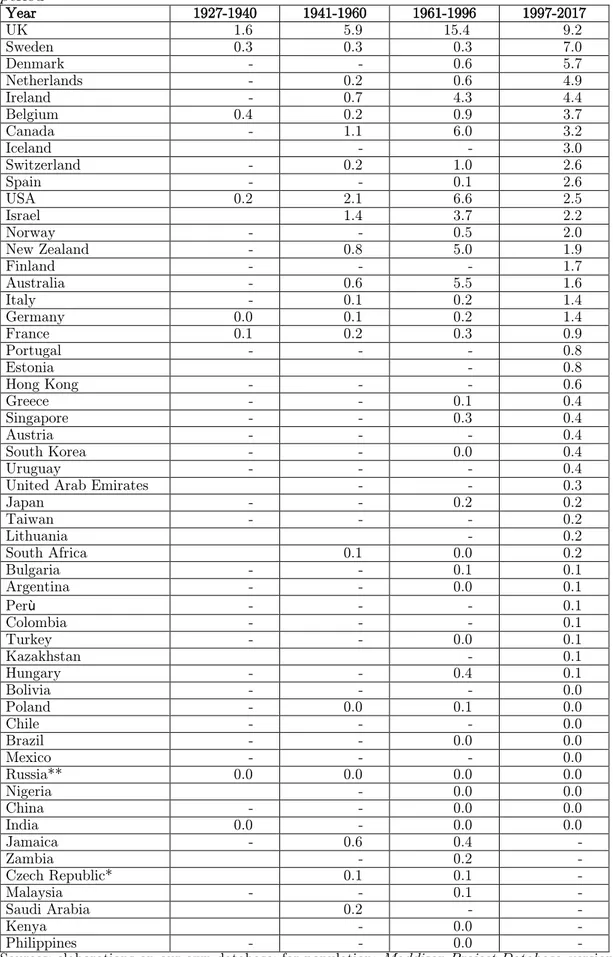
The database lists 870 institutions of higher education (universities and colleges) and 201 other affiliations, from New York Citibank to Dorset History Center, from 55 countries for a total of 1,071 institutions.13 However, a handful of universities produced most of the output in economic history: sixteen of them accounted for a quarter of all contributions from 1927 onwards, 61 for a half and 178 for three quarters. Until the late 1980s, almost all these institutions (95.1 percent) were located in Anglo-Saxon countries (Table 10a and Figures 15 and 16). The United States, which until 1990 accounted for over a half (54.9 percent) of contributions, the United Kingdom for a third (32.4) Canada for a twentieth (4.7 percent) and Ireland (after 1921), Australia, and New Zealand for the rest. The ranking appears quite different if total contribution is adjusted for the size of countries (Table 10b): British
universities produced 7 contributions per million inhabitants, about a double than American ones.14 The whole Continental Europe produced less than Canada (108 contributions vs. 159) and no country exceeded 1 percent of total contributions (the most productive one being France with 25 articles or 0.7 percent). The scientific production of the rest of the world was negligible, with the exceptions of Japan and, above all Israel. Eleven authors from Israeli universities produced a total of 17.5 contributions, pushing the country to the fourth place in the population-adjusted ranking, after United Kingdom, United States and Canada. The dominance of Anglo-Saxon authors reflects largely our selection of journals, jointly with the home bias in the choice of outlet for publication. British authors accounted for 70.7 percent of the articles of the EHR, Americans for 77.9 percent of the EEH and 84.3 percent of the JEH. Furthermore, it is likely that also authors from non-Anglo-Saxon universities had links to the Anglo-Saxon world, via their nationality and/or PhD. For instance, John Komlos, one
13 This estimate refers to the number of different polities along the entire period. Thus, for example, we
consider Czechoslovakia from the 1927 to 1992 and then, since 1993 to nowadays, we consider Slovakia and Czech Republic as separate countries.
27
of the most prolific authors in our database, was born in Budapest, got his PhD in Chicago and taught in Munich for many years. In those years, Continental Europeans seldom
published in Anglo-Saxon journals because they had their own journals.
Figures 15 and 16 and Table 10a-b about here
The situation changed rather suddenly around 1990. The share of Continental Europeans started to rise in the early years of the decade, jumped to about a sixth of all contributions after 1997 and continued to grow up to 38.3 percent in the last five years. Correspondingly, the share of contributions from Anglo-Saxon declined down to 54.3 percent. The jump after 1997 coincides with the establishment of the EREH, which published mostly articles from European authors (59.3 percent) and the share was further augmented, ten years later, by the start of publication of CLIO, another prevalently European journal (55.2 percent). However, the availability of the European journals does not explain fully the success of European authors. From one hand, they did not dominate these two journals as the American and the British had done before 1990. From the other hand, Continental Europeans succeeded to publish more and more contribution in the Anglo-Saxons journals. In 2013-2017, they contributed to a quarter of the total articles published in JEH and EEH and to one third for the EHR. Actually, in the last five years, the main outlet for articles by Continental Europeans has been the EHR, ahead of EREH (28.6 percent of contributions vs. 26.8 percent) and the two American journals has published almost as many contributions from Europeans as CLIO (15.0 percent JEH and 14.0 percent EEH vs. 15.5 percent). The performance of Continental European countries, already relatively quite good in the period 1997-2017, appears outstanding in the last five years (2013-2017). They occupied all the first 10 positions in the ranking by population, but two (United Kingdom and Ireland). The top performer, Sweden, has about 50 percent more contributions than the second, the United Kingdom, and six times more than the United States. As said in Section 4, the rise of
Continental Europeans was not helped neither by a shift in topics nor by a reduction in their home bias since few articles by Europeans dealt with English or American economic history. Thus, one would explain the trend with the institutional change. The growing relevance of
28
publications in top international journals for promotion and funding in European universities pushed scholars to submit research on their own country in American and British journals, just when similar forces pushed American scholars to publish in economic journals (Section 7).
In contrast, little changed since 1997 in the contributions of scholars from non-European and non-Anglo-Saxon countries. They accounted for 4.6 percent of total contributions in the whole period 1990-2017 and for 7.4 percent in 2013-2017. Japan
maintained its position, Israel slipped somewhat relative to its ranking before 1990 and the four Asiatic tigers (Hong-Kong, Singapore, Taiwan and South Korea) entered in the ranking. The contribution of less developed countries, including large countries such as India and China, remained very small if not negligible: in 1990-2017 authors from Indian and
(mainland) Chinese universities published a total of 10.1 contributions, slightly more than Finland. Thus, the distribution by country of contributions in T5-EH differed widely from the tentative estimates by Baten and Muschallik (2012) on the number of economic
historians. They reckon that 17 percent of economic historians are working in Japan (1.1 percent of all contributions from 1997 to 2017) and 43 percent in other non-Western countries (4.4 percent).
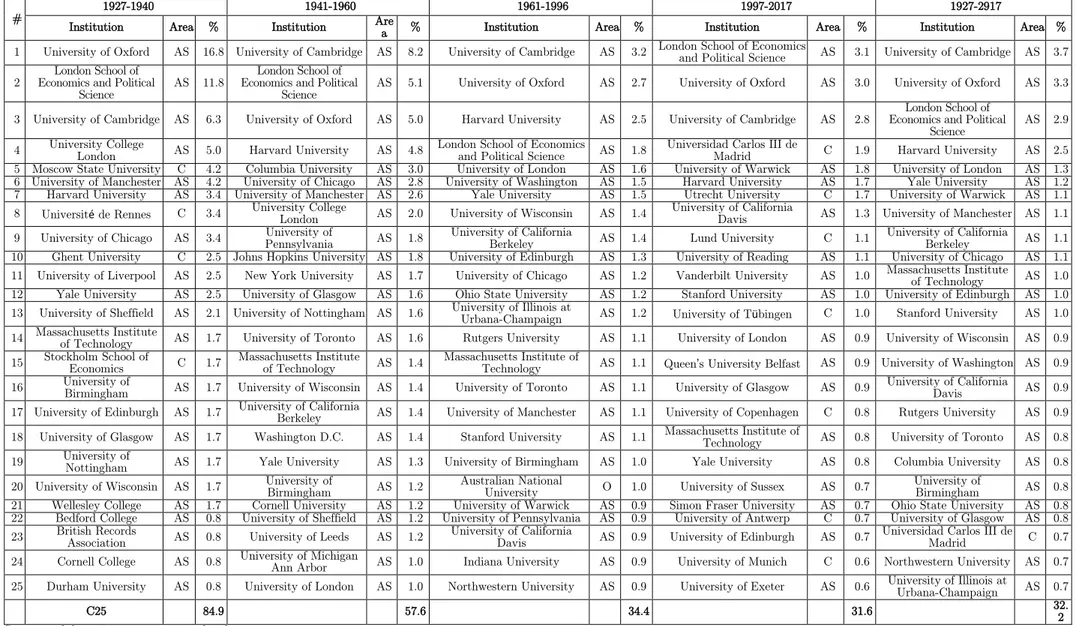
The early dominance of Anglo-Saxon countries and the recent success of Continental European ones appears clearly also from the list of the top 25 institutions (Table 11). The University of Oxford, the London School of Economics (LSE) and the University of
Cambridge held the three top spots overall and in each period, but for the third place of Harvard University during the Cliometric Revolution. Four Continental European
universities, including Moscow State University, appear in the list in the first period, but they disappear in the second and third. In contrast, in 1997-2017, Universidad Carlos III de Madrid, Utrecht University and Lund University are respectively fourth, sixth and eight and four other universities (Tubingen, Copenhagen, Antwerp and Munich) are in the list of the top twenty-five institutions. The rise has continued to present: in the last five years the number of Continental European universities has risen to eleven, with a cumulated share higher than the British one (14.6 percent vs. 14 percent). In contrast, and somewhat
29
surprisingly, few American universities appear in the top 25 in recent years. The best placed one, Harvard University, is fourth in the all-time ranking 1927-2017 and has slipped to the ninth position in 2013-2017. Major institutions, such as Stanford University, University of Chicago, University of California Berkeley, Yale University, and Massachusetts Institute of Technology (MIT) hardly make the top ten in the ranking and many of them are altogether missing in some periods. Other universities appear in quite high positions in specific periods, such as the University of Washington and the University of Wisconsin in 1961-1996
(respectively sixth and eighth) or the University of California Davis (eighth in 1997-2017), when they employed some prominent economic historians.
Table 11 about here
The combination of the high country share and comparatively low shares of top universities clearly reflects the large number of American institutions. Indeed, in the 1940s the Herfindhal-Hirschman index of concentration of contributions was about a third the British one (Figure 17a-b).15 It declined sharply during the Cliometric Revolution (Whaples 1991), when the popularity of (by then) “new” economic history stimulated departments of economics all over the country to hire prominent young scholars and remained pretty stable thereafter. The British pattern differed somewhat. The decline from the high initial level continued until the 1970s, but the concentration rebounded in the XXI century. In 2013-2017, the top three universities (Oxford, Cambridge and LSE) produced 45 percent of all contributions from the United Kingdom, corresponding to almost a tenth of the world total. The worldwide concentration by institutions (Figure 17c) was quite high before WWII, when the number of articles was low.
Figure 17a-c about here
Unsurprisingly, given the size of the country, trends in worldwide concentration are quite similar to American ones, with sharp decline in the 1960s and stagnation to present. In
15 We compute concentration with Herfindhal indexes on ten-year rolling windows (i.e. 1931 is compute with
data 1927-1936). The statement refers to the average 1945-2012, excluding the first period, when American
30
all likelihood, the success of Continental European universities compensated the growing concentration in the United Kingdom.
6. Measuring the impact of economic history articles with citations
The citations count has become the standard gauge to measure the impact of research first in scientific fields and, more recently, in social science and economics (Card and Della Vigna 2013, Hamermesh 2018). In Section 2, we have used total citations to assess the influence of different journals. Here we shift our attention to articles in the T5-EH, using, as explained in Section 3, the number of citations according to Scopus.16. In this case, we have the number of citations received yearly since 1970 for almost all articles of the database and not only the total number of citations by journals.17 The raw average number is for this reason a flawed measure of the impact of recent articles and thus in Figure 18 we compare the average number of citations received by each yearly cohort of articles at three different time horizons – i.e. 2, 5 and 10 years after publication.
Figure 18 about here
Articles from the last cohort (respectively 2015, 2012 and 2007) for the three time horizons have been cited around eight times more frequently than articles published in the 1970s. The absolute number jumps, for the ten years horizon, from 2.3 for the 1970 cohort to 18.8 for the 2007 one. The increase reflects both the growth in the number of journals
included in Scopus and the “citation inflation”, that is the increase of the number of
references per article included in the more recent articles which has been documented in scientific fields (Neff and Olden 2010) and in economics too (Anauati, Galiani and Galvez 2016).
Figure 18 by construction omits all citations received after the tenth year since
publication, which account for 78 percent of the total received for the article published up to
16 For a more detailed discussion of this issue, including an econometric analysis of citation success, see Cioni,
Federico and Vasta (2019).