Outcome of fetal ovarian cysts diagnosed on prenatal
ultrasound examination: systematic review and meta-analysis
F. BASCIETTO
1, M. LIBERATI
1, L. MARRONE
1, A. KHALIL
2, G. PAGANI
3, S. GUSTAPANE
1,
M. LEOMBRONI
1, D. BUCA
1, M. E. FLACCO
4, G. RIZZO
5, G. ACHARYA
6,7, L. MANZOLI
4and
F. D’ANTONIO
6,71Department of Obstetrics and Gynaecology, SS. Annunziata Hospital, G. D’Annunzio University of Chieti-Pescara, Chieti, Italy;2Fetal Medicine Unit, St George’s University of London and St George’s University Hospitals NHS Foundation Trust, Molecular and Clinical Sciences Research Institute, London, UK;3Department of Obstetrics and Gynaecology, Fondazione Poliambulanza, Brescia, Italy; 4Department of Medicine and Aging Sciences, University of Chieti-Pescara, Chieti, Italy;5Department of Obstetrics and Gynaecology, University of Rome, Rome, Italy;6Women’s Health and Perinatology Research Group, Department of Clinical Medicine, Faculty of Health Sciences, UiT – The Arctic University of Norway, Tromsø, Norway;7Department of Obstetrics and Gynaecology, University Hospital of Northern Norway, Tromsø, Norway
K E Y W O R D S: fetal ovarian torsion; outcome; ovarian cysts; ultrasound
ABSTRACT
Objective To explore the outcome of fetuses with a
prenatal diagnosis of ovarian cyst.
Methods The electronic databases MEDLINE and
EMBASE were searched using keywords and word vari-ants for ‘ovarian cysts’, ‘ultrasound’ and ‘outcome’. The following outcomes in fetuses with a prenatal diagnosis of ovarian cyst were explored: resolution of the cyst, change of ultrasound pattern of the cyst, occurrence of ovarian torsion and intracystic hemorrhage, need for postnatal surgery, need for oophorectomy, accuracy of prenatal ultrasound examination in correctly identifying ovarian cyst, type of ovarian cyst at histopathological analysis and intrauterine treatment. Meta-analyses using individual data random-effects logistic regression and meta-analyses of proportions were performed. Quality assessment of the included studies was performed using the Newcastle–Ottawa Scale.
Results Thirty-four studies (954 fetuses) were included.
In 53.8% (95% CI, 46.0–61.5%) of cases for which resolution of the cyst was evaluated (784 fetuses), the cyst regressed either during pregnancy or after birth. The likelihood of resolution was significantly lower in complex vs simple cysts (odds ratio (OR), 0.15 (95% CI, 0.10–0.23)) and in cysts measuring≥ 40 mm vs < 40 mm (OR, 0.03 (95% CI, 0.01–0.06)). Change in ultrasound pattern of the cyst was associated with an increased risk of ovarian loss (surgical removal or autoamputation) (pooled proportion, 57.7% (95% CI, 42.9–71.8%)). The risk of ovarian torsion was significantly higher for
Correspondence to: Prof. F. D’Antonio, Women’s Health and Perinatology Research Group, Department of Clinical Medicine, Faculty of Health Sciences, UiT – The Arctic University of Norway, Hansine Hansens veg 18, 9019 Tromsø, Norway (e-mail: [email protected]) Accepted: 10 June 2016
cysts measuring≥ 40 mm compared with < 40 mm (OR, 30.8 (95% CI, 8.6–110.0)). The likelihood of having postnatal surgery was higher in patients with cysts
≥ 40 mm compared with < 40 mm (OR, 64.4 (95% CI,
23.6–175.0)) and in complex compared with simple cysts, irrespective of cyst size (OR, 14.6 (95% CI, 8.5–24.8)). In cases undergoing prenatal aspiration of the cyst, rate of recurrence was 37.9% (95% CI, 14.8–64.3%), ovarian torsion and intracystic hemorrhage were diagnosed after birth in 10.8% (95% CI, 4.4–19.7%) and 12.8% (95% CI, 3.8–26.0%), respectively, and 21.8% (95% CI, 0.9–40.0%) had surgery after birth.
Conclusion Size and ultrasound appearance are the major
determinants of perinatal outcome in fetuses with ovarian cysts. Copyright © 2016 ISUOG. Published by John Wiley & Sons Ltd.
INTRODUCTION
Ovarian cysts are the most common abdominal anoma-lies diagnosed in female fetuses, with an estimated incidence of about 1 in 2600 pregnancies1. Although the pathophysiology of ovarian cysts has not yet been elucidated fully, they are usually a benign functional anomaly resulting from excessive stimulation of the fetal ovaries by placental and maternal hormones. They are common in pregnancies complicated by maternal dia-betes, pre-eclampsia or rhesus isoimmunization. They are diagnosed most often during the third trimester, especially after 28 weeks’ gestation1,2. Ovarian cysts are categorized according to their sonographic appearance
into the following two groups: (1) simple cysts, which are usually anechoic, round, unilocular and thin walled, mea-suring > 2 cm, and (2) complex cysts, which are usually thick walled and heterogeneous, containing hyperechoic components, free-floating material or intracystic septa-tions, and are commonly considered the result of ovarian torsion or intracystic hemorrhage3.
Optimal management of fetal ovarian cysts is unclear and the evolution of this anomaly is variable. Although the majority regress either during pregnancy or after birth, torsion and hemorrhage can occur antenatally, thus increasing the risk of surgical intervention and ovarian loss after birth. Prenatal aspiration of the cyst is performed occasionally, especially in the case of large lesions, in order to prevent intrauterine torsion, which may lead to ovarian autoamputation or the need for oophorectomy. However, whether this improves neonatal outcome in these fetuses is yet to be established. Furthermore, the accuracy of antenatal ultrasound examination in correctly identifying fetal ovarian cysts is unknown. Gastrointestinal, renal and genital anomalies are commonly misdiagnosed as ovarian cysts2. It is yet to be ascertained whether the ultrasound appearance of the cyst can predict the postnatal outcome or be used to guide prenatal management in these cases.
The aim of this systematic review was to explore the outcome of fetuses with prenatally diagnosed ovarian cysts and to quantify the accuracy of antenatal ultrasound examination in correctly identifying these anomalies. SUBJECTS AND METHODS
Protocol, eligibility criteria, information sources and search
This review was performed according to an a-priori protocol recommended for systematic reviews and meta-analyses4. The electronic databases MEDLINE and EMBASE were searched on 11 February 2016 utilizing combinations of relevant medical subject heading terms, keywords and word variants for ‘ovarian cysts’, ‘ultra-sound’ and ‘outcome’ (Table S1). The search and selection criteria were restricted to the English language. Reference lists of relevant articles and reviews were hand-searched for additional reports. PRISMA guidelines were followed5. The study was registered with the PROSPERO database (registration no. CRD42016035594).
Study selection, data collection and data items
Two authors (F.B. and L.Mar.) independently reviewed all abstracts. Agreement regarding their potential relevance was reached by consensus; full-text copies of eligible papers were obtained and the same two authors independently extracted relevant data regarding study characteristics and pregnancy outcome. Inconsistencies were discussed by the two authors and a consensus reached or discussed with a third author. If more than one study was published for the same cohort with identical endpoints, the report containing the most comprehensive
information on the population was included to avoid overlapping populations. For those articles in which information was not reported but the methodology was such that this information would have been recorded initially, the authors were contacted. Only full-text articles were considered eligible for the inclusion. Case reports, conference abstracts and case series with fewer than three cases of suspected ovarian cyst, irrespective of whether or not the anomaly was isolated, were also excluded in order to avoid publication bias.
Quality assessment of the included studies was performed using the Newcastle–Ottawa Scale (NOS). According to the NOS, each study is judged on three broad perspectives: selection of the study groups, comparability of the groups and ascertainment of the outcome of interest6. Assessment of the selection of a study includes evaluation of the representativeness of the exposed cohort, selection of the non-exposed cohort, ascertainment of exposure and demonstration that the outcome of interest was not present at the start of the study. Assessment of the comparability of the study includes evaluation of the comparability of cohorts on the basis of the design or analysis. Finally, ascertainment of the outcome of interest includes evaluation of the type of assessment of the outcome of interest, and length and adequacy of follow-up6. According to the NOS, a study can be awarded a maximum of one star for each numbered item within the Selection and Outcome categories and a maximum of two stars can be given for Comparability.
The incidence of the following outcomes was analyzed in fetuses with a prenatal diagnosis of an ovarian cyst: resolution of the cyst in utero or after birth; change of ultrasound pattern from simple to complex cyst; occur-rence of ovarian torsion and intracystic hemorrhage; need for postnatal surgery; ovarian loss due to oophorectomy or salpingo-oophorectomy; false-positive rate of prenatal ultrasound diagnosis; histopathological type of ovarian cyst; and intrauterine treatment. Cases undergoing prena-tal intervention (cyst aspiration) were evaluated separately in terms of: resolution of the cyst, recurrence of the cyst, increase in cyst size after aspiration, change of ultrasound pattern after intervention, evidence of torsion or hem-orrhage after intervention or at birth, need for surgery and preterm delivery or miscarriage due to the invasive procedure.
All of these outcomes were assessed in the overall population of fetuses with a prenatal diagnosis of an ovarian cyst. Furthermore, a subanalysis according to the appearance (simple vs complex) and size (< 40 mm
vs≥ 40 mm) of the cyst was carried out. Cyst size of 40 mm was used as the cut-off as this has been commonly reported in the literature to represent the highest centile of cyst size.
For ascertainment of data on resolution and change in ultrasound appearance of the cyst, the anomalies were categorized according to their first ultrasound appearance and size, and the prevalence and risks of torsion, hemorrhage, surgery and need for oophorectomy were
ascertained from the postnatal ultrasound examination or, if not available, the last scan in pregnancy.
Cases that underwent cyst aspiration in utero were analyzed separately and were not included in the main analyses. Preterm delivery or miscarriage was considered to be caused by fetal therapy if it occurred within 15 days of the intervention.
Only studies reporting a prenatal diagnosis of ovarian cyst were considered suitable for inclusion in the current systematic review. Postnatal studies or studies from which cases diagnosed prenatally could not be extracted were excluded. Pediatric and surgical series including only symptomatic cases or patients undergoing surgical treatment were also excluded. Studies published before the year 2000 were not included, as we considered that the advances in prenatal imaging techniques and the improvements in diagnosis and definition of fetal anomalies made these studies less relevant. Finally, studies not providing clear classification of the anomaly were not considered suitable for inclusion in the current review.
Statistical analysis
The strength of association between ultrasound character-istics of the cyst and each observed outcome was explored. For quantification of the incidence of these outcomes, meta-analyses of proportions using a random-effects model were used to combine data. Funnel plots display-ing the outcome rate from individual studies vs their precision (1/standard error) were carried out with an exploratory aim (data not shown). Tests for funnel-plot asymmetry were not used when the total number of pub-lications included for each outcome was less than 10. In this case, the power of the test is too low to dis-tinguish chance from real asymmetry7–10. Between-study heterogeneity was explored using the I2 statistic, which represents the percentage of between-study variation that is due to heterogeneity rather than chance10.
Furthermore, we evaluated separately the association between ovarian cyst type (complex or simple) and size (≥ 40 mm or < 40 mm) and six clinical outcomes (change of ultrasound pattern (simple cysts becoming complex), cyst resolution, torsion, hemorrhage, postnatal surgery, ovarian loss or oophorectomy). We stratified the meta-analyses, exploring combinations of cyst type and size, thus performing a total of eight direct comparisons for each of the outcomes (excluding change of ultrasound pattern): (1) complex vs simple cysts, (2) all cysts≥ 40 mm
vs < 40 mm, (3) simple cysts ≥ 40 mm vs < 40 mm,
(4) complex cysts≥ 40 mm vs < 40 mm, (5) complex cysts ≥ 40 mm vs simple cysts ≥ 40 mm, (6) complex cysts
<40 mm vs simple cysts ≥ 40 mm, (7) complex cysts ≥ 40 mm vs simple cysts < 40 mm and (8) complex cysts
<40 mm vs simple cysts < 40 mm.
We included observational cohort studies in which: (1) many comparisons reported zero events in one group, (2) several comparisons reported zero events in both groups and (3) exposed and unexposed group sizes were
frequently severely unbalanced. In such cases, many of the most commonly used meta-analytical methods, including those using risk difference (which could be used to handle total zero-event studies), can produce biased estimates when events are rare11,12. When many studies are also substantially unbalanced, the best performing methods are the Mantel–Haenszel odds ratio (OR) without zero-cell continuity corrections, logistic regression and an exact method13,14. Mantel–Haenszel ORs cannot be computed in studies reporting zero events in both groups, the exclusion of which may, however, cause a relevant loss of information and the potential inflation of the magnitude of the pooled exposure effect11. Therefore, to keep all studies in the analyses, we performed all meta-analyses using individual data random-effects logistic regression, with single study as the cluster unit. The pooled datasets with individual data were reconstructed using published 2× 2 tables. When one of the overall pooled arms showed no event, we used exact logistic regression.
As a likely consequence of non-randomization, dissim-ilarity of the populations and lack of fixed criteria for when to treat, several of the comparisons showed an extreme imbalance in the success rate between the groups being compared (e.g. 44/67 vs 0/69). In addition to the computational issues, in such cases the ORs may be of lim-ited interest and sensitivity, and specificity may be more informative. We thus computed the overall sensitivity and specificity (and related 95% CI) for each compari-son according to the efficient-score method (corrected for continuity) described by Newcombe14.
All analyses were performed using Stata version 13.1 (2013; Stata Corp., College Station, TX, USA).
RESULTS
Study selection and characteristics
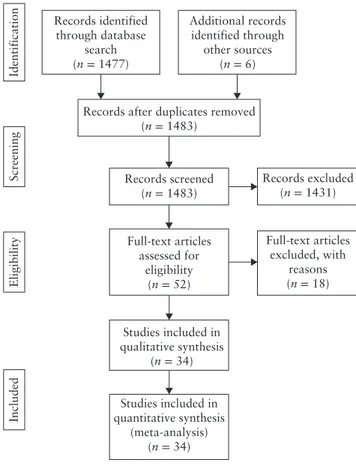
A total of 1483 articles were identified, of which 52 were assessed for eligibility for study inclusion (Table S2). Thirty-four studies including a total of 954 fetuses with a prenatal diagnosis of ovarian cysts were included in the systematic review (Table 1 and Figure 1)15–48.
Quality assessment of the included studies was performed using the NOS for cohort studies (Table 2). Most of the included studies showed an overall good quality with regard to selection and comparability of the study groups and ascertainment of the outcomes of interest. The main weaknesses of the studies were their retrospective design, small sample size and lack of detailed ultrasound characteristics of the cysts in some of the included studies.
Synthesis of results
Resolution of the cyst
Twenty-nine studies including 784 fetuses with a prenatal diagnosis of ovarian cyst evaluated resolution of the cyst.
Table 1 Characteristics of studies on fetuses with prenatally diagnosed ovarian cysts included in systematic review
Imaging technique
Study Country
Study
design Prenatal Postnatal Fetuses (n) GA at diagnosis (weeks)* Cyst diameter (mm)* Age at surgery* Age at follow-up*
Catania (2016)15 Italy Retro US US, MRI 25 33 (22 to 39) NS NS 5 y
Thakkar (2015)16 UK Retro US US 34 NS NS NS NS
Nakamura (2015)17 Japan Retro US US 33 32 (22 to 37) 47 (17–79) NS NS
Marchitelli (2015)18
France Retro US US, MRI 17 NS NS NS NS
Ac¸ıkg ¨oz (2015)19 Turkey Retro US US, MRI 17 30± 6.4 39.8± 13.4 NS NS
Jwa (2015)20 Japan Retro US, MRI US 21 33.9 (29.9 to 36.9)
37 (15–52) 1 day to 4 mo NS
Papic (2014)21 UK Retro US US 25 NS 55.1 (24–150) 12 (3–64) wk NS
Karakus¸ (2014)22 Turkey Retro US US 37 33.1± 3.2 41.5 (10–60) NS 3 mo
Turgal (2013)23 Turkey Retro US US 29 28.4 (23 to 37) 40.9 (11–90) 2–4 mo 2–9 mo
Amari (2013)24 Germany Retro US NS 35 32+ 0 (14 + 6 to 39+ 2)
NS NS NS
Dimitraki (2012)25 Greece Retro US US 16 32.4 (30 to 37) 37.7 (21–74) 1 mo 3–12 mo
Gaspari (2012)26 France Retro US US 5 >32 52.4 (40–60) 1–3 mo 4.14
(1.5–6.7) y Lecarpentier
(2012)27
France Retro US NS 26 NS NS NS NS
Nemec (2012)28 Austria Retro US, MRI US 16 31+ 2 (23 + 0 to 35+ 5)
NS NS NS
Noia (2012)29 Italy Retro US US 13 32 (27 to 36) 46 (31–74) NS 2 mo to 3 y
Aqrabawi (2011)30 Jordan Retro US US 12 NS 30–100 NS 1 mo to 6 y
Akin (2010)31 Turkey Retro US US 18 34 (32 to 38) 53.0 (25–80) 1–23 days NS
Eleftheriades (2010)32
Greece Retro US US 7 32 (31+ 1 to
32+ 4)
37 (27–61) NS NS
Ben-Ami (2010)33 Israel Retro US US 21 33 (28 to 37) 42.4 (10–60) 44.2 (1–115) days
6.6 (1.3–11.6) y
Zampieri (2008)34 Italy Retro US US, MRI 57 34 (32 to 37) 50.0 (27–75) NS 1–5 y
Godinho (2008)35 Portugal Retro US US 5 31+ 6 (29 to 35)
38.3 (29–60) 10–11 days NS Shimada (2008)36 Japan Retro US US 16 Third trimester 46.6 (23–75) Within 10 mo 2 mo Monnery-Noch´e
(2008)37
France Retro US US 65 33 (24 to 39) 43.5 (17–130) 3 (0–119) days 3 mo (11 days to 6 y)
Galinier (2008)38 France Retro US US 79 32 (26 to 39) 43.5 (20–90) NS 11 mo
(6 mo to 10 y) Kwak (2006)39 South Korea Retro US US 17 34 (30 to 38) 49 (33–78) 1 day to 3 wk 1–24 mo Foley (2005)40 Australia Retro US US 11 Second to third
trimester
39.6 (7–70) 7–8 mo 12.9 mo
(3 mo to 6 y)
Enr´ıquez (2005)41 Spain Retro US, MRI US, MRI 18 33 to 37 24–112 NS 3–15 mo
Comparetto (2005)42
Italy Retro US US 32 34 (32 to 37) 27–75 NS 1–5 y
Quarello (2003)43 France Retro US US 12 31 NS NS NS
Mittermayer (2003)44
Germany Retro US US 61 32 (24 to 38) 42± 12 2 h to 6 wk 7 days to 12 mo Heling (2002)45 Germany Retro US US 64 35 (26 to 40) 32 (17.5–55.0) 1–14 days NS
Bagolan (2002)46 Italy Prosp US US 80 33.6 (23 to 39) 39 (23–85) NS NS
Perrotin (2000)47 France Retro US US 3 31 (29 to 32) 31 (16–44) No surgery 2–4 wk Luzzatto (2000)48 Italy Retro US US 27 33 (28 to 36) 43.3 (24–77) 0–17 mo 3 mo to 9 y Only first author of each study is given. *Median (range), range, mean or mean± SD. GA, gestational age; mo, months; MRI, magnetic resonance imaging; NS, not stated; Prosp, prospective; Retro, retrospective; US, ultrasound; wk, weeks; y, years.
About half of all cysts resolved during pregnancy or after birth (pooled proportion (PP), 53.8% (95% CI, 46.0–61.5%)) (Figure 2a). Resolution of the cyst occurred in 69.4% (95% CI, 59.0–79.0%) of simple cysts and in 84.8% (95% CI, 70.0–95.2%) of cysts measuring < 40 mm. The proportions of cases with resolution of the cyst according to size and ultrasound appearance are reported in Table S3. Complex cysts (OR, 0.15 (95% CI, 0.10–0.23)) and cysts measuring≥ 40 mm (OR, 0.03 (95% CI, 0.01–0.06)) were less likely to regress than simple cysts or cysts measuring < 40 mm, respectively (Table 3).
Change of ultrasound pattern, ovarian torsion and intracystic hemorrhage
More than 20% (PP, 23.6% (95% CI, 14.4–34.4%)) of all simple cysts demonstrated a change in ultrasound pattern to that of a complex cyst during pregnancy or at birth (Figure 2b). The risk of change in ultrasound pattern during pregnancy was significantly higher in cysts≥ 40 mm compared with those < 40 mm (OR, 3.16 (95% CI, 1.02–9.7); I2, 0%). In those cases, the occurrence of ovarian loss, either due to surgical removal or ovarian autoamputation, was high (PP, 57.7% (95% CI, 42.9–71.8%); I2, 7.1%).
Records identified through database search (n = 1477) Additional records identified through other sources (n = 6) Records excluded (n = 1431) Full-text articles excluded, with reasons (n = 18) Records after duplicates removed
(n = 1483) Identification Screening Eligibility Included Records screened (n = 1483) Full-text articles assessed for eligibility (n = 52) Studies included in qualitative synthesis (n = 34) Studies included in quantitative synthesis (meta-analysis) (n = 34)
Figure 1 Flowchart of inclusion of studies in systematic review.
The overall incidence of ovarian torsion of the cyst was 21.8% (95% CI, 15.2–29.2%) (Figure 2c). The corresponding values for torsion in simple and complex cysts were 6.0% (95% CI, 3.6–8.9%) and 44.9% (95% CI, 31.7–58.4%), respectively (Table S4). The risk of ovarian torsion was significantly higher in cysts≥ 40 mm compared with those < 40 mm, irrespective of their ultrasound appearance (OR, 30.8 (95% CI, 8.6–110.0)) (Table 4). Furthermore, risk of torsion was significantly higher for complex cysts than for simple cysts (OR, 59.1 (95% CI, 24.7–141.0)).
Intracystic hemorrhage occurred in 6.8% (95% CI, 3.7–10.8%) of cases (Figure 2d, Table S5). The risk of hemorrhage was significantly higher for complex vs sim-ple cysts (OR, 28.6 (95% CI, 4.9–∞)), for cysts ≥ 40 mm
vs < 40 mm (OR, 31.7 (95% CI, 3.7–270.0)) and for
simple cysts ≥ 40 mm vs < 40 mm (OR, 63.4 (95% CI, 10.7–∞)) (Table 5).
Surgery
Thirty studies including 761 fetuses with a prenatal diag-nosis of ovarian cyst explored the incidence of postnatal surgery. Overall, 39.5% (95% CI, 30.1–49.3%) of fetuses with a prenatal diagnosis of ovarian cysts confirmed at birth had surgical intervention (Figure 2e). The cor-responding values in fetuses with simple and complex ovarian cysts were 24.6% (95% CI, 14.2–36.9%) and 64.8% (95% CI, 52.2–76.3%), respectively (Table S6).
Table 2 Quality assessment of studies in systematic review
according to Newcastle–Ottawa Scale
Author Selection Outcome Comparability Catania (2016)15 Thakkar (2015)16 Nakamura (2015)17 Marchitelli (2015)18 Ac¸ıkg ¨oz (2015)19 Jwa (2015)20 Papic (2014)21 Karakus¸ (2014)22 Turgal (2013)23 Amari (2013)24 Dimitraki (2012)25 Gaspari (2012)26 Lecarpentier (2012)27 Nemec (2012)28 Noia (2012)29 Aqrabawi (2011)30 Akin (2010)31 Eleftheriades (2010)32 Ben-Ami (2010)33 Zampieri (2008)34 Godinho (2008)35 Shimada (2008)36 Monnery-Noch´e (2008)37 Galinier (2008)38 Kwak (2006)39 Foley (2005)40 Enr´ıquez (2005)41 Comparetto (2005)42 Quarello (2003)43 Mittermayer (2003)44 Heling (2002)45 Bagolan (2002)46 Perrotin (2000)47 Luzzatto (2000)48
Only first author of each study is given. A study can be awarded a maximum of one star for each numbered item within Selection and Outcome categories and a maximum of two stars for
Comparability.
The likelihood of having surgery was higher in patients with cysts≥ 40 mm compared with < 40 mm (OR, 64.4 (95% CI, 23.6–175.0)) and in complex cysts compared with simple cysts, irrespective of the cyst size (OR, 14.6 (95% CI, 8.5–24.8)) (Table 6).
Ovarian loss, due to oophorectomy or salpingo-oophor-ectomy, occurred in 25.1% (95% CI, 17.2–34.0%) of cases that underwent surgery (Figure 2f, Table S7). Both complex cysts (OR, 35.1 (95% CI, 17.0–72.7)) and cysts≥ 40 mm (OR, 58.9 (95% CI, 19.2–181.0)) were significantly associated with an increased risk of ovarian loss (Table 7).
Intrauterine treatment
Twelve studies including 56 fetuses that underwent intrauterine aspiration of the cyst were included in the systematic review. After aspiration of the cyst, the inci-dence of recurrence was 37.9% (95% CI, 14.8–64.3%),
Study n/N (a) Thakkar Nakamura Marchitelli Catania Açıkgöz Jwa Papic Turgal Karakuş Amari Dimitraki Gaspari Nemec Aqrabawi Akin Eleftheriades Ben-Ami Zampieri Godinho Shimada Galinier Kwak Foley Enríquez Comparetto Mittermayer Heling Bagolan Luzzatto Combined 0.0 0.2 0.4 Proportion (95% CI) 0.6 0.8 1.0 25/34 0.74 (0.56–0.87) 0.55 (0.36–0.73) 0.12 (0.01–0.36) 0.30 (0.13–0.53) 0.36 (0.13–0.65) 0.64 (0.35–0.87) 0.31 (0.11–0.59) 0.90 (0.68–0.99) 0.71 (0.54–0.85) 0.51 (0.34–0.69) 0.94 (0.71–1.00) 0.60 (0.15–0.95) 0.31 (0.11–0.59) 1.00 (0.63–1.00) 0.17 (0.04–0.41) 0.86 (0.42–1.00) 0.07 (1.7E-3–0.32) 0.58 (0.44–0.71) 0.60 (0.15–0.95) 0.63 (0.35–0.85) 0.44 (0.33–0.55) 0.63 (0.38–0.84) 0.27 (0.06–0.61) 0.61 (0.36–0.83) 0.50 (0.32–0.68) 0.72 (0.59–0.83) 0.53 (0.40–0.66) 0.42 (0.30–0.54) 0.63 (0.42–0.81) 0.54 (0.46–0.62) 17/31 2/17 7/23 5/14 9/14 5/16 18/20 27/38 18/35 16/17 3/5 5/16 8/8 3/18 6/7 1/15 33/57 3/5 10/16 36/82 12/19 3/11 11/18 16/32 42/58 34/64 28/67 17/27 420/784 2/21 0.10 (0.01–0.30) 0.20 (0.03–0.56) 0.25 (0.03–0.65) 0.00 (0.00–0.23) 0.04 (9.4E-4–0.19) 0.00 (0.00–0.26) 0.20 (5.1E-3–0.72) 0.00 (0.00–0.31) 0.36 (0.13–0.65) 0.00 (0.00–0.52) 0.71 (0.42–0.92) 0.40 (0.05–0.85) 0.27 (0.06–0.61) 0.39 (0.25–0.54) 0.51 (0.37–0.65) 0.21 (0.05–0.51) 0.73 (0.39–0.94) 0.04 (9.4E-4–0.19) 0.21 (0.09–0.38) 0.44 (0.22–0.69) 0.24 (0.14–0.34) 2/10 2/8 0/14 1/27 0/12 1/5 0/10 5/14 0/5 10/14 2/5 3/11 19/49 28/55 3/14 8/11 1/27 7/34 8/18 102/364 n/N Study (b) Nakamura Jwa Papic Turgal Karakuş Dimitraki Gaspari Nemec Akin Eleftheriades Ben-Ami Monnery-Noché Godinho Shimada Galinier Kwak Foley Mittermayer Bagolan Luzzatto Combined 0.00 0.24 Proportion (95% CI) 0.48 0.72 0.96 Study n/N (c) Nakamura Catania Açıkgöz Papic Turgal Karakuş Dimitraki Gaspari Nemec Aqrabawi Akin Eleftheriades Ben-Ami Zampieri Godinho Shimada Galinier Kwak Foley Enríquez Comparetto Mittermayer Heling Bagolan Combined 0.00 0.24 Proportion (95% CI) 0.48 0.72 0.96 0.45 (0.32–0.57) 0.22 (0.15–0.29) 4/31 0.13 (0.04–0.30) 0.56 (0.30–0.80) 0.14 (0.02–0.43) 0.69 (0.39–0.91) 0.15 (0.02–0.45) 0.03 (6.7E-4–0.14) 0.07 (1.8E-3–0.34) 0.20 (5.1E-3–0.72) 0.08 (2.1E-3–0.38) 0.00 (0.00–0.37) 0.28 (0.10–0.53) 0.14 (3.6E-3–0.58) 0.18 (0.05–0.40) 0.11 (0.04–0.22) 0.00 (0.00–0.52) 0.21 (0.05–0.51) 0.54 (0.41–0.66) 0.39 (0.28–0.50) 0.24 (0.07–0.50) 0.09 (2.3E-3–0.41) 0.12 (0.01–0.36) 0.19 (0.07–0.36) 0.20 (0.10–0.34) 0.11 (0.04–0.24) 9/16 2/14 9/13 2/13 1/38 1/14 1/5 1/12 0/8 5/18 1/7 4/22 6/57 0/5 3/14 36/67 32/82 4/17 1/11 2/17 6/32 10/50 5/46 29/65 174/674 Monnery-Noché 0/16 0.00 (0.00–0.21) 0.07 (1.8E-3–0.34) 0.00 (0.00–0.25) 0.00 (0.00–0.09) 0.00 (0.00–0.23) 0.00 (0.00–0.52) 0.17 (0.02–0.48) 0.00 (0.00–0.37) 0.06 (1.4E-3–0.27) 0.00 (0.00–0.41) 0.00 (0.00–0.15) 0.18 (0.09–0.30) 0.40 (0.05–0.85) 0.21 (0.05–0.51) 0.06 (0.02–0.15) 0.06 (0.02–0.14) 0.00 (0.00–0.20) 0.00 (0.00–0.28) 0.00 (0.00–0.20) 0.31 (0.16–0.50) 0.04 (4.9E-3–0.14) 0.17 (0.08–0.31) 0.00 (0.00–0.06) 0.07 (0.04–0.11) 1/14 0/13 0/38 0/14 0/5 2/12 0/8 1/18 0/7 0/22 10/57 2/5 3/14 4/67 5/82 0/17 0/11 0/17 10/32 2/50 8/46 0/65 48/630 Study n/N (d) Catania Açıkgöz Turgal Karakuş Dimitraki Gaspari Nemec Aqrabawi Akin Eleftheriades Ben-Ami Zampieri Godinho Shimada Galinier Kwak Foley Enríquez Comparetto Mittermayer Heling Bagolan Combined 0.0 0.3 Proportion (95% CI) 0.6 0.9 Monnery-Noché 2/14 0.14 (0.02–0.43) 0.45 (0.27–0.64) 0.13 (0.02–0.40) 0.81 (0.54–0.96) 0.29 (0.08–0.58) 0.36 (0.13–0.65) 0.85 (0.55–0.98) 0.15 (0.02–0.45) 0.29 (0.15–0.46) 0.12 (0.01–0.36) 0.07 (1.8E-3–0.34) 0.40 (0.05–0.85) 0.25 (0.05–0.57) 0.00 (0.00–0.37) 0.83 (0.59–0.96) 0.14 (3.6E-3–0.58) 0.32 (0.14–0.55) 0.42 (0.29–0.56) 0.40 (0.05–0.85) 0.50 (0.23–0.77) 0.96 (0.87–0.99) 0.48 (0.36–0.59) 0.41 (0.18–0.67) 0.18 (0.02–0.52) 0.41 (0.18–0.67) 0.50 (0.32–0.68) 0.26 (0.15–0.40) 0.65 (0.50–0.79) 0.45 (0.32–0.57) 0.30 (0.14–0.50) 0.39 (0.30–0.49) 14/31 2/15 13/16 4/14 5/14 11/13 2/13 11/38 2/17 1/14 2/5 3/12 0/8 15/18 1/7 7/22 24/57 2/5 7/14 64/67 39/82 7/17 2/11 7/17 16/32 13/50 30/46 29/65 8/27 343/761 Study (e) Thakkar Nakamura Marchitelli Açıkgöz Jwa Papic Turgal Karakuş Amari Dimitraki Gaspari Nemec Aqrabawi Akin Eleftheriades Ben-Ami Zampieri Godinho Shimada Galinier Kwak Foley Enríquez Comparetto Mittermayer Heling Bagolan Luzzatto Combined 0.0 0.2 0.4 Proportion (95% CI) 0.6 0.8 1.0 Catania Monnery-Noché n/N 3/31 0/14 7/13 2/13 3/38 1/14 2/5 2/12 0/8 14/18 1/7 2/22 0/57 1/5 7/14 31/67 28/82 5/17 1/11 7/17 16/32 13/50 12/46 28/65 8/27 194/685 Study n/N (f) Nakamura Jwa Papic Turgal Karakuş Dimitraki Gaspari Nemec Aqrabawi Akin Eleftheriades Ben-Ami Zampieri Godinho Shimada Galinier Kwak Foley Enríquez Comparetto Mittermayer Heling Bagolan Luzzatto Combined 0.00 0.24 Proportion (95% CI) 0.48 0.72 0.96 0.25 (0.17–0.34) 0.10 (0.02–0.26) 0.00 (0.00–0.23) 0.54 (0.25–0.81) 0.15 (0.02–0.45) 0.08 (0.02–0.21) 0.07 (1.8E-3–0.36) 0.40 (0.05–0.85) 0.17 (0.02–0.48) 0.00 (0.00–0.37) 0.78 (0.52–0.94) 0.14 (3.6E-3–0.58) 0.09 (0.01–0.29) 0.00 (0.00–0.06) 0.20 (5.1E-3–0.72) 0.50 (0.23–0.77) 0.46 (0.34–0.59) 0.34 (0.24–0.45) 0.29 (0.10–0.56) 0.09 (2.3E-3–0.41) 0.41 (0.18–0.67) 0.50 (0.32–0.68) 0.26 (0.15–0.40) 0.26 (0.14–0.41) 0.43 (0.31–0.56) 0.30 (0.14–0.50) Monnery-Noché
Figure 2 Pooled proportions for: (a) resolution of cyst; (b) change of ultrasound pattern in cyst from simple to complex; (c) ovarian torsion;
Table 3 Pooled odds ratios (ORs) for likelihood of resolution of fetal ovarian cyst, according to cyst size and/or ultrasound appearance Variable Studies (n) Fetuses (n/N vs n/N) Pooled OR P Sensitivity* (%) Specificity* (%)
Complex vs simple cysts 20 68/224 vs 231/341 0.15
(0.10–0.23) <0.001 58.6 (52.5–64.6) 77.3 (72.0–81.8) Cysts≥ 40 mm vs cysts < 40 mm 16 60/192 vs 149/168 0.03 (0.01–0.06) <0.001 87.4 (80.8–92.1) 71.3 (64.6–77.2) Simple cysts≥ 40 mm vs < 40 mm 16 45/134 vs 140/156 0.02 (0.00–0.06) <0.001 84.8 (76.1–90.8) 75.7 (68.7–81.5) Complex cysts≥ 40 mm vs < 40 mm 9 17/54 vs 25/28 0.06 (0.01–0.21) <0.001 92.5 (78.5–98.0) 59.5 (43.3–74.0) Complex cysts≥ 40 mm vs simple cysts ≥ 40 mm 11 19/60 vs 42/83 0.40
(0.18–0.88)
0.022 50.0
(38.8–61.2)
68.9 (55.6–79.8) Complex cysts < 40 mm vs simple cysts≥ 40 mm 11 26/30 vs 39/73 4.93
(1.36–17.8)
0.015 10.5
(3.0–25.7)
60.0 (47.1–71.7) Complex cysts≥ 40 mm vs simple cysts < 40 mm 12 20/62 vs 71/83 0.04
(0.01–0.12)
<0.001 77.8 (64.1–87.5)
78.0 (67.9–85.7) Complex cysts < 40 mm vs simple cysts < 40 mm 11 26/30 vs 64/74 0.56
(0.09–3.38)
0.5 25.6
(9.6–58.0)
71.1 (60.5–79.9) Values in parentheses are 95% CI. *Computed for reverse outcome ‘no resolution’.
Table 4 Pooled odds ratios (ORs) for likelihood of ovarian torsion in fetuses with ovarian cyst, according to cyst size and/or ultrasound
appearance Variable Studies (n) Fetuses (n/N vs n/N) Pooled OR P Sensitivity (%) Specificity (%)
Complex vs simple cysts 19 139/253 vs 7/242 59.1
(24.7–141.0) <0.001 95.2 (90.0–97.9) 67.3 (62.1–72.2) Cysts≥ 40 mm vs cysts < 40 mm 13 45/116 vs 3/121 30.8 (8.6–110.0) <0.001 93.8 (81.8–98.4) 62.4 (55.1–69.3) Simple cysts≥ 40 mm vs < 40 mm 12 14/82 vs 1/123 26.7 (3.3–214.0) 0.002 93.3 (66.0–99.7) 64.2 (56.9–70.9) Complex cysts≥ 40 mm vs < 40 mm 9 37/61 vs 3/33 16.2 (4.3–61.6) <0.001 92.5 (78.5–98.0) 55.6 (41.5–68.8) Complex cysts≥ 40 mm vs simple cysts ≥ 40 mm 9 37/61 vs 1/40 82.0
(9.1–743.0)
<0.001 97.4 (84.6–99.9)
61.9 (48.8–73.6) Complex cysts < 40 mm vs simple cysts≥ 40 mm 9 3/35 vs 2/38 1.8
(0.2–13.7)
0.6 60.0
(17.0–92.7)
52.9 (45.0–65.0) Complex cysts≥ 40 mm vs simple cysts < 40 mm 11 38/66 vs 0/62 114.0
(19.3–∞)*
<0.001 100 (88.6–100)
68.9 (58.1–78.0) Complex cysts < 40 mm vs simple cysts < 40 mm 10 3/39 vs 0/60 6.2
(0.6–∞)* 0.11 (31.0–100)100
62.5 (52.0–72.0) Values in parentheses are 95% CI. *Exact logistic regression as no logistic regression model was possible due to zero events in reference group.∞, infinity.
whereas an increase in cyst size occurred in 6.9% (95% CI, 2.0–14.5%) of cases. Almost half of the cysts aspirated
in utero did not recur, either during pregnancy or after
birth (PP, 48.9% (95% CI, 25.0–74.0%)). Change of ultrasound pattern in the cyst after aspiration, from a sim-ple to comsim-plex appearance, occurred in 7.9% (95% CI, 2.6–15.8%) of cases, whereas ovarian torsion and intra-cystic hemorrhage were diagnosed after birth in 10.8% (95% CI, 4.4–19.7%) and 12.8% (95% CI, 3.8–26.0%) of the treated cases, respectively. The rate of preterm delivery or miscarriage due to the invasive procedure was 5.1% (95% CI, 0.7–13.0%; 1/44; I2, 0%) and 21.8% (95% CI, 0.9–40.0%) had surgery after birth (Table 8 and Figure 3).
False-positive rate of prenatal diagnosis and histopathological assessment
The false-positive rate of prenatal ultrasound examination detecting fetal ovarian cysts was 7.5% (95% CI, 4.4–11.4%). Of these cases with misdiagnosis of ovarian cyst, almost half were gastrointestinal anomalies (PP, 54.1% (95% CI, 28.1–78.9%)). Furthermore, urogenital and renal anomalies were diagnosed incorrectly as ovarian cysts in 14.9% (95% CI, 6.6–25.6%) and 10.3% (95% CI, 4.0–19.1%) of cases, respectively (Table S8).
Histopathological assessment of the ovarian cyst following surgery was available for 385 cases. The majority of cysts were either follicular or theca lutein (93.0% (95% CI, 87.7–96.8%)), and cystadenoma and
Table 5 Pooled odds ratios (ORs) for risk of intracystic hemorrhage in fetuses with ovarian cyst, according to cyst size and/or ultrasound appearance Variable Studies (n) Fetuses (n/N vs n/N) Pooled OR P Sensitivity (%) Specificity (%)
Complex vs simple cysts 17 19/210 vs 0/205 28.6
(4.9–∞)* <0.001 (79.1–100)100 51.8 (46.7–56.8) Cysts≥ 40 mm vs cysts < 40 mm 12 2/15 vs 0/35 31.7 (3.7–270.0) 0.002 100 (82.0–100) 72.9 (57.9–84.3) Simple cysts≥ 40 mm vs < 40 mm 10 20/70 vs 0/115 63.4 (10.7–∞)* <0.001 100 (80.0–100) 69.7 (62.0–76.5) Complex cysts≥ 40 mm vs < 40 mm 7 5/44 vs 1/26 2.8 (0.3–28.5) 0.4 83.3 (36.5–99.1) 39.1 (27.4–52.1) Complex cysts≥ 40 mm vs simple cysts ≥ 40 mm 7 5/44 vs 0/28 4.6
(0.6–∞)*
0.16 100
(46.3–100)
41.8 (30.1–54.5) Complex cysts < 40 mm vs simple cysts≥ 40 mm 7 1/28 vs 0/26 0.9
(0.0–∞)*
0.9 100
(5.5–100)
49.1 (35.3–63.0) Complex cysts≥ 40 mm vs simple cysts < 40 mm 9 7/49 vs 0/54 11.9
(1.7–∞)* 0.009 (56.1–100)100
56.3 (45.8–66.2) Complex cysts < 40 mm vs simple cysts < 40 mm 8 1/32 vs 0/52 1.6
(0.0–∞)*
0.8 100
(5.5–100)
62.7 (51.3–72.8) Values in parentheses are 95% CI. *Exact logistic regression as no logistic regression model was possible due to zero events in reference group.∞, infinity.
Table 6 Pooled odds ratios (ORs) for likelihood of postnatal surgery in fetuses with ovarian cyst, according to cyst size and/or ultrasound
appearance Variable Studies (n) Fetuses (n/N vs n/N) Pooled OR P Sensitivity (%) Specificity (%)
Complex vs simple cysts 22 197/290 vs 77/292 14.6
(8.5–24.8) <0.001 71.9 (66.1–77.1) 69.8 (64.3–74.8) Cysts≥ 40 mm vs cysts < 40 mm 15 96/138 vs 9/140 64.4 (23.6–175.0) <0.001 91.4 (83.9–95.8) 75.7 (68.5–81.8) Simple cysts≥ 40 mm vs < 40 mm 14 67/90 vs 1/133 3998 (233–68 626) <0.001 98.5 (91.0–99.9) 85.2 (78.4–90.2) Complex cysts≥ 40 mm vs < 40 mm 11 56/75 vs 7/42 48.8 (10.4–229.0) <0.001 88.9 (77.8–95.0) 64.8 (50.6–77.0) Complex cysts≥ 40 mm vs simple cysts ≥ 40 mm 11 58/75 vs 23/48 17.7
(4.4–71.3)
<0.001 71.6 (60.3–80.8)
59.5 (43.3–74.0) Complex cysts < 40 mm vs simple cysts≥ 40 mm 11 7/44 vs 23/46 0.2
(0.1–0.8)
0.016 23.3
(10.6–42.7)
38.3 (26.4–51.8) Complex cysts≥ 40 mm vs simple cysts < 40 mm 13 61/80 vs 1/72 2015
(71.0–57 179)
<0.001 98.4 (90.2–99.9)
78.9 (68.8–86.5) Complex cysts < 40 mm vs simple cysts < 40 mm 12 7/48 vs 1/70 45.3
(1.2–1722)
0.040 87.5
(46.7–99.3)
80.5 (74.3–85.5) Values in parentheses are 95% CI.
teratoma were diagnosed in 2.1% (95% CI, 0.9–3.7%) and 1.5% (95% CI, 0.5–2.9%) of cases, respectively (Table S9).
DISCUSSION Main findings
The findings from this systematic review showed that a large proportion of fetal ovarian cysts regress either during pregnancy or after birth. Simple cysts may change in ultrasound appearance during pregnancy and become complex, which is associated with an increased risk of ovarian loss. The size and appearance of the cyst are the major determinants of perinatal outcome and are associated with an increased risk of ovarian torsion,
intracystic hemorrhage and need for oophorectomy. The false-positive rate of prenatal ultrasound examination in the detection of fetal ovarian cysts is low, although it is not uncommon for gastrointestinal, renal and urogenital anomalies to be misdiagnosed as ovarian cysts. The very small number of included cases precluded extrapolation of robust evidence on the value of intrauterine treatment of ovarian cysts.
Strengths and limitations
The small number of cases in some of the included studies, their retrospective non-randomized design, different periods of follow-up, dissimilarity of the populations (due to various inclusion criteria) and lack of fixed criteria for when to treat and postnatal confirmation represent the
Table 7 Pooled odds ratio (OR) for likelihood of ovarian loss at surgery (due to oophorectomy or salpingo-oophorectomy) in fetuses with
ovarian cyst, according to cyst size and/or ultrasound appearance
Variable Studies (n) Fetuses (n/N vs n/N) Pooled OR P Sensitivity (%) Specificity (%)
Complex vs simple cysts 20 139/263 vs 17/276 35.1
(17.0–72.7) <0.001 89.9 (82.9–93.3) 67.6 (62.4–72.2) Cysts≥ 40 mm vs cysts < 40 mm 15 76/138 vs 5/140 58.9 (19.2–181.0) <0.001 93.8 (85.6–97.8) 68.5 (61.5–74.8) Simple cysts≥ 40 mm vs < 40 mm 13 26/84 vs 0/129 80.3 (13.8–∞)* <0.001 100 (84.0–100) 69.0 (61.8–75.4) Complex cysts≥ 40 mm vs < 40 mm 10 42/62 vs 4/38 21.8 (5.8–81.9) <0.001 91.3 (78.3–97.2) 63.0 (48.7–75.4) Complex cysts≥ 40 mm vs simple cysts ≥ 40 mm 10 42/62 vs 10/62 35.0
(5.93–206.0)
<0.001 80.8 (67.0–89.9)
72.2 (60.2–81.8) Complex cysts < 40 mm vs simple cysts≥ 40 mm 10 4/40 vs 10/40 1.6
(0.2–13.8)
0.7 28.6
(9.6–58.0)
45.5 (33.3–58.1) Complex cysts≥ 40 mm vs simple cysts < 40 mm 12 44/67 vs 0/68 ∞
(500.0–∞)* <0.001 (89.9–100)100
74.7 (64.3–83.0) Complex cysts < 40 mm vs simple cysts < 40 mm 11 4/44 vs 0/66 8.4
(1.0–∞)*
0.047 100
(39.6–100)
62.3 (52.3–71.3) Values in parentheses are 95% CI. *Exact logistic regression as no logistic regression model was possible due to zero events in reference group.∞, infinity.
Table 8 Pooled proportions (PPs) for different outcomes in fetuses with ovarian cyst treated prenatally
Outcome Studies (n) Fetuses (n/N) Raw proportion (%) I2(%) PP (%)
Recurrence of cyst 12 19/56 33.93 (21.8–47.8) 74 37.88 (14.8–64.3)
Resolution of cyst 12 31/56 55.36 (41.5–68.7) 70 48.86 (25.0–73.0)
Increase of cyst size 12 2/56 3.57 (0.4–12.3) 0 6.90 (2.0–14.5)
Change of ultrasound pattern of cyst from simple to complex 12 2/56 3.57 (1.0–12.1) 0 7.90 (2.6–15.8)
Ovarian torsion 12 4/56 7.14 (2.0–17.0) 0 10.83 (4.4–19.7)
Intracystic hemorrhage 12 5/56 8.93 (3.0–19.6) 35.3 12.78 (3.8–26.0)
Surgery 12 9/56 16.07 (7.6–28.3) 40.5 21.81 (0.9–38.0)
Preterm birth or miscarriage 6 1/44 2.27 (0.1–12.0) 0 5.10 (0.7–13.0)
Values in parentheses are 95% CI.
major limitations of this systematic review. Assessment of the potential publication bias was also problematic because of the nature of the outcome evaluated (outcome rates, with the lefthand side limited to a value of zero), which limits the reliability of funnel plots, and because of the small number of individual studies, which strongly limits the reliability of formal tests.
Most of the observed outcomes were reported in only a limited proportion of the included studies. Furthermore, we could not stratify the analysis according to different cut-offs for cyst size in view of the fact that the majority of these were reported in only a few studies, thus considerably limiting the interpretation of the results. The ascertainment of some of the outcomes observed, such as surgery or need for oophorectomy, was also considerably biased by the different postnatal management strategies adopted in different centers. Large lesions usually undergo surgical intervention, irrespective of the presence of symptoms, in order to reduce the risk of complications, such as torsion and hemorrhage, which may lead to ovarian loss. In this scenario, the results from this systematic review may have overestimated some of the adverse outcomes associated with ovarian cysts.
The assessment of the role of intrauterine therapy was also problematic. Ovarian cysts usually regress during pregnancy and, thus, the role of in-utero cyst aspiration in preventing the occurrence of torsion or hemorrhage could not be quantified completely. Furthermore, the very small number of included cases, different gestational ages at intervention, timepoints at postnatal follow-up and lack of ascertainment according to cyst size and appearance did not allow us to draw any conclusion on the role of prenatal cyst aspiration in the management of ovarian cysts. Therefore, an adequately powered randomized control trial is needed in order to ascertain the value of prenatal cyst aspiration.
Despite these limitations, the present review represents the best published estimate of the investigated outcomes in fetuses diagnosed with ovarian cysts.
Implications for clinical practice
Prenatal and postnatal management of fetal ovarian cysts is challenging. The evidence is sparse and is derived mainly from postnatal series reporting high rates of complications and need for surgical intervention. The findings from this systematic review showed that ultrasound appearance and
Study n/N (a) Catania Açıkgöz Jwa Noia Nemec Galinier Kwak Enríquez Mittermayer Heling Bagolan Perrotin Combined 0.00 0.25 Proportion (95% CI) 0.50 0.75 1.00 Study n/N (b) Catania 1.00 (0.16–1.00) 0.00 (0.00–0.71) 0.00 (0.00–0.41) 0.67 (0.38–0.88) 1.00 (0.03–1.00) 0.50 (0.07–0.93) 1.00 (0.03–1.00) 0.00 (0.00–0.98) 1.00 (0.16–1.00) 0.33 (8.4E-3–0.91) 0.00 (0.00–0.23) 0.00 (0.00–0.71) 0.38 (0.15–0.64) 0.00 (0.00–0.81) 0.67 (0.09–0.99) 1.00 (0.59–1.00) 0.33 (0.12–0.62) 0.00 (0.00–0.98) 0.00 (0.00–0.60) 0.00 (0.00–0.98) 0.00 (0.00–0.98) 0.00 (0.00–0.84) 0.33 (8.4E-3–0.91) 0.86 (0.57–0.98) 1.00 (0.29–1.00) 0.49 (0.25–0.73) 0.00 (0.00–0.84) 0.00 (0.00–0.71) 0.00 (0.00–0.41) 0.00 (0.00–0.22) 0.00 (0.00–0.98) 0.00 (0.00–0.60) 1.00 (0.03–1.00) 0.00 (0.00–0.98) 0.00 (0.00–0.84) 0.00 (0.00–0.71) 0.14 (0.02–0.43) 0.00 (0.00–0.71) 0.08 (0.03–0.16) 0.00 (0.00–0.84) 0.67 (0.09–0.99) 0.00 (0.00–0.41) 0.00 (0.00–0.22) 0.00 (0.00–0.98) 0.00 (0.00–0.60) 1.00 (0.03–1.00) 1.00 (0.03–1.00) 0.00 (0.00–0.84) 0.00 (0.00–0.71) 0.07 (1.8E-3–0.34) 0.00 (0.00–0.71) 0.13 (0.04–0.26) 0.00 (0.00–0.84) 0.00 (0.00–0.71) 0.00 (0.00–0.41) 0.13 (0.02–0.40) 0.00 (0.00–0.98) 0.00 (0.00–0.60) 0.00 (0.00–0.98) 0.00 (0.00–0.98) 0.00 (0.00–0.84) 0.00 (0.00–0.71) 0.14 (0.02–0.43) 0.00 (0.00–0.71) 0.11 (0.04–0.20) 0.00 (0.00–0.84) 0.67 (0.09–0.99) 0.00 (0.00–0.41) 0.07 (1.7E-3–0.32) 0.00 (0.00–0.98) 0.00 (0.00–0.60) 0.00 (0.00–0.98) 0.00 (0.00–0.98) 0.00 (0.00–0.84) 0.33 (8.4E-3–0.91) 0.00 (0.00–0.23) 0.00 (0.00–0.71) 0.07 (0.02–0.15) Açıkgöz Jwa Noia Nemec Galinier Kwak Enríquez Mittermayer Heling Bagolan Perrotin Combined 0.00 0.25 Proportion (95% CI) 0.50 0.75 1.00 Study n/N (c) Catania Açıkgöz Jwa Noia Nemec Galinier Kwak Enríquez Mittermayer Heling Bagolan Perrotin Combined 0.0 0.2 Proportion (95% CI) 0.6 0.8 1.0 0.4 Study n/N (d) Catania Açıkgöz Jwa Noia Nemec Galinier Kwak Enríquez Mittermayer Heling Bagolan Perrotin Combined 0.00 0.25 Proportion (95% CI) 0.50 0.75 1.00 Study n/N (e) Catania Açıkgöz Jwa Noia Nemec Galinier Kwak Enríquez Mittermayer Heling Bagolan Perrotin Combined Study (g) Catania Açıkgöz Jwa Noia Nemec Galinier Kwak Enríquez Mittermayer Heling Bagolan Perrotin Combined 0.0 0.2 Proportion (95% CI) 0.4 0.6 0.8 1.0 0.00 0.25 Proportion (95% CI) 0.75 1.00 0.50 Study n/N (f) Catania Açıkgöz Jwa Noia Nemec Galinier Kwak Enríquez Mittermayer Heling Bagolan Perrotin Combined 0.00 0.25 Proportion (95% CI) 0.50 0.75 1.00 19/56 2/2 0/3 0/7 10/15 0/3 0/14 1/3 1/1 2/4 1/1 2/2 0/1 31/56 0/2 2/3 7/7 3/3 12/14 1/3 0/2 1/1 0/1 0/4 0/1 5/15 1/15 1/3 0/2 0/3 0/7 0/1 0/4 0/1 0/1 0/2 0/14 0/3 2/56 1/1 1/14 0/2 0/3 0/7 0/15 0/1 0/1 0/4 0/2 0/3 0/3 2/56 4/56 0/2 0/3 0/7 2/15 0/1 0/4 0/1 0/1 0/2 0/3 0/3 2/14 5/56 0/2 2/3 0/7 0/15 0/1 0/4 1/1 1/1 0/2 0/3 1/14 0/3 9/56 0/3 0/3 2/14 1/3 0/7 1/15 1/1 1/4 1/1 0/1 0/2 2/2 Study n/N n/N (h) Catania 1.00 (0.16–1.00) 0.33 (8.4E-3–0.91) 0.00 (0.00–0.41) 0.07 (1.7E-3–0.32) 1.00 (0.03–1.00) 0.25 (6.3E-3–0.81) 1.00 (0.03–1.00) 0.00 (0.00–0.98) 0.00 (0.00–0.84) 0.00 (0.00–0.71) 0.14 (0.02–0.43) 0.00 (0.00–0.71) 0.22 (0.09–0.38) Jwa Noia Heling Bagolan Perrotin Combined 0.0 0.3 Proportion (95% CI) 0.6 0.9 0.00 (0.00–0.84) 0.00 (0.00–0.41) 0.07 (1.7E-3–0.32) 0.00 (0.00–0.71) 0.00 (0.00–0.23 0.00 (0.00–0.71) 0.05 (6.8E-3–0.13) 0/7 1/44 0/2 1/15 0/3 0/14 0/3
Figure 3 Pooled proportions for perinatal outcomes of: (a) recurrence of cyst; (b) resolution of cyst; (c) increase in cyst size; (d) change of
ultrasound pattern in cyst; (e) ovarian torsion; (f) intracystic hemorrhage; (g) surgery; and (h) preterm birth or miscarriage, in fetuses with ovarian cyst treated by intrauterine aspiration.
cyst size are the major determinants of perinatal outcome in these cases and can be used to tailor the optimal postnatal management of affected patients.
Simple cysts may occasionally change their ultrasound appearance and become complex, either during preg-nancy or after birth, and this was associated with a significantly increased risk of ovarian loss due to surgical oophorectomy or ovarian autoamputation. Ultrasound surveillance of the fetus should be scheduled in order to look for early signs of complications of the cyst, such as an increase in size or appearance of intracystic echoes. However, the optimal perinatal management of these cases is controversial49,50. Iatrogenic preterm delivery and prompt surgical intervention may further compro-mise these patients on the basis that ovarian function might have already been compromised. In this scenario, especially in cases remote from term, ultrasound mon-itoring of the cyst seems the most reasonable and safe option.
Complex cysts have been reported to be strongly asso-ciated with ovarian torsion requiring oophorectomy1,2. In the present review, the likelihood of surgical removal of the ovary was higher in large and complex cysts. Despite this, not all complex cysts showed signs of torsion, thus questioning whether postnatal intervention should be arranged immediately after birth in newborns with complex lesions.
The role of intrauterine aspiration of the ovarian cyst is controversial51. The findings from this systematic review suggest that almost half of the ovarian cysts aspirated in utero regress during pregnancy or after birth. Furthermore, the risks of torsion, hemorrhage and need for postnatal surgical intervention are relatively small. However, these findings come from retrospective series including mainly highly selected cases. The very small number of included studies, different timepoints at fetal intervention and follow-up and variation in cyst size and appearance did not allow us to draw any robust conclusion. Aspiration of the cyst in utero might be considered, especially in the case of large cysts presenting before term, in order not to compromise the reproductive capacity of the fetus in adult life or in case of the cyst causing compression on adjacent structures, leading to bowel obstruction or impaired flow in the ductus venosus. However, a randomized and adequately powered control trial is needed in order to ascertain the role, if any, of intrauterine aspiration of the cyst in the prenatal management of ovarian cysts.
Ovarian cysts are one of the most common abdominal cystic anomalies diagnosed prenatally. The present review showed that a small proportion of renal, gastrointestinal and genital anomalies can be misdiagnosed as ovarian cysts. Almost 15% of complex urogenital anomalies, such as persistence of urogenital sinus or cloaca, were misdiagnosed as ovarian cysts. Because these anomalies are associated with worse postnatal and surgical outcomes compared with ovarian cysts, a thorough ultrasound examination should be arranged in order to not misdiagnose them as ovarian cysts.
In conclusion, a large proportion of fetal ovarian cysts diagnosed prenatally regress during pregnancy or after birth. The risk of torsion is particularly high in the case of large cysts. The change of ultrasound pattern of the cyst during pregnancy is associated with a high risk of ovarian loss. The size and appearance of the cyst are the major determinants of perinatal outcome and are associated with an increased risk of ovarian torsion, intracystic hemorrhage and need for oophorectomy. Future randomized trials are needed in order to ascertain the role of fetal therapy in the management of these cases.
REFERENCES
1. Trinh TW, Kennedy AM. Fetal ovarian cysts: review of imaging spectrum, differential diagnosis, management, and outcome. Radiographics 2015; 35: 621–635. 2. Silva CT, Engel C, Cross SN, Copel JE, Morotti RA, Baker KE, Goodman TR.
Postnatal sonographic spectrum of prenatally detected abdominal and pelvic cysts.
AJR Am J Roentgenol 2014; 203: W684–696.
3. Nussbaum AR, Sanders RC, Hartman DS, Dudgeon DL, Parmley TH. Neonatal ovarian cysts: sonographic-pathologic correlation. Radiology 1988; 168: 817–821. 4. NHS Centre for Reviews and Dissemination. Systematic reviews: CRD’s guidance
for undertaking reviews in health care. University of York: York, UK, 2009. https://www.york.ac.uk/media/crd/Systematic&uscore;Reviews.pdf [Accessed 20 November 2015].
5. Prisma statement. http://www.prisma-statement.org/ [Accessed 20 November 2015]. 6. Wells GA, Shea B, O’Connell D, Peterson J, Welch V, Losos M, Tugwell P. Newcastle-Ottawa Scale for assessing the quality of nonrandomised stud-ies in meta-analyses. http://www.ohri.ca/programs/clinical&uscore;epidemiology/ oxford.asp [Accessed 20 November 2015].
7. Hunter JP, Saratzis A, Sutton AJ, Boucher RH, Sayers RD, Bown MJ. In meta-analyses of proportion studies, funnel plots were found to be an inaccurate method of assessing publication bias. J Clin Epidemiol 2014; 67: 897–903.
8. Egger M, Davey Smith G, Schneider M, Minder C. Bias in meta-analysis detected by a simple, graphical test. BMJ 1997; 315: 629–634.
9. Manzoli L, De Vito C, Salanti G, D’Addario M, Villari P, Ioannidis JP. Meta-analysis of the immunogenicity and tolerability of pandemic influenza A 2009 (H1N1) vaccines. PLoS One 2011; 6: e24384.
10. Higgins JPT, Green S (eds). Cochrane Handbook for Systematic Reviews of Interventions Version 5.0.2 [updated September 2009]. The Cochrane Collaboration, 2009. http://www.cochrane-handbook.org [Accessed 20 November 2015]. 11. Friedrich JO, Adhikari NK, Beyene J. Inclusion of zero total event trials in
meta-analyses maintains analytic consistency and incorporates all available data.
BMC Med Res Methodol 2007; 7: 5.
12. Sweeting MJ, Sutton AJ, Lambert PC. What to add to nothing? Use and avoidance of continuity corrections in meta-analysis of sparse data. Stat Med 2004; 23: 1351–1375.
13. Bradburn MJ, Deeks JJ, Berlin JA, Russell Localio A. Much ado about nothing: a comparison of the performance of meta-analytical methods with rare events. Stat
Med 2007; 26: 53–77.
14. Newcombe RG. Two-sided confidence intervals for the single proportion: comparison of seven methods. Stat Med 1998; 17: 857–872.
15. Catania VD, Briganti V, Di Giacomo V, Miele V, Signore F, de Waure C, Calabr `o GE, Calisti A. Fetal intra-abdominal cysts: accuracy and predictive value of prenatal ultrasound. J Matern Fetal Neonatal Med 2016; 29: 1691–1699.
16. Thakkar HS, Bradshaw C, Impey L, Lakhoo K. Post-natal outcomes of antenatally diagnosed intra-abdominal cysts: a 22-year single-institution series. Pediatr Surg Int 2015; 31: 187–190.
17. Nakamura M, Ishii K, Murata M, Sasahara J, Mitsuda N. Postnatal outcome in cases of prenatally diagnosed fetal ovarian cysts under conservative prenatal management.
Fetal Diagn Ther 2015; 37: 129–134.
18. Marchitelli G, Stirnemann J, Acanfora MM, Rousseau V, Salomon LJ, Ville Y. Prenatal diagnosis of intra-abdominal cystic lesions by fetal ultrasonography: Diagnostic agreement between prenatal and postnatal diagnosis. Prenat Diagn 2015; 35: 848–852.
19. Ac¸ıkg ¨oz AS, T ¨uten A, Bulut B, ¨Onc ¨ul M, Eskalen S, Burcu Dinc¸gez C, Adaletli I,
Madazlı R, Benian A. Fetal abdominal cysts: prenatal diagnosis and management.
Gynecol Obstet (Sunnyvale) 2015; 5: 319.
20. Jwa SC, Aoki H, Anami A, Umehara N, Sumie M, Wada S, Sago H. Management of fetal ovarian cyst using in utero aspiration. Case Rep Perinatal Med 2015; 4: 125–129.
21. Papic JC, Billmire DF, Rescorla FJ, Finnell SM, Leys CM. Management of neonatal ovarian cysts and its effect on ovarian preservation. J Pediat Surg 2014; 49: 990–994. 22. Karakus¸ OZ, Ates¸ O, Hakg ¨uder G, Olguner M, Akg ¨ur FM. Complex fetal ovarian cysts cause problems even after regression. Eur J Pediat Surg 2014; 24: 337–340. 23. Turgal M, Ozyuncu O, Yazicioglu A. Outcome of sonographically suspected fetal
ovarian cysts. J Matern Fetal Neonatal Med 2013; 26: 1728–1732.
24. Amari F, Beyer DA, Diedrich K, Weichert J. Fetal intra-abdominal tumors: assessment of spectrum, accuracy of prenatal diagnosis, perinatal outcome. Eur J Obstet Gynecol
25. Dimitraki M, Koutlaki N, Nikas I, Mandratzi T, Gourovanidis V, Kontomanolis E, Zervoudis S, Galazios G, Liberis V. Fetal ovarian cysts. Our clinical experience over 16 cases and review of the literature. J Matern Fetal Neonatal Med 2012; 25: 222–225.
26. Gaspari L, Paris F, Nicolino M, Hameury F, Bonnaure H, Pienkowski C, Servant N, Kalfa N, Sultan C. Fetal ovarian cysts: An early manifestation of McCune-Albright syndrome? Prenat Diagn 2012; 32: 859–863.
27. Lecarpentier E, Dreux S, Blanc T, Schaub B, Ville Y, Mandelbrot L, El Ghoneimi A, Oury JF, Muller F. Biochemical analysis of cystic fluid in the diagnosis of fetal intra-abdominal masses. Prenat Diagn 2012; 32: 627–631.
28. Nemec U, Nemec SF, Bettelheim D, Brugger PC, Horcher E, Sch ¨opf V, Graham JM Jr, Rimoin DL, Weber M, Prayer D. Ovarian cysts on prenatal MRI. Eur J Radiol 2012; 81: 1937–1944.
29. Noia G, Riccardi M, Visconti D, Pellegrino M, Quattrocchi T, Tintoni M, Manzoni C, Pintus C, Masini L, Caruso A. Invasive fetal therapies: Approach and results in treating fetal ovarian cysts. J Matern Fetal Neonatal Med 2012; 25: 299–303. 30. Aqrabawi HE. The outcome of antenatally diagnosed ovarian cysts. RMJ 2011; 36:
147–149.
31. Akın MA, Akın L, ¨Ozbek S, Tireli G, Kavuncuo ˘glu S, Sander S, Akc¸akus¸ M,
G ¨unes¸ T, ¨Ozt ¨urk MA, Kurto ˘glu S. Fetal-neonatal ovarian cysts-their monitoring and
management: retrospective evaluation of 20 cases and review of the literature. J Clin
Res Pediatr Endocrinol 2010; 2: 28–33.
32. Eleftheriades M, Iavazzo C, Hassiakos D, Aravantinos L, Botsis D. Seven cases of fetal ovarian cysts. Obstet Gynecol Int J 2010; 111: 267–268.
33. Ben-Ami I, Kogan A, Fuchs N, Smorgick N, Mendelovic S, Lotan G, Herman A, Maymon R. Long-term follow-up of children with ovarian cysts diagnosed prenatally.
Prenat Diagn 2010; 30: 342–347.
34. Zampieri N, Borruto F, Zamboni C, Camoglio FS. Foetal and neonatal ovarian cysts: A 5-year experience. Arch Gynecol Obstet 2008; 277: 303–306.
35. Godinho AB, Cardoso E, Melo MA, Gonc¸alves M, Da Graca LM. Ultrasonographic diagnosis of fetal ovarian cysts: Five cases in five years. J Matern Fetal Neonatal Med 2008; 21: 875–879.
36. Shimada T, Miura K, Gotoh H, Nakayama D, Masuzaki H. Management of prenatal ovarian cysts. Early Hum Dev 2008; 84: 417–420.
37. Monnery-Noch´e ME, Auber F, Jouannic JM, B´enifla JL, Carbonne B, Dommergues M, Lenoir M, Lepointe HD, Larroquet M, Grapin C, Audry G, H´elardot PG. Fetal and neonatal ovarian cysts: is surgery indicated? Prenat Diagn 2008; 28: 15–20.
38. Galinier P, Carfagna L, Juricic M, Lemasson F, Moscovici J, Guitard J, Baunin C, Menendez M, Cartault A, Pienkowski C, Kessler S, Sarramon MF, Vaysse P. Fetal ovarian cysts management and ovarian prognosis: a report of 82 cases J Pediatr Surg 2008; 43: 2004–2009.
39. Kwak DW, Sohn YS, Kim SK, Kim IK, Park YW, Kim YH. Clinical experiences of fetal ovarian cyst: Diagnosis and consequence. Korean J Med Sci 2006; 21: 690–694.
40. Foley PT, Ford WD, McEwing R, Furness M. Is conservative management of prenatal and neonatal ovarian cysts justifiable? Fetal Diagn Ther 2005; 20: 454–458.
41. Enr´ıquez G, Dur ´an C, Tor ´an N. Conservative versus surgical treatment for complex neonatal ovarian cysts: Outcomes study. AJR Am J Roentgenol 2005; 185: 501–508.
42. Comparetto C, Giudici S, Coccia ME, Scarselli G, Borruto F. Fetal and neonatal ovarian cysts: What’s their real meaning? Clin Exp Obstet Gynecol 2005; 32: 123–125.
43. Quarello E, Gorincour G, Merrot T, Boubli L, D’Ercole C. The ‘daughter cyst sign’: A sonographic clue to the diagnosis of fetal ovarian cyst. Ultrasound Obstet Gynecol 2003; 22: 433–434.
44. Mittermayer C, Blaicher W, Grassauer D. Fetal ovarian cysts: Development and neonatal outcome. Ultraschall Med 2003; 24: 21–26.
45. Heling KS, Chaoui R, Kirchmair F, Stadie S, Bollmann R. Fetal ovarian cysts: Prenatal diagnosis, management and postnatal outcome. Ultrasound Obstet Gynecol 2002; 20: 47–50.
46. Bagolan P, Giorlandino C, Nahom A, Bilancioni E, Trucchi A, Gatti C, Aleandri V, Spina V. The management of fetal ovarian cysts. J Pediatr Surg 2002; 37: 25–30. 47. Perrotin F, Potin J, Haddad G, Sembely-Taveau C, Lansac J, Body G. Fetal ovarian
cysts: A report of three cases managed by intrauterine aspiration. Ultrasound Obstet
Gynecol 2000; 16: 655–659.
48. Luzzatto C, Midrio P, Toffolutti T, Suma V. Neonatal ovarian cysts: Management and follow-up. Pediatr Surg Int 2000; 16: 56–59.
49. Mortellaro VE, Fike FB, Sharp SW, St. Peter SD. Operative findings in antenatal abdominal masses of unknown etiology in females. J Surg Res 2012; 177: 137–138. 50. Sakala EP, Leon ZA, Rouse GA. Management of antenatally diagnosed fetal ovarian
cysts. Obstet Gynecol Surv 1991; 46: 407–414.
51. Crombleholme TM, Craigo SD, Garmel S, D’Alton. Fetal ovarian cyst decompression to prevent torsion. J Pediatr Surg 1997; 32: 1447–1449.
SUPPORTING INFORMATION ON THE INTERNET
The following supporting information may be found in the online version of this article: Table S1 Search strategy using MEDLINE and EMBASE
Table S2 Excluded studies and reason for exclusion
Table S3 Pooled proportions of rate of resolution of fetal ovarian cysts either during pregnancy or after birth Table S4 Pooled proportions of occurrence of ovarian torsion in fetuses with a prenatal diagnosis of
ovarian cyst
Table S5 Pooled proportions of occurrence of intracystic hemorrhage in fetuses with prenatal diagnosis of ovarian cyst
Table S6 Pooled proportions of rate of postnatal surgery in fetuses with prenatal diagnosis of ovarian cyst Table S7 Pooled proportions of rate of ovarian loss at surgery (due to oophorectomy or
salpingo-oophorectomy) in fetuses with prenatal diagnosis of ovarian cyst
Table S8 Pooled proportions of rate of false-positive diagnoses of ovarian cyst according to cyst type Table S9 Pooled proportions of different histopathological diagnoses of fetal ovarian cysts