www.hydrol-earth-syst-sci.net/19/3047/2015/ doi:10.5194/hess-19-3047-2015
© Author(s) 2015. CC Attribution 3.0 License.
A 2600-year history of floods in the Bernese Alps, Switzerland:
frequencies, mechanisms and climate forcing
L. Schulte1, J. C. Peña2, F. Carvalho1, T. Schmidt3, R. Julià4, J. Llorca1, and H. Veit5 1Department of Physical Geography, University of Barcelona, Barcelona, Spain
2Meteorological Service of Catalonia, Barcelona, Spain 3Schmidt Information- and Webdesign, Düsseldorf, Germany
4FluvAlps Research Group, University of Barcelona, Barcelona, Spain 5Institute of Geography, University of Bern, Bern, Switzerland
Correspondence to: L. Schulte ([email protected])
Received: 26 February 2015 – Published in Hydrol. Earth Syst. Sci. Discuss.: 27 March 2015 Revised: 04 June 2015 – Accepted: 13 June 2015 – Published: 10 July 2015
Abstract. A 2600-year long composite palaeoflood record is reconstructed from high-resolution delta plain sediments of the Hasli–Aare floodplain on the northern slope of the Swiss Alps. Natural proxies compiled from sedimentary, geochem-ical and geomorphologgeochem-ical data were calibrated by textual and factual sources and instrumental data. No fewer than 12 of the 14 historically recorded extreme events between 1480 and the termination of the Hasli–Aare river channel correc-tion in 1875 were also identified by coarse-grained flood lay-ers, log(Zr / Ti) peaks and factor 1 anomalies. Geomorpho-logical, historical and instrumental data provide evidence for flood damage intensities and discharge estimations of severe and catastrophic historical floods.
Spectral analysis of the geochemical and documentary flood series and several climate proxies (TSI, δ18O, tree-rings, NAO, SNAO) identify similar periodicities of around 60, 80, 100, 120 and 200 years during the last millennia, in-dicating the influence of the North Atlantic circulation and solar forcing on alpine flood dynamics. The composite flood-plain record illustrates that periods of organic soil forma-tion and deposiforma-tion of phyllosilicates (from the medium high catchment area) match those of total solar irradiance max-ima, suggesting reduced flood activity during warmer cli-mate pulses. Aggradation with multiple sets of flood layers with increased contribution of siliciclasts from the highest catchment area (plutonic bedrock) (e.g. 1300–1350, 1420– 1480, 1550–1620, 1650–1720 and 1811–1851 cal yr AD) oc-curred predominantly during periods with reduced solar irra-diance, lower δ18O anomalies, cooler summer temperatures
and phases of drier spring climate in the Alps. Increased wa-ter storage by glaciers, snow cover and snow patches suscep-tible to melting processes associated with rainfall episodes and abrupt rises in temperature substantially increased sur-face runoff on slopes and discharges of alpine rivers. This interpretation is in agreement with the findings that the se-vere and catastrophic historical floods in the Aare since 1670 occurred mostly during positive SNAO (Summer North At-lantic Oscillation) pulses after years or even decades domi-nated by negative SNAO and cooler annual temperatures.
1 Introduction
Mountain regions like the Alps cover sensitive and vulnera-ble ecosystems which are exposed to changes in atmospheric circulation, extreme meteorological events, and the effects of land use. In the context of global climate change, it is striking that the annual mean temperatures in the Alps have increased 3 times more than the global temperature over the last 100 years (Hartmann et al., 2013). In general, the warming trend is not dependent on altitude (Hansen et al., 2010); however, the strong vertical environmental gradient, with major altitudinal limits such as the treeline, the snow-line, and so on, makes the alpine area very sensitive to cli-mate changes.
In contrast to urban gauging stations in the foreland (e.g. the Basel–Rhine station, in operation since AD 1808) data series of instrumental hydrological measurements in the
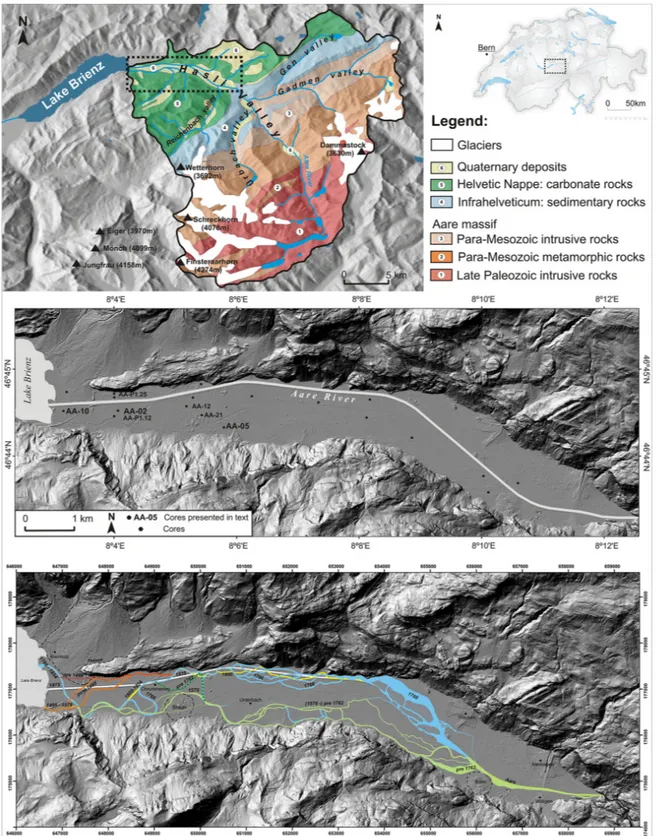
in-Figure 1. Geology of the Hasli–Aare catchment and digital terrain model of the Aare Delta plain in the lower Hasli Valley showing the
location of retrieved cores (black dots). Labelled dots represent key cores mentioned in the text. Bottom: evolution of the Aare River palaeochannels reconstructed from historical maps, field surveys and documentary sources (this paper). Age of reconstructed channels: red discontinuous: 1251–1499; orange: post-1499; green: 1578–pre-1762; discontinuous dark green: 1551–1762; blue: 1766; yellow: 1800; white: post-Aare correction in 1875.
ner Alps only go back 100 years and many of the series are affected by a flood gap from AD 1937 to 1967 (Gees, 1997). The fundamental problem is that secular climate pulses (e.g. during the Little Ice Age) and low-frequency extreme events may not be recorded in these flood series. For this reason it is difficult to confidently assess floods with a return period of > 200 years using short instrumental series, and other meth-ods need to be applied. For example, flood reconstruction from documentary sources like chronicles, annals, paintings and flood marks provides data from Switzerland over approx-imately the last 750 years (Röthlisberger, 1991; Pfister, 1999; Wetter et al., 2011), encompassing the latest climatic cycles of the Holocene: the end of the Medieval Warm Period, the Little Ice Age, and the 20th century warming.
Proxy data from sedimentary records such as lake sedi-ments (Irmler et al., 2006; Stewart et al., 2011; Wilhelm et al., 2012; Wirth et al., 2013) and floodplain deposits (Schulte et al., 2008, 2009a, 2014; Laigre et al., 2013; Carvalho, 2014) can provide data for the study of the potential effects of cli-matic changes on alpine floods outside the known range of extreme events reconstructed from documentary and instru-mental data. Continuous high-resolution palaeohydrological time series from terrestrial sediments of floods and debris flows are generally attributed to decadal and annual records of lake sediments rather than to those of fluvial sediments (e.g. Magny et al., 2010; Wilhelm et al., 2012; Wirth et al., 2013; Glur et al., 2013). However, with the exception of the studies in Lake Bourget (Arnaud et al., 2005), Lake Silva-plana (Stewart et al., 2011) and Lake Brienz (Wirth et al., 2011), most of the alpine lakes analysed are fed by small catchments ranging from several hectares to a few kilome-tres squared. Due to the unequal spatial distribution of the precipitation caused by summer thunderstorms and advective rainfall events (due for example to the orientation of slopes), the question arises of whether alpine lake records show a pre-dominantly local response to regional climate variability.
The aim of this paper is to reconstruct long time series gen-erated from high-resolution floodplain sediments of interdis-tributary basins of the Hasli–Aare Delta, which reproduce the fluvial dynamics, including trends, clusters and gaps in the floods in a medium-size basin. Medium-size basins are not only influenced by local factors, but may also respond to the regional and/or global climate variability. Furthermore, the investigation of the floodplain dynamics will integrate infor-mation about human occupation and hydraulic management interacting with the fluvial systems. The study focuses on the Bernese Alps, for two reasons: firstly, the societal demand for more reliable information on the hydrological risks in a densely populated area which historically has been consid-ered as a flood “hot spot”; and, secondly, for the possibility of calibrating geoarchives by historical sources and instru-mental data. Furthermore, we will test the geochemical flood proxies by applying spectral analysis if these time series pro-vide information regarding the frequencies of hydrological and environmental variability similar to the periodicities of
Late Holocene palaeoclimate proxies. These analyses and possible correlations contribute to the understanding of the possible driving forces behind alpine floods and the mecha-nisms at work.
2 Regional setting
The upper Aare Basin (46◦410N, 6◦040E; Fig. 1), located on the northern slope of the Swiss Alps, is dominated by alpine limestone landscapes in the north and by alpine crystalline landscapes in the south, carved by Quaternary glaciers. The 596 km2Aare catchment is subdivided into four major head-water catchments, the upper Hasli, Ürbach, Gen and Gad-men valleys, and the lower main valley, the lower Hasli Val-ley, which additionally is fed by several tributary basins (e.g. Alpbach, Reichenbach).
Catchment lithology (Fig. 1) is an important issue for the interpretation of geochemical proxies of key cores and for tracing sediments to establish their provenance. The northern fringe of the basin, the Helvetic Nappe (31.7 % of the catch-ment area; mean elevation 1578 m a.s.l.), consists of car-bonate rocks such as limestone, schist, calcareous sandstone, marly shales and calcareous phyllite. To the south this area is limited by the Infrahelveticum (2.4 % of the catchment area; mean elevation 2171 m a.s.l.), a narrow band of sandstone-rich flysch and limestones. The central area of the basin (37 % of the catchment area; mean elevation 2171 m a.s.l.) belongs to the Aare Massif. From north to south the para-Mesozoic bedrock includes granite with sericite, epidote and chlorite, feldspar-rich gneiss, and mica schist and gneiss, rich in biotite and muscovite. The southern catchment area (28.4 % of the area; mean elevation 2528 m a.s.l.) is formed by basic–ultrabasic old crystalline rocks (amphibolite, dior-ite and gneiss) and late Palaeozoic intrusive rocks (grandior-ite, quartz diorite, syenite) forming the highest slopes and sum-mit areas in the Aare Massif, up to an altitude of 4274 m at the Finsteraarhorn.
The present alpine geomorphology shows a high diver-sity of complex connected landforms such as cirques, glacier forefields, moraine walls, scree slopes, debris and allu-vial cones, discharge channels, rock avalanches, alluallu-vial fans and deltas. Some of these landforms result from non-linear threshold dynamics as a consequence of the inter-glacial adaption cycle (e.g. rock avalanches; Huggel et al., 2012); others respond to low-frequency climate changes (e.g. Holocene moraines; Hantke, 1980), but some landforms such as alluvial fans, alluvial plains and deltas may be sensitive to intracentennial climate variability.
At 563.70 (+1.63 / −1.25) m a.s.l., Lake Brienz defines the base level of erosion of the upper Aare River system, which accumulated a 12 km long and 1 km wide delta plain limited by the slopes of the lower Hasli Valley (Fig. 1). Sedimentation rates of the floodplain range from 1.16 to 6.20 mm yr−1and sediment volumes from 15 to 26 × 106m3
per 500 year time slices (Carvalho and Schulte, 2013). The floodplain morphology of the Hasli–Aare Delta, equiva-lent to the bottom of the lower Hasli Valley, is defined by palaeochannels, levees, crevasse splay and interdistributary basins. Sections and cores show how layers of fluvial grav-els, sand and silts intertongue with organic-rich beds and peat horizons which are related to a high water table of wetland environments.
In the northern Swiss Alps, floods have mainly been trig-gered by precipitation anomalies such as intensive sum-mer thunderstorms and long-lasting advective rainfall com-bined with pronounced snowmelt as well as glacier lake or landslide-dammed lake outburst floods (Gees, 1997; Wein-gartner et al., 2003). Precipitation ranges from 1175 mm yr−1 at Interlaken to 2800 mm yr−1 at the summit level of the Aare Massif. According to the instrumental hydrological data recorded since 1905 at the Brienzwiler gauging stations, the hydrological regime is defined as nival–glacial, taking into account the fact that approximately 17 % of the catchment area is covered by glaciers. The mean discharge of Aare River is 35 m3s−1at the Brienz gauging station, with a max-imum discharge of 444 m3s−1being recorded on 22 August 2005.
In spite of the potential geographical marginality of high mountain regions such as the Alps, periods of increased land use have been recorded since the Bronze Age (Schaer, 2003; Guyard et al., 2007; Ebersbach et al., 2010) and var-ious adaptation and mitigation strategies for natural hazards have been developed. In some areas these strategies are still part of the cultural landscape and settlement pattern. Since AD 1876, the lower Aare stretch has been channelized and since AD 1932 reservoirs for hydroelectric power have influ-enced flood dynamics due to changes in their retention capac-ities. As the result of the development of grazing, agriculture, industry, tourism and infrastructure, the AD 2000 census recorded a population of 8190 inhabitants in the upper Aare Basin. Furthermore, the population densities of the munici-palities in the lower Hasli Valley (50–100 inhabitants km−2) are among the highest per productive area in the Alps. How-ever, the limited space in the Hasli Valley that is suitable for settlement is mostly to be found in alluvial fans and trough shoulders. In contrast to the nearby Lütschine Delta, no towns or villages are located in the Hasli–Aare Delta flood-plain (with the exception of the small municipality of Unter-bach). However, present-day human activities (e.g. tourism) are not limited to traditional low-risk areas, due to the de-mographic pressure during the 19th and 20th centuries and the introduction of hydraulic management of the floodplains. Furthermore, infrastructures such as highways, power lines, hydroelectric power stations, gas pipelines, railway tracks and the Meiringen Air Base are all exposed to flood hazards.
3 Methods
The integrated multi-proxy approach focuses on the Late Holocene flood dynamics in the lower Hasli Valley, the main alpine valley in the upper Aare River. Palaeoflood fre-quencies were reconstructed from geoarchives, particularly from alluvial delta plain sediments (Sect. 3.1), geochemi-cal records (Sect. 3.2) and their geochemi-calibration by data series from historical sources and instrumental data (Sect. 3.3). Fre-quencies of various time series such as palaeoflood proxies, historical flood records, and climate variability were investi-gated (Sect. 3.4).
3.1 Geoarchives from delta floodplains
Mesoscale fluvial landforms were mapped in the delta flood-plain of the lower Hasli Valley by a geomorphological sur-vey and analysis of historical aerial photographs (AD 1928– 1944), IR and SPOT images, historical maps and a 2 m spatial resolution digital terrain model. Different sedimen-tary facies were identified depending on the floodplain mor-phology, changing environments, and river dynamics. Chan-nel and crevasse splay deposits are generally composed by coarse sand and gravel, levees by sand layers, and over-bank deposits by fine sand and silt, and interdistributary basins contain clay-rich and organic-rich layers as well as peat horizons. River channel shifts and avulsion may cause erosion and redeposition, whereas sediments in intradistribu-tary basins are deposited conformably. Thus, according to the results from the Lütschine Delta (Schulte et al., 2008), al-luvial plain sediments provide excellent geoarchives for re-constructing the Late Holocene aggradation and flood his-tory. During larger floods these basins record aggradation of coarse-grained flood layers; during moderate floods, fine-sand and silt deposits are formed, and organic-rich horizons and peat during minor floods or flood gaps. Therefore, peat layers are marker horizons that represent stable land surfaces, a high water table, and minimum sediment contribution.
A total of 16 cores were obtained by percussion coring down to 10 m depth. The lateral extension of the major units was traced by four cross sections of 20 m spaced shallow drillings (85 cores). Sediments, organic soil horizons and peat layers were described macromorphologically and wood, plant, mollusc fragments and artefacts were collected and classified. Sediment structures, facies and associated geo-morphic processes as well as the mineralogy of selected flood layers were analysed in thin sections. Furthermore, sedimen-tological data were compiled from core inventories provided by the geological database of the Bureau of Water Manage-ment of the Bern Canton (WWA).
The most detailed sedimentary records in the Hasli–Aare floodplain, in terms of lithological–geochemical and tempo-ral resolution, were retrieved from interdistributary basins and their lateral transitional landforms. In this paper we focus on three key cores: AA-10, at a distance of 200 m from the
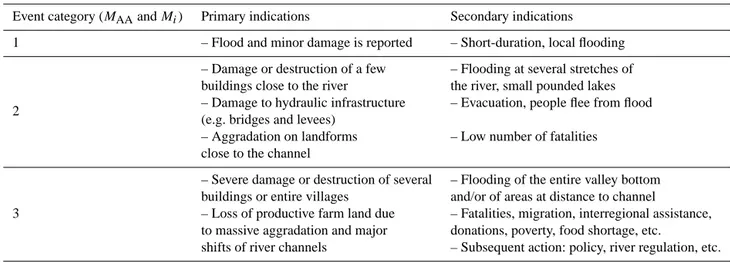
Table 1. Categories of historical Aare floods in the Hasli Valley.
Event category (MAAand Mi) Primary indications Secondary indications
1 – Flood and minor damage is reported – Short-duration, local flooding
2
– Damage or destruction of a few – Flooding at several stretches of buildings close to the river the river, small pounded lakes – Damage to hydraulic infrastructure – Evacuation, people flee from flood (e.g. bridges and levees)
– Aggradation on landforms – Low number of fatalities close to the channel
3
– Severe damage or destruction of several – Flooding of the entire valley bottom buildings or entire villages and/or of areas at distance to channel
– Loss of productive farm land due – Fatalities, migration, interregional assistance, to massive aggradation and major donations, poverty, food shortage, etc.
shifts of river channels – Subsequent action: policy, river regulation, etc.
delta shore line; AA-02, at a distance of 1.5 km; and AA-05, at a distance of 4.5 km (Fig. 1). The age–depth models are based on 11 AMS (accelerator mass spectrometry) radiocar-bon datings (Table 1 in Supplement) of peat, wood and plant remains analysed at the Tandem Laboratory, Uppsala, and compared to the chronology of other core sites in the study area (Schulte et al., 2008, 2009a, b; Carvalho and Schulte, 2013). From our experience with 161 radiocarbon datings, we suggest that radiocarbon ages of peat and wood (when not removed) show consistent and reproducible ages that corre-late at different sites. Radiocarbon dating of bulk sediment, plant remains and charcoal frequently show reversal of ages, due to sample contamination by reworked older organic-rich beds and redeposition processes. Radiocarbon ages were re-jected when they disagreed with the sample’s stratigraphic position. The chronology of each core sample was calculated from age–depth models based on linear interpolation be-tween the calibrated ages calculated with the CALIB Radio-carbon Calibration program Version 7.0 (Stuiver et al., 2014). The mean resolution of the sediment accumulation rate of our original sedimentary records is 0.25 cm yr−1. Each sample taken at intervals of 1 cm integrates 4 years. Calibration of the geochronological model was performed firstly by identi-fication of historical flood layers and metal anomalies (from the last century), secondly by the correlation of marker hori-zons and major geochemical anomalies and, thirdly, by the comparison of possible synchronized trends and variability of geochemical proxies and palaeoclimate records. For ex-ample, age–depth models were corrected within maximum probability intervals (Magny et al., 2011) where regular dis-placement of peaks in our data series were observed com-pared to other climate records such as the δ18O curve. For detailed information on the radiocarbon dating, the reader is referred to Table S1 in the Supplement and to Carvalho and Schulte, 2014; and Carvalho, 2014.
3.2 Geochemical flood proxies
To investigate the geochemical variations of the alluvial plain sediments during the last 2600 years, the element com-position of the samples retrieved was analysed by X-ray fluorescence (XRF) core scanning techniques (MARUM– University of Bremen) and by conventional XRF (Central Laboratories of the University of Barcelona). The XRF core scanning techniques (Avaatech Serial No. 2; Canberra X-PIPS Silicon Drift Detector) provide non-destructive analysis of split core surfaces collecting down-core data at 1 cm inter-vals over a 1.2 cm2area (Röhl and Abrams, 2000). The data were acquired by a Canberra X-PIPS Silicon Drift Detec-tor with 150eV X-ray resolution, the Canberra Digital Spec-trum Analyser DAS 1000, and an Oxford InsSpec-truments 50W XTF5011 X-Ray tube with rhodium (Rh) target material. The following X-ray tube settings were used: elements Al, Si, S, K, Ca, Ti, Mn, Fe at 10 kV, 0.35 mA and 30 s; Rb, Sr, Zr, Pb and Br at 30 kV, 0.75 mA and 60 s; and Cu at 20 kV, 0.25 mA and 30 s.
Because the XRF-scan results (counts per area) express the relative variability of fluorescence according to the different excitation of the atoms in the substance in response to bom-bardment by incident energy, it was not possible to obtain comparable percentages of element contents. Therefore, cal-ibration of individual samples with maximum anomalies was carried out by conventional X-ray fluorescence. In addition, lighter elements such as MgO, P2O5and NaO could also be measured. Spectrometric measurements were undertaken on pearls using a Philips PW 2400 spectrometer to estimate the of major element contents of 82 samples collected from the split cores. The major elements were quantified by a calibra-tion curve generated by 58 internacalibra-tional reference samples in pearls.
For comparison of CaCO3content, loss on ignition (LOI) at 950◦C was punctually measured following Heiri et al. (2001) and Santisteban et al. (2004). In addition, total
organic carbon (TOC) content was analysed systematically down-core by LOI at 550◦C at 1cm steps. TOC values of wood remains were removed case by case from the data set to avoid alteration of the geochemical proxy.
To generate environmental proxies from delta plain sedi-ments, the geochemical variability of the core samples was analysed in a series of steps. First, series of individual el-ements were plotted versus lithology, grain size and total organic carbon along with sample depth. Second, elements were analysed as Ti ratios, because of the conservative nature of Ti during transport and weathering (Kylander et al., 2011), in order to remove possible alterations in XRF-scan intensi-ties caused by pore volume, the changing roughness of the split core surface (counts per area decrease with increasing roughness) and so on. Third, factor analysis (FA) was com-puted with the STATISTICA 6 software to explore the vari-ability of the geochemical data sets (Schulte et al., 2009a). The first two factors were extracted (rotated and unrotated) from TOC values and the geochemical data matrix (origi-nal data and Ti ratios). The scores were plotted applying the geochronological model and then compared to data series of palaeoclimate records, such as reconstructed temperature and precipitation curves of the Alps (Büntgen et al., 2011), the Greenland δ18O record (GISP2; Reimer et al., 2004) and to-tal solar irradiance (TSI; Steinhilber et al., 2009). For this comparison a composite sedimentary palaeoflood proxy was generated from cores AA-02 and AA-05 at a 21-year resolu-tion taking the accumularesolu-tion rate between pairs of contiguous radiocarbon ages.
To investigate the provenance, deposition and diagenetic processes of the materials, minerals such as quartz, feldspar, chlorite, calcite and pedological features were microscopi-cally identified in thin sections and factor analyses were also applied to conventional XRF data, TOC and grain-size frac-tions of selected samples.
Furthermore, the Zr / Ti, Zr / Rb and Sr / Ti ratios were compared with grain-size fractions (laser diffraction grain size analyser) and macroscopically and microscopically analysed coarse-grained flood layers to produce grain-size flood proxies of three intensity levels (M1: silty fine sands, M2: fine sands, M3: middle and coarse sands). In contrast with the results of Jones et al. (2012) on the geochemical flood records of the upper River Severn in mid-Wales (UK), the Zr / Ti ratio calculated in the delta floodplain sediments of the lower Hasli Valley was a more sensitive signal than the Zr / Rb ratio. Finally, the frequency and magnitude of flood layers and Zr / Ti peaks were compared to the historical flood index reconstructed from documentary sources (Sect. 3.3). 3.3 Historical flood series and instrumental data Flood series of the upper Aare (Hasli Valley) were com-piled from textual sources (local and regional historical monographs, newspapers, scientific reports, reports of lo-cal and regional authorities, chronicles, the parish
regis-ter) and factual sources (historical maps, historical paint-ings and photographs) (Pfister, 1999). These reconstructed flood events were compared to episodes recorded in exist-ing flood databases for Switzerland provided by Röthlis-berger (1991) for the period AD 1020–1988, Pfister (1999) for the period AD 1496–1995, Gees (1997) for the period AD 1800–1994, Hählen (2007, Civil Engineering Depart-ment of the Bern Canton) for the period AD 1600–2005 and digital flood archives provided by the Swiss Flood and Land-slide Damage Database of the Swiss Federal Institute for For-est, Snow and Landscape Research for the period AD 1972– 2009. Singular flood events were also compared to instru-mental precipitation records of the IDAWEB database pro-vided by MeteoSwiss precipitation data from the stations of Guttannen since AD 1876 and Meiringen since AD 1898. In-formation on discharges of the upper Aare River was taken from the records of the Brienzwiler gauging station located 1.4 km from Lake Brienz, since AD 1905 (data provided by BUWAL).
Original flood descriptions were analysed to locate the re-ported damage geographically, to estimate the flooded area and to reconstruct the type and magnitude of damage. Re-ported geomorphic processes such as channel migration and aggradation were validated by the geomorphological data ob-tained by mapping and the sedimentological data by cor-ing along cross sections as described in Sect. 3.1. In addi-tion, useful information was also obtained via comparisons between the spatial evolution of the Hasli–Aare floodplain and the descriptions of the historical road network recon-structed by the Swiss Inventory of Thoroughfares (Inventar Historischer Verkehrswege der Schweiz, 1992).
To estimate historical flood intensities between AD 1480 and 2012, in the first step primary and secondary indications were defined for classifying floods according to the scale of the damage and geomorphic change (Table 1). Although sev-eral flood classifications and typologies have been proposed by a large range of publications (Röthlisberger, 1991; Pfister, 1999; Sturm et al., 2001), in the present study we adapted the flood criteria to local physiographic, socio-economic and demographic settings of the Aare and Lütschine catchments. In the second step, the tributary catchments were included in order to consider the spatial dimension. In the case of the Aare River, flood categories in the bottom of the lower Hasli Valley were multiplied by a factor of 1, whereas flood cate-gories in the tributaries and headwater catchments were mul-tiplied by 0.5. This higher weight is attributed to the floods in the stretch of the lower Hasli–Aare (MAA) because floods in the main valley normally result from higher discharges from several subcatchments (e.g. the floods of AD 1762 and 1831), while discharges that cause severe damage in a tributary (Mi) do not necessarily generate significant flooding in the main valley (e.g. the floods of AD 1869 and 1915). Finally, the to-tal flood intensities of the Aare River (M) are defined as the sum of both flood categories. Flood event intensities of < 2 are considered as small and medium sized, those ≥2 are
se-vere and those ≥ 3.5 are catastrophic. The maximum value of 4.5 was reached in AD 1762. The equation is
M = MAA+ n
X
i=1
(Mi·0.5) , (1)
where n is the number of flooded tributaries.
The precision and continuity of historical flood data series may change over time. In particular, information on small and medium flood categories before AD 1850 is limited. The data became more reliable after the introduction of the Swiss federal law on river correction in AD 1854, and improved over the course of the 19th century due to the increased infor-mation available in the press. As for severe and catastrophic flood episodes, several authors (Röthlisberger, 1991; Gees, 1997; Pfister, 1999; Wetter et al., 2011) note that they are generally well recorded in Switzerland due to their impact on society. Flood mitigation management was implemented in the Bernese Alps as early as the 13th century (Vischer, 2003) and more frequently since the 18th and 19th centuries (Wetter et al., 2011).
3.4 Spectral analysis of flood and climate series
Segments of the geochemical data series of cores AA-02, AA-05 and AA-10 (Sect. 3.2) show a quasi-cyclic variability (Schulte et al., 2014). To explore the frequencies of this vari-ability, the data were processed by spectral analysis (Schulz and Statteger, 1997; Schulz and Mudelsee, 2002). Frequency analyses were also applied to the historical flood series of the upper Aare catchment (Sect. 3.1) and other palaeoclimate records such as δ18O anomalies (the GISP 2 record from Greenland; Stuiver et al., 1997), δ14C anomalies (Reimer et al., 2004) and reconstructed temperature and precipitation curves from the Alps (Luterbacher et al., 2002; Büntgen et al., 2011). To detect periodic signals in unevenly spaced time data series, a harmonic analysis (Percival and Walden, 1993) was performed using the SPECTRUM software (Schulz and Statteger, 1997). The periodograms were calculated from the Lomb–Scargle Fourier transform with a rectangular window, using a significance level of 0.05 and λ of 0.4. This config-uration detects a false-alarm level of 99.6 % for white noise assessment through the Siegel test (Siegel, 1979). The red-noise spectra of the records have been processed with the REDFIT software (Schulz and Mudelsee, 2002).
4 Results
4.1 Aggradation processes in the floodplain
The key-cores retrieved from the Hasli–Aare floodplain (Figs. 1, 2) show alluvial delta plain facies defined by sequences of shallow gravel channel beds, sandy levee and crevasse splay deposits, coarse-grained flood layers within overbank deposits, palustrine fine-grained sediments,
organic-rich beds and peat horizons. From lithostratigraphi-cal data an aggradation model of the Hasli–Aare floodplain is reconstructed, showing two different patterns of floodplain dynamics: first, abrupt channel shifts, occasionally from one edge of the valley floor to the opposite; and, second, the ver-tical channel aggradation, combined with minor horizontal displacements. This pattern tends to produce a dissymmetry of the valley floor topography. In addition, these dynamics may be reinforced by the slow subsidence produced by the compaction of delta sediments.
For example, in AD 1766 the engineer Mirani (1766) mea-sured differences in height of up to 5.4 m between the south-ern and the northsouth-ern edges of the valley (Willi, 1932; Fig. 1). Under this predisposition the river can break through lev-ees during larger floods, thus changing its course towards the lowest parts of the valley (e.g. interdistributary basins). Consequently, a new cycle of progressive aggradations be-gins. In four cross sections the following shifts were iden-tified: between 957 and 1251 cal yr AD (14C dating; cores AA-02 and AA-P1.25) and AD 1762 (historical sources and14C dating; Aa-P1.12; Fig. 1). A third mechanism of channel shift was introduced by large landslides and debris flows such as the Bitschi landslide, dated by radiocarbon be-tween 574 ± 172 cal yr BC and 158 ± 80 cal yr AD (core AA-12; 56 ± 32 cal yr AD, core AA-21), the large Kienholz de-bris flow of AD 1499 (which destroyed the castle of Kien-holz), the Balm landslide of AD 1650, and to a lesser ex-tent the active scree slope southwest of Krummeney (until the 1860s).
Over the last centuries anthropogenic activity has become a major driver of floodplain dynamics. In the Hasli–Aare catchment a number of structural hydraulic measures have influenced the floodplain dynamics in the lower Hasli Valley: (1) the construction of the river barrier at the outlet of Lake Brienz, raising it by 1.50–1.95 m between AD 1434 and 1865 (Willi, 1932; Kurz and Lerch, 1979), thus affecting the dis-tal area of the Aare Delta; (2) the repeated levee construction and maintenance as well as the local river detour created by the local river management cooperative in AD 1579 (Willi, 1932); (3) the correction of the Aare River in AD 1876, chan-nelling and straightening the riverbed from the Aare gorge to the river mouth; and (4) the operation of several connected reservoirs to produce hydroelectric power since AD 1933. However, flood mitigation, ground sealing, deforestation, re-forestation, and changing land-use practices have opposite effects which may partially compensate for each other (Pfis-ter, 1999).
4.2 Sedimentary delta plain records
In general, the 10 m deep core AA-05 reflects low energy deposition environments of a marginal basin located at the southern valley floor at a distance of 4.5 km from Lake Brienz (Fig. 1). The basin is protected upstream by a land-slide deposits which diverted the Aare northwards during the
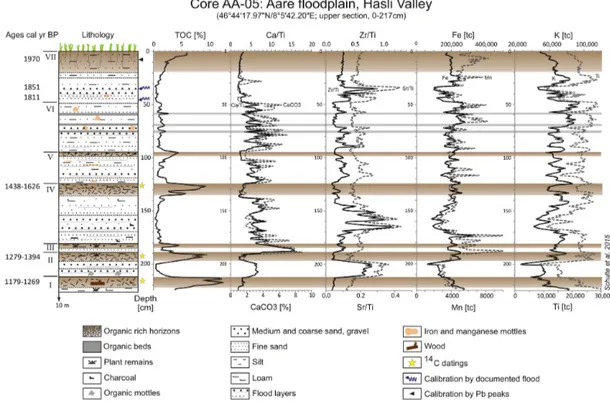
Figure 2. Lithology, chronology and geochemical stratigraphy of key core AA-05. The bars represent organic horizons and beds.
last 3000 years. Sand and silt beds deposited during multiple aggradation pulses are intercalated by 14 organic horizons. The geochronological model of the last 2600 years was es-tablished by six AMS radiocarbon ages (supplementary ma-terial; Table 1). The flood layers of the youngest units (unit VII) were calibrated by historical sources (AD 1811 at 36 cm depth and AD 1851 at 44 cm depth; Figs. 2, 3). The estab-lished chronology was tested by comparing the interpolated age of the Pb peak (AD 1967 at 7 cm depth) with the max-imum consumption of unleaded gasoline around AD 1970 (Weiss et al., 1999).
In the Hasli–Aare floodplain the water table is very close to the surface, ranging between 1.4 and 2.5 cm in depth. Therefore, hydromorphic dynamics are relevant for the in-terpretation of geochemical records. For example, Mn and Fe values mostly show a positive correlation, particularly in fine-grained layers, when they are bound in the clay lattice (Tebbens et al., 2000). Minimum values of both elements are recorded in sandy flood layers (Fig. 2). However, the Mn / Fe ratio, used by several authors as an indicator of palaeore-dox conditions (Koinig et al., 2003), decreases in the organic horizons where organic decomposition generates oxygen de-pletion, contributing to anoxic conditions and mobilization of Mn(II). Also important is the effect of groundwater dy-namics on carbonates. In core AA-05, carbonates are leached below the depth of 213 cm, whereas above this depth CaCO3 (Ca / Ti) shows a sensitive variability with maximum values of about 7 % (Fig. 2). To avoid inhomogeneous time series and to investigate the geochemical proxy with maximum
res-olution, in this paper the analysis of core AA-05 focuses on samples from between a depth of 217 cm and the surface.
Figure 2 shows seven major deposition pulses (units I– VII) of upward thinning sequences. The aggradation of sandy overbank deposits during major flooding is accurately recorded by Zr / Ti, Sr / Ti and Ca / Ti peaks associated with coarse-grained flood layers (Fig. 2). Silty paludal beds, which reflect decreased sediment contribution during minor floods, show high values of K, Ti and CaCO3and frequently contain disperse organic matter and plant remains. The or-ganic beds and soil horizons (4–12 % TOC) at the top of each cycle (at depths of 90, 125, 188 and 213 cm) correspond to relatively calm deposition environments or even to stable conditions without flooding.
The catchment lithology is reflected by thin section mi-cromorphology. Eighteen samples retrieved from flood lay-ers of cores AA-05 and AA-10 show quartz / feldspar ratios of grains (30–1500 µm) ranging from 0.4 to 0.7. Low ratios point to the dominance of feldspar contribution from the plu-tonic bedrock in the highest terrain of the Aare catchment, particularly during cooler climate pulses (Sect. 5.1).
The 6 m deep core AA-02, retrieved from a central inter-distributary basin located in the axis of the lower Hasli Valley floor 2 km from the lake shore, records nine major aggrada-tion pulses over the last 2600 years. Coarse channel deposits of the Aare River were drawn from 800–650 cm depths. The aggradation of the channel facies then ceased abruptly, prob-ably due to channel abandonment, and continued through the deposition of organic and silty material from palustral
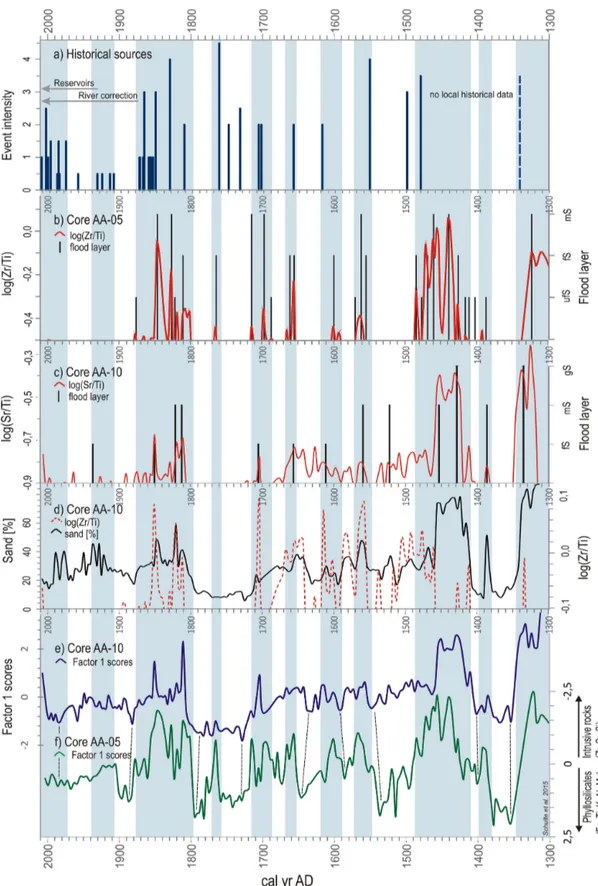
en-Figure 3. Chronostratigraphy of cores AA-05 and AA-10 and comparison with historical Aare floods in the Hasli Valley. Time series are
plotted in calibrated calendar years (cal yr AD). Each sample taken from cores at intervals of 1 cm integrates 3.8 years. No filters were applied to the data series. (a) Flood data series reconstructed by historical sources (columns) and archaeological data (dashed column). (b) log(Zr / Ti) values > −0.5 and coarse-grained flood layers (ufS: silty fine sand; fS: fine sand; mS: middle sand) of core AA-05. (c) log(Sr / Ti) values > −0.9 and coarse-grained flood layers (fS: fine sand; mS: middle sand; gS: coarse sand) of core AA-10. (d) Sand fraction (630–2000 µm) and log(Zr / Ti) values > −0.1 of core AA-10. (e, f) factor 1 scores of chemical composition of core AA-10 and AA-05 samples (reverse).
vironments. After 2220 cal yr BP, the influence of the Aare River is again more noticeable. Between the depths of 470 and 220 cm, multiple pulses of overbank deposition show a general trend of upward fining sedimentation. The upper unit (50–220 cm depth) contains four peat horizons with up to 45 % total organic carbon. The presence of minerotrophic fens in the central area of the floodplain lasted more than half a millennium, from 1450–1000 cal yr BP, until alluvial flood-plain sedimentation started again.
The mean chemical composition of the sediments of core AA-02 reflects the dominance of SiO2(74 %), Al2O3(18 %) and Fe2O3(7 %) due to the fact that 65 % of the catchment consists of crystalline bedrock of the Aare Massif (Fig. 1). Although more than 30 % of the Aare catchment area con-tributes carbonate-rich sediments to the river system, Ca counts are very low in the total data series of core AA-02. According to the X-ray diffraction analyses, CaO values of up to a maximum of 2 % are related to hornblende and not to carbonates. The absence of carbonates in the fine-grained beds (except for the lower gravel deposits) suggests (a) ef-ficient carbonate leaching by acidic water in peat wetland environments, and (b) the dominance of phyllosilicates as a source of fine-grained materials (the metamorphic rocks of the Aare Massif).
Two units of different facies were detected at core site AA-10, located 200 m from Lake Brienz. The lower unit (between depths of 1.80 and 12.00 m) consists of clean coarse sand and fine gravel which were deposited on the delta front, whereas the upper unit (0–1.80 m depth) shows sandy floodplain de-posits. In the paper we refer only to the delta plain deposits of the upper unit, which cover the last 700 years. The chronol-ogy of AA-10 was based on the correlation of beds with char-acteristic flood layers and fine-grained still water deposits of core AA-05. In addition, the metal peaks of the 20th century, such as the Pb peak at 9 cm depth and Zn peak at 20 cm depth (the latter peak may be associated with pre-WW I zinc tin production; Weiss et al., 1999) were identified. Radiocarbon ages on charcoal and plant fragments were rejected because they show reversals of age due to redeposition processes of charcoal and plant remains in the distal delta floodplain en-vironment. After correction of the geochronological model, the geochemical variability (factor 1 scores) of AA-10 shows a very close correlation with the variations of core AA-05 (Fig. 3; Sect. 4.3).
4.3 Geochemical palaeoflood proxies
The youngest sediments (217–0 cm depth) at the key site AA-05 provide a good opportunity to study flood dynam-ics from alluvial plain sediments and their related mecha-nisms at a high resolution. Seven clusters of coarse-grained flood layers intertongue five organic soil horizons (TOC 4– 11 %) and silt-rich still-water deposits. Figure 3 shows that the log Zr / Ti ratio of core AA-05 (AA-10) samples above
−0.5 (−0.1) correspond to flood layers, thus providing a
palaeoflood proxy. However, the log Zr / Ti ratio of core AA-10 shows a reverse pattern between depths of 156 and 188 cm (1460–1350 cal yr BP; Fig. 2), while the log Sr / Ti ratio indicates a significant positive correlation with flood layers (Sr / Ti > −0.85) and sand fraction (r = 0.72; Fig. 2) throughout the entire record. We stress that the ratios of these stable elements provide information of two kinds: grain size, and provenance of sediments. Zr is frequently enriched in coarse silt and sand in association with quartz (Kylander et al., 2011) which is present in many types of bedrock through-out the Aare catchment. At the same time, zircon is also a tracer for sediment supply from the highest area of the basin (mean altitude: 2528 m a.s.l.) because this heavy min-eral is present in the crystalline rocks such as syenite, granite and amphibolites of late Palaeozoic intrusions. The element Ti, the denominator of these ratios, is related to clay min-eral assemblages and to phyllosilicates located in the para-Mesozoic metamorphic rocks of the central area of the Aare catchment (mean altitude: 2171 m a.s.l.). Finally, Sr values are associated with both carbonates and silicates, as reported by Kylander et al. (2011) and illustrated in Fig. 4.
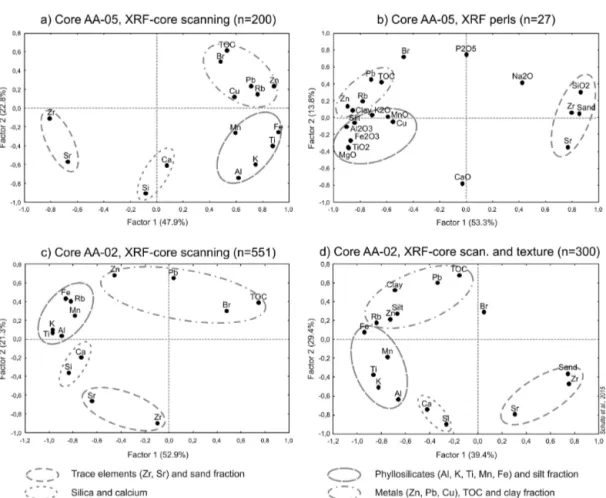
Factor analysis (FA) is a powerful tool for inferring palaeoenvironmental processes from geochemical variables of a sediment record, as exemplified by the data of core AA-05 (Fig. 4a). Factor 1 (F1) explains 47.9 % of the variability of the geochemical properties of the samples measured by XRF core scanning. It is defined by a strong positive loading of Fe, Ti, Rb, K, Al and Mn (phyllosilicate components such as biotite and K feldspars in gneiss and other metamorphic rocks), a strong negative loading of Zr (associated with heavy minerals like zircon and also with quartz) and Sr (associated with carbonates and plagioclase), while the loadings of Si and Ca are not significant. The second factor (F2; 22.8 % of total variance) demonstrates positive loadings of metals (Pb, Zn, Cu) associated with organic material (TOC) and negative loadings of Si, Al, and K, associated with siliciclastic rocks. Factor analysis was also applied to 27 calibration samples in which grain size data and conventional XRF data were obtained (Fig. 4b). The first two factors are defined by an el-ement distribution very similar to that of the FA of scanned XRF samples. Despite the reversals of factors F1 and F2, the groups of the variables are equivalent to the scanned sam-ples and show a noticeable relation to grain size: Zr, Sr and Na2O are related to the sand fraction, phyllosilicates to silt, and metals and TOC to clay. We suggest that there is a litho-logical control of the chemical composition of the samples (Schulte et al., 2009a) because several variables are grouped in characteristic pairs: Pb–TOC (metal–organic complexes), Zn–clay (enrichment due to increased adsorption surfaces), Rb–K2O (K-feldspars), Fe2O3–MgO (biotite, e.g. in gneiss), Sr–Na2O (plagioclase e.g. in quartz diorite; a less close rela-tion) and Zr–sand (heavy minerals in the plutonic area).
These findings coincide with the results of core AA-10. The 2-D plot (not shown) of loadings shows the following groups of variables: metals and TOC associated with the clay
Figure 4. 2-D plots of factor loadings (factor analysis) of chemical major and minor elements, TOC and grain-size fractions of core AA-02
and AA-05 samples.
fraction (soil formation), phyllosilicates related to the silt fraction (metamorphic rocks) and, finally, a group defined by the elements Zr, Sr, (Al) and Si (plutonic rocks and silici-clasts). The loading of the sand fraction is the opposite of all other variables, except for Sr, indicating perhaps a lesser in-fluence of the sand fraction on the chemical composition of samples. Ca is related to hornblende and feldspars.
With regard to core AA-02, factor analyses were ap-plied to three data sets. First, the distribution of variables of scanned samples retrieved from 0–551 cm depth was studied (Fig. 4c). The order of the factors differs from that of the other core sites: the first factor of AA-02 corresponds to fac-tor 2 of AA-05, and vice versa. Facfac-tor 1 of AA-02 (52.9 % of variance, corresponding to F2 of AA-05) is defined by the strong negative loadings of K, Ti, Al, Fe, Rb and Mn and the positive loading of TOC, whereas factor 2 (21.3 % of vari-ance, corresponding to F1 of AA-05) shows Zr and Sr on one side and TOC and metals on the opposite side. Second, FA of 26 calibration samples (conventional XRF) showed the typical element distribution of the Hasli–Aare Delta flood-plain according to content percentages: Fe, Al, Ti and Mn
(phyllosilicates, metamorphic rocks) related to the silt frac-tion; Zr (quartz diorite-syenite, granites) related to the sand fraction and, lastly, a group of Sr, Na and Si (plagioclase, quartz diorite) with weak loadings. Finally, these outcomes are supported by additional FA computation of XRF scan-ning and grain-size fractions of approximately 300 samples collected from 251 to 551 cm depth (Fig. 4d).
To conclude, the analysis of the geochemical records of the cores AA-05, AA-10 and AA-02 provides evidence that the chemical composition of the floodplain deposits is influ-enced by (1) grain size, (2) the lithology of the source area, and (3) soil formation (organic material, leaching of carbon-ates and redox processes). The following areas of provenance were detected by FA: the southern catchment area comprised plutonic bedrock, the central area a predominance of meta-morphic rocks, and (though less clearly) the northern area presented carbonate-rich bedrock.
Figure 5. Comparison of the (a) δ18O isotope record from the Greenland Ice Sheet Project 2 (GISP2; Stuiver et al., 1997) and (b) factor 1 scores of scanned core AA-02 samples from 2600 to 1600 cal yr BP (3-data-smoothed, approximately 9 years). Correspondence of cool climate pulses and siliciclasts (negative values) are assigned by dashed lines. Maxima and minima of both series (δ18O and factor 1) were labelled with characters from “a” to “ad”. (c) Scores of scanned core AA-02 samples and grain size are plotted for comparison. (d) Compar-ison of maximum and minimum local events a–ad (N = 30; (a, b)) of the δ18O isotope record from the Greenland Ice Sheet (x axis; GISP2; Stuiver et al., 1997) and factor 1 scores of scanned core AA-02 samples (y axis) from 2600 to 1600 cal yr BP. Error bars shown at ±5.0 % for factor 1 scores according to14C chronology after calibration and at ±1.0 % for18O (GISP2) according to Stuiver et al. (1997) indicate that the timing of the selected events is consistent. (e) Scatter plot between δ18O and F1 scores of maximum and minimum local events a–ad.
4.4 Correlation and periodicities
When the scores of the first factor are plotted against depth, multiple aggradational pulses inside the overbank deposits are detected, which indicate changing sedimentation envi-ronments. For example, aggradational pulses in core AA-05 (0–213 cm depth) are characterized over the last 700 years by the increase in the phyllosilicate content (metamorphic rocks) and the decline in elements such as Zr and Sr as-sociated with granite, quartz diorite and syenite (intrusive rocks at 2528 m a.s.l. mean altitude) as shown by negative
scores of factor 1 (Fig. 3). These negative scores coincide with peaks of Zr / Ti ratios and with a total of 26 coarse-grained flood layers, forming seven episodes: 1250–1350, around 1390, 1420–1480, 1550–1620, 1650–1720, 1762 and 1811–1851 cal yr AD. Eight of these flood layers show Ca / Ti and CaCO3 peaks (Fig. 2) pointing to increased discharge contribution from catchment areas with calcareous bedrock (lower Aare catchment, mean altitude: 1578 m a.s.l.) dur-ing floods that occurred around 1390, 1480, 1660, 1700 and 1760 cal yr AD.
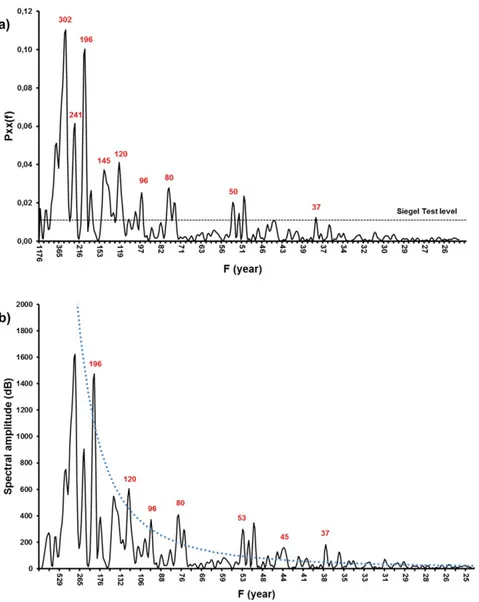
Figure 6. (a) Harmonic analysis of the composite palaeoflood record of the Hasli–Aare Delta plain. Dotted line represents critical level for
the Siegel test and significant frequencies are shown in years. (b) Red-noise spectra of the composite palaeoflood record. Dotted line shows false-alarm level. Significant frequencies are shown in years.
Figure 3 illustrates a significant correlation between the clusters of flood layers detected in core AA-05 and the Aare flood episodes recorded by historical sources (Sect. 4.5). However, the magnitude of the Zr / Ti peaks does not sys-tematically coincide with the historical flood intensity, for the following reasons: firstly, some flood layers are defined by higher carbonate contribution and decreased Zr values; secondly, there are changes in the distance from the main channel and in the extension of the flooded area; and, thirdly, historical flood series may also include a range of uncertain-ties.
The correlation between cores AA-10 and AA-05 and also with the historical data (Fig. 3) provides arguments for the validity of flood reconstruction in the Hasli–Aare floodplain. However, the amplitude of factor 1 and the total number of 13 flood layers in core AA-10 are lower than in core AA-05,
indicating a lower sensitivity of the floodplain records, due to the influence of flooding by Lake Brienz on the one hand (e.g. deposition of suspended load during the AD 1390 and 1762 flood episodes; see Sect. 4.5) and to the change in the distance from the channel as a consequence of displacement of delta lobes on the other. The lowering of the outlet of Lake Brienz by 3.5 ft. (1 m) between AD 1852 and 1862 (Willi, 1932) may have decreased the blocking effect on the river drainage caused by high lake levels. Since the termination of the Hasli–Aare correction project in AD 1875, geochemical and grain size flood proxies of both core sites have been no-ticeably masked because sedimentation processes have been reduced by structural flood mitigation (Sect. 4.5).
To study the flood dynamics prior to periods of persis-tent human impact on landscape, as shown by palynological data (falls in arboreal pollen and mesic tree pollen
percent-ages; Schulte et al., 2009a), we focused our analysis particu-larly on core AA-02, which provides high-resolution records from 2600 to 1600 cal yr BP. Figure 5 illustrates the visual correlation between the sedimentary proxies of core AA-2 and the δ18O values of the GISP2 record of the Greenland Ice sheet (Fig. 5a; Reimer et al., 2004) over a time slice of 1000 years. Figure 5b represents the variability of scores of factor 1 (XRF-scanned samples) defined by siliciclasts (neg-ative scores) and organic content (positive scores). Figure 5c shows scores of factor 2 (XRF-scanned samples and grain-size fractions), where negative scores correspond to Si, Sr, Ca, Zr and the sand fraction, whereas positive scores are associated with TOC and metals (Sect. 4.3, Fig. 4d). The curves show a very similar pattern, suggesting that the higher silicate content and elements associated with plutonic rocks from the highest catchment correlates with a cooler climate in Greenland, whereas soil formation and lesser flooding cor-relate with milder climate pulses.
Finally, Fig. 5d compares the maximum and minimum peaks between δ18O and factor 1 and are labelled with characters from “a” to “ad” (Fig. 5a, b). This technique is widely used in the interpretation of palaeoclimate proxies (e.g. Pèlachs et al., 2011). When we compare the timing of local minima and maxima of the two series, the time lags be-tween the respective peaks are always within the dating error intervals. Thus the timing of events in both records is consis-tent. The scatter plot (Fig. 5e) of F1 scores versus δ18O shows a lineal distribution of maximum and minimum local events a–ad. Two groups can be differentiated: the first group is re-lated to maximum values in both variables and documents warm climate and organic-rich sediments; the second group corresponds to minimum values of the variables and evidence cool climate conditions and siliciclastic-rich sediments.
Although trends in geochemical proxies appear to show a close relationship with the climate proxy, it is difficult to evaluate in all cases whether a flood layer corresponds to precise climate pulses (minima or peaks). The reason for this is the inadequate calibration (e.g. for the period 450– 700 cal yr BP) or total lack of any calibration by histori-cal sources (before 700 histori-cal yr BP). Furthermore, the question arises of whether there may be time lags between the two data series; for example, δ18O values may record delays from 0 to 40 years relative to the 14C production rate (Stuiver et al., 1997; Versteegh, 2005).
Because of the quasi-cyclic pattern of the geochemical delta plain proxies and the possible correlation with the Greenland Ice record (Fig. 5) and the reconstructed sum-mer temperature and spring precipitation of the Alps (Bünt-gen et al., 2011), spectral analyses were performed. The har-monic analysis (Fig. 6a) was applied to F1 scores from AA-05, F1 scores from AA-10, F1 and F2 scores from AA-02 and, finally, to the composite palaeoflood record (AA-05 and AA-02) to detect periodicities in the time series considering noise. The valid signals detected were above the Siegel test level (Fig. 6a, b). Peaks of return intervals < 60 years were
not considered due to the magnitude of the uncertainty inter-vals in fluvial deposition environments when calibration was not possible.
According to the results (Table 2), the sedimentary record of core AA-2 shows periodicities of around 60, 80, 100 and 205 years for the period from 2600 to 1600 cal yr BP. With regard to the last 700 years, the spectral analysis of the AA-05 record suggests the existence of three cycles: 80, 96 and 196 years. Factor 1 of core AA-10 shows periodicities of 60, 86, 102 and 184 years. All the cycles obtained are very sim-ilar to the periodicities obtained from the GISP2 record (69, 81, 105 and 208 years; Stuiver et al., 1997), the total solar irradiance (75, 86, 105, 129 and 207 years; Steinhilber et al., 2009) and the North Atlantic Oscillation (NAO; 65, 80 and 100 years; Luterbacher et al., 2002). Dendrochronolog-ical series provide cycles of reconstructed spring precipita-tion at intervals of 73, 130 and 200 years (Büntgen et al., 2011). The appearance of the Gleissberg (∼ 81-year cycle), the ∼105-year and the Suess cycles (∼211-year cycle; Ver-steegh, 2005) in the data series analysed provides evidence that the influence of solar forcing can be considered as a ma-jor driver of floods in the Aare catchment.
4.5 Historical flood series
The reconstruction of the Hasli–Aare floods yield a total of 35 flood damage events for the period 1480–2012 (Fig. 7), with flood intensities ranging from 0.5 to 4.5 according to the classification of Table 1 and Eq. (1). Thirty-three of the 35 reported events (94 %) occurred during the extended sum-mer period (JJAS). This temporal distribution is consistent with the findings of Weingartner et al. (2003), who anal-ysed instrumental flood data from 85 alpine catchments in Switzerland. Five extraordinary episodes (AD 1342–1343, 1480, 1551, 1762 and 1831 (Fig. 7) were defined as catas-trophic floods (M ≥ 3.5), and 11 events as severe floods (2 ≤ M < 3.5), 3 of which reached intensity level 3. Finally, 21 small and medium floods (M < 2) were recorded after AD 1855. Before AD 1855 no records of M < 2 were ob-tained, because minor damage was not recorded in written sources. In contrast to this lack of flood data, a cluster of nine minor floods between AD 1855 and AD 1875 can be inter-preted partially as an artefact which reflects a turning point in the human–environment interaction regarding hydrologi-cal hazards. Firstly, after the destructive events of AD 1831 and 1851, local residents were more sensitive to hydrolog-ical hazards; secondly, they were more likely to report mi-nor or medium flood damage in order to force the cantonal and state authorities to fund the creation of a solid river em-bankment; and, thirdly, floods easily eroded the infrastruc-ture of the Hasli–Aare correction project during the period of its construction from AD 1867 to 1876 (Willi, 1932) and were therefore reported and measured (AD 1875) by engi-neers (Hählen, 2007).
From AD 1480 to 2012, 15 severe and catastrophic floods (M ≥ 2) in the Hasli–Aare were caused by three rainfall episodes, three rainfall–snowmelt episodes, three thunder-storm events and one rainfall episode with thunderthunder-storm (five events without information). All catastrophic floods (M ≥ 3.5) recorded not only extraordinary flooding in the lower Hasli Valley floor but also damage in one or more headwater subcatchments and/or tributaries. The extensive impact of the AD 1342–1343, 1480, 1762 and 1831 floods in the Hasli–Aare catchment coincides with the greater volume and spatial distribution of flood damage in Swiss catchments (Röthlisberger, 1991). Moreover, these data indicate episodes of long lasting rainfall or rainfall plus snowmelt as a conse-quence of higher temperatures and snowlines. The cause of the extraordinary AD 1551 event in the Hasli Valley is not known, but the lack of damage in other Swiss catchments may suggest local heavy precipitation. A scenario of a single glacier outburst flood is unlikely because from the historical and instrumental data of the Lütschine catchment we can as-sume that flood crests did not produce severe damage in the deltas after spreading approximately 20 km.
The magnitude of the damage and extent of flooding in the Hasli Valley is illustrated by the following examples. According to the historical sources, the most catastrophic floods destroyed entire villages – Bürglen, Tschingeln, Hin-terluchena and Niederhufen in AD 1551 (Aare) – or parts of villages as in Balm in AD 1551 (Aare) and Meiringen in 1342–1343, 1762 and 1851 (Alpbach). Flooding of larger areas of the lower Hasli Valley floor corresponded to flood intensities M ≥ 3; the area was described as a “continuous lake” (AD 1851), where “boats crossed the highest fences” (AD 1762) or “only trees and stables were visible” (1867; Willi, 1932; Kurz and Lerch, 1979; Mätzener, 1984). Many of these floods introduced important changes in the flood-plain morphology, particularly shifts of the Aare main chan-nels (AD 1499, 1762, 1831), and caused massive aggrada-tion of gravel, stones and boulders. Both floodplain dynam-ics (Fig. 1) were documented by historical maps published by Mirani in AD 1766, Wyss in 1813 and Dufour in 1876 and by geological cross sections (Llorca and Schulte, 2014). Mass destruction of houses and loss of farmland, as in AD 1342– 1343, 1499, 1551, 1762 and 1831, generated famine, aban-donment, migration, requests for assistance and subsequent reorganization.
An important issue in the research undertaken is the ques-tion of whether historical floods are reproducible by the proxy data from sediment records. No fewer than 13 of the 15 severe and catastrophic events which occurred before the termination of the Hasli–Aare correction in AD 1875 are also detected by coarse-grained flood layers and log(Zr / Ti) peaks in core AA-05 (Fig. 3b) and to a lesser extent also in core AA-10 (Fig. 3c and d), where the influence of Lake Brienz is noticeable. For example, although the AD 1762 flood is the largest event recorded in the Hasli Valley dur-ing the last half millennium, no coarse-grained flood layer
T able 2. Comparison of periodicities of palaeoclimate time series and alpine delta flood proxies (Bernese Alps). (1) Reimer et al. (2004); (2) Steinhilber et al. (2009); (3) Stui v er et al. (1997); (4) Lutherbacher et al. (2002); (5) Büntgen et al. (2011); (6) Peña and Schulte (2014). Solar Nort h Atlantic Europe Alps Lo wer Hasli V all ey (Aare) Switzerland Proxy Cycles δ 14 C (1 ) TSI (2 ) GISP 2 Reconstr . T ree ring T ree ring Compos. AA-2 AA-5 AA-10 Hasli–Aare Flood damage inde x (6 ) δ 18 O (3 ) N A O (4 ) T (4 ) (JJ A ) T (5 ) (JJ A ) T (5 ) (JJ A ) P (5 ) (AMJ ) – F actor 1 F actor 1 F actor 1 Flood intensity Period (cal yr BP) 1575–4785 2600 1575–4785 450 650 650 1200 950 2600 2600–1600 650 650 470 208 Periodicities – – 69 65 61 64 65 – – 63 – 60 60 – Gleissber g 81 86 81 80 78 78 – – 80 84 78 86 89 – 104 105 105 100 110 – – – 96 100 95 102 – 105 -129 – – – – 130 139 120 – – – – – Suess 211 207 208 – – – 200 192 196 205 190 184 [175] –
was detected in core AA-10 and only a minor change was observed in the geochemistry (factor 1). This contradiction can be explained by the rise of Lake Brienz (Willi, 1932) and flooding of the distal area of the delta, meaning that only suspended fine material was deposited at the AA-10 site. The area of fine material deposition and delimitation of the flood-ing can be easily traced from the SPOT satellite (30 August 2005; Swisstopo) images, taken 6 days after the AD 2005 flood, and from oblique aerial photographs taken on the day after the flood.
The flood dynamics in the Hasli Valley changed signifi-cantly after AD 1875, as illustrated in Figs. 7 and 8. For cli-matic and anthropogenic reasons, floods of intensities M ≥ 1 disappeared completely between AD 1876 and 1976. First, a flood gap in Swiss hydrological time series is reported by Röthlisberger (1991), Schmocker-Fackel and Naef (2010) and Stucki et al. (2012). Pfister (1999) attributed the decrease of floods to long-term summer precipitation minima between AD 1935 and 1975. Peña and Schulte (2014) stress the lack of extreme weather conditions from AD 1944 to 1972 in Switzerland as a consequence of the predominance of neg-ative Summer North Atlantic Oscillation (SNAO). Second, according to Gees (1997), river regulation, embankments and reservoirs substantially reduced smaller and medium floods after AD 1854. In the Hasli Valley several actions contributed to the flood mitigation in the Aare River system (Sect. 4.1): lowering of the lake level in AD 1862, the channelling of the Aare riverbed (AD 1875), the commissioning of intercon-nected reservoirs and power plants since AD 1932 and, more recently, the construction of retention basins (AD 2013). For example, in AD 1875, the year the Hasli–Aare correction was completed, a flood with a discharge of 351 m3s−1 did not produce any damage or flooding in the lower Hasli Valley, whereas 1 year before, in AD 1874, bridges were destroyed and two breaches in the new embankment were eroded, even though the flood level of the Aare River was a foot lower than in AD 1875 (Hählen, 2007).
4.6 Estimations of historical flood discharges
Determining the historical flood discharges that defined the damage threshold (Fig. 7) is a challenging task and in this pa-per we present only some rough estimates. From the histor-ical data and the discharge measurements by engineers dur-ing the construction of the embankment in AD 1875 (Hählen, 2007) we can assume that before the termination of the Aare correction in AD 1875 the level of 351 m3s−1(a conserva-tive estimate) produced damage of intensity MAA≥1. Since AD 1875, flooding of this magnitude disappeared from the data series until AD 1977 and only in tributaries and head-water subcatchments was any damage noted, and then only on a small scale (MAA=0 and Mi> 0). The new threshold of flooding in the lower Hasli is located approximately be-tween 360 and 370 m3s−1(MAA=1). For example, during the flood of 10 October 2011 (367 m3s−1) the water slightly
overtopped levees at Unterbach and caused small pounded lakes (M = 1). However, since AD 1932 several connected reservoirs have been in operation for hydroelectric power generation. The floods that occurred during the spring (e.g. the flood of 12 May 1999) and early summer were retained for the most part in the headwater of the upper Hasli Valley because the reservoirs recorded lower levels due to electricity production during the winter months. Through late summer, retention capacity is lower (the reservoir level is high, due to snowmelt), but it can still contribute to flood reduction as it did in AD 2005 (MAA=2 and Mi =1, then M = 2 + 0.5 – see Eq. (1) – when the level was low due to inspection work) and in AD 2011 (MAA=1; dry autumn; Richli and Andres, 2012). Flood levels, reconstructed from lichenometric dat-ing at three sample profiles downstream of the Räterichsbo-densee Dam during summer AD 2014 (results not included in this paper), indicate that floods still affected the upper Hasli– Aare subcatchment after AD 1932, but that the flood levels of known floods are much lower than in AD 1922, the year of the last major flood before the construction of the reservoirs. Under the present river configuration, the AD 2005 event with a discharge of 444 m3s−1corresponded to an intensity of 2.5, but if it had occurred before AD 1875 it might have reached intensity 3.5, in which case it would have qualified as catastrophic. According to the measurements and estimations of the hydroelectric power company Kraftwerke Oberhasli AG, the retention of the reservoirs in the Hasli–Aare catch-ment ascended to 120 m3s−1during the peak discharge of 21 August 2005 (21:00–22:00). Without the influence of these reservoirs the possible peak discharge at the gauge station Brienzwiler may have reached around 563 m3s−1 (Fig. 7). Likewise, various events of intensity 1 and 1.5 may corre-spond to intensities M ≥ 2 and as a result may have been con-sidered as severe events. Interestingly, during the 1860s en-gineers originally planned a channel capacity of 510 m3s−1 (Hählen, 2007) which may have marked the possible magni-tude of catastrophic floods. To conclude, the changing con-figuration of the mitigation structures and retention capaci-ties makes it difficult to homogenize the flood intensicapaci-ties se-ries before and after river correction and reservoir construc-tion, at least in the data series analysed.
4.7 Evidence of the AD 1342 and/or 1343 flood episodes The catastrophic flood episode of AD 1342 and/or 1343, cited in the German literature as the “Magdalena flood”, is described as the outstanding flood episode in central Europe during the last millennium. The number of pulses, their ex-act dates and drivers are controversially discussed in Bork and Bork (1987), Röthlisberger (1991), Glaser (2001), Kiss (2009), Wetter et al. (2011), Zbinden (2011) and Herget et al. (2014). Whereas in central and northern Switzerland historical information about this flood wave has been anal-ysed (Pfister and Hächler, 1991; Siegenthaler and Sturm, 1991; Röthlisberger, 1999; Wetter et al., 2011), little is
Figure 7. Flood chronology of the Aare River in the Hasli Valley from AD 1480 to 2012. (a) Flood intensities reconstructed from
docu-mentary and geomorphological evidence (blue columns) and instrumental data (red columns). Event intensities M (left scale; referring to Table 1 and Eq. 1) are estimated for the period AD 1480–2012, whereas maximum annual discharges > 300 m3s−1(right scale) recorded at the Brienzwiler gauging station are valid for the period AD 1908–2012. Discharge measurements in AD 1875 were conducted on-site by engineers of the Aare correction project. Measured discharges and event intensity level are influenced by structural mitigations such as river embankments since AD 1875 and retention capacities of reservoirs since AD 1932 as in the case of the 2005 flood (arrows). Triangles represent damage to the Sankt Michael church by flooding and severe aggradation caused by the Alpbach River. (b) Hydro-climatological cause of floods (legend below) according to historical written sources, WSL flood data bank, expert reports, newspapers and precipitation data. (c) Composite flood frequencies. Data as in (a) .
known about its impact in western Switzerland. Turbidite beds recorded in the sediments of Lake Urner and dated be-tween 990–1250 and 1270–1420 cal yr BP (2σ ; Siegenthaler and Sturm, 1991) were probably deposited by the AD 1343 flood in the River Reuss.
There are no written reports of the AD 1342 and/or 1343 event in the Hasli Valley, but interesting evidence can be inferred from sedimentary and geoarchaeological data. Al-though changing distances between source and deposit (e.g. shifts of river channels) influence the deposition environ-ment and nature of sedienviron-ments, it is striking that the flood beds identified in core AA-05 at 211–200 cm depth and in core AA-10 at 197–189 cm show the highest scores of fac-tor 1, high sand content (85 %) and log(Zr / Ti) values. Or-ganic beds just below and above the coarse-grained overbank deposits are dated by radiocarbon to 1179–1269 and 1279– 1394 cal yr BP (2σ ). These ages are quite consistent, but they do not allow distinguishing a priori between different catas-trophic flood events, such as the AD 1275, 1342 and/or 1343 episodes (Röthlisberger, 1991).
However, geoarchaeological data recorded from excava-tions of the Sankt Michael church in the village of
Meirin-gen, located on the alluvial fan of the Alpbach, indicate sev-eral construction and restoration phases (phases I–XIII) of which some are related to flood events (e.g. AD 1733 and 1762). According to Gutscher (2008) the church was dam-aged twice by destructive floods just before AD 1351, the date engraved on the church bell, but no particular flood event was named. The first flood damaged the northern wall (phase VI according to Gutscher, 2008) which was subsequently re-built (phase VII). During a second flood, massive aggrada-tion filled the church with debris up to a height of 3.5 m. In this case the ancient church was not excavated, due either to the volume of material or to the short recurrence interval of the events. Consequently, the new church floor was built right on the flood sediments (phase VIII). Gutscher (2008) argues that the two floods occurred within a very short time because the archaeological findings showed that the church walls were not plastered with mortar after the first event; this would have been highly unusual for a church in the Bernese Oberland during the 14th century.
To conclude, the sedimentary data of the floodplain and the geoarchaeological findings of the Sankt Michael church suggest that the AD 1342–1343 flood episodes very likely
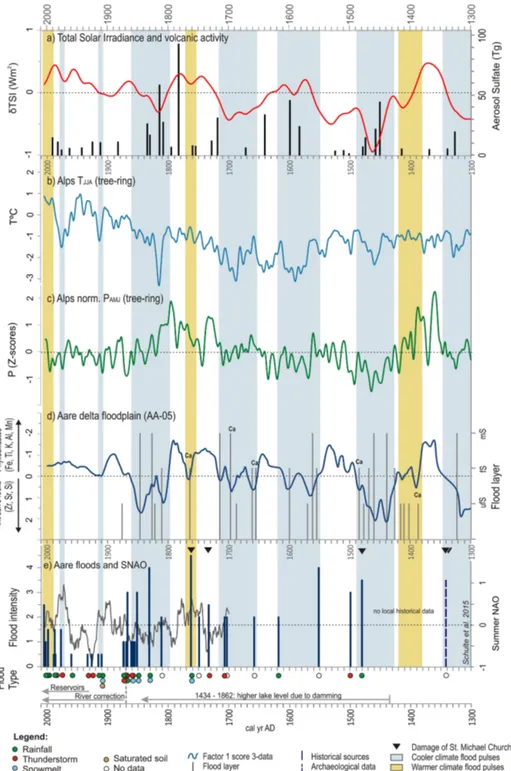
Figure 8. Comparison between historical flood reconstruction of the Hasli–Aare and solar and volcanic activity and climate proxies (1300–
2010 cal yr AD). (a) 40-year averaged variations of total solar irradiance (Steinhilber et al., 2009) and annual stratospheric volcanic sulfate aerosol injection, Northern Hemisphere (Gao et al., 2008). (b) JJA temperature anomalies (13-year Gaussian low-pass filter) in the European Alps reconstructed from larch density series (Büntgen et al., 2006). (c) AMJ precipitation anomalies (13-year Gaussian low-pass filter) in the European Alps reconstructed from larch density series (Büntgen et al., 2006). (d) Sedimentary palaeoflood proxy from the Aare Delta plain in the lower Hasli Valley (this paper). Factor 1 scores (3-data centred moving average equivalent to 13-year resolution) of chemical composition of core AA-05 samples and coarse-grained flood layers (ufS: silty fine sand; fS: fine sand; mS: middle sand). (e) Historical flood chronology of the Aare River (Hasli Valley) from documentary, archaeological and geomorphological evidences like in Fig. 7 (this paper). Triangles represent damage to the Sankt Michael church by flooding and severe aggradation caused by the Alpbach River.
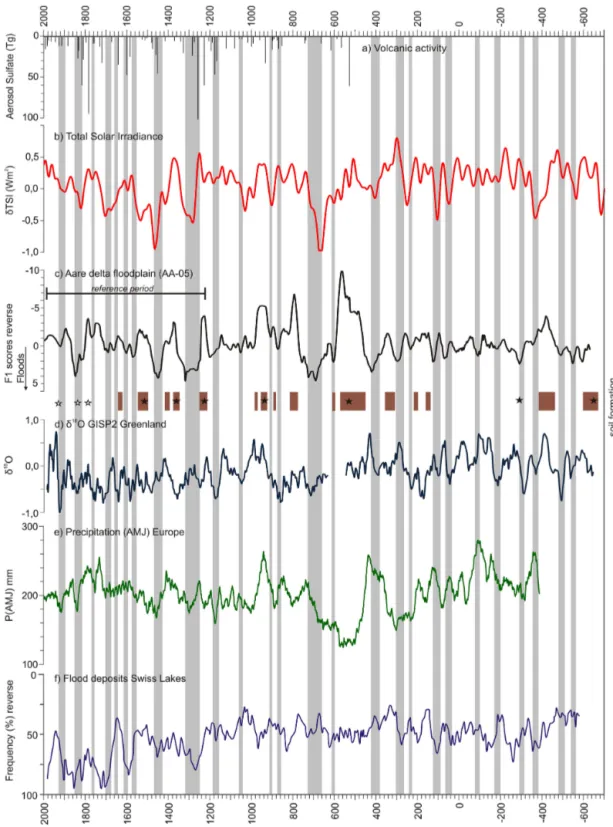
Figure 9. Comparison between reconstructed palaeofloods in the Hasli Valley and solar and volcanic activity and climate proxies from
600 cal yr BC to 2000 cal yr AD. (a) Annual stratospheric volcanic sulfate aerosol injection, Northern Hemisphere (Gao et al., 2008). (b) 40-year averaged variations of total solar irradiance (Steinhilber et al., 2009). (c) Composite sedimentary palaeoflood proxy at a 21-40-year resolu-tion from the Aare Delta plain in the lower Hasli Valley (this paper). Factor 1 scores of chemical composiresolu-tion of delta plain samples. Peat and organic soils are shown by dark shaded rectangles. Stars indicate the stratigraphical position of datings. (d) δ18O of the GISP2 ice core from Greenland (Stuiver et al., 1997) at a 21-year resolution. (e) 21-year smoothed AMJ precipitation anomalies in central Europe reconstructed from oak ring width series (Büntgen et al., 2011). (f) Flood chronology derived from flood deposits of 10 lakes from the northern slope and central area of the Swiss Alps (50-year moving average; Glur et al., 2013).