The definitive version is available at
http://www3.interscience.wiley.com/journal/118538252/home
(http://onlinelibrary.wiley.com/doi/10.1111/1475-4754.t01-1-00052/abstract)
DOI: 10.1111/1475-4754.t01-1-00052 (http://dx.doi.org/10.1111/1475-4754.t01-1-00052)
ALTERATIONS OF Na-, K-, AND Rb- CONCENTRATIONS IN MYCENAEAN POTTERY AND A PROPOSED EXPLANATION USING X-RAY
DIFFRACTION
J. Buxeda i Garrigós1, H. Mommsen2, A. Tsolakidou1
ALTERATIONS OF Na-, K-, AND Rb- CONCENTRATIONS IN MYCENAEAN POTTERY AND A PROPOSED EXPLANATION USING X-RAY
DIFFRACTION
J. Buxeda i Garrigós1, H. Mommsen2, A. Tsolakidou1
1- ERAUB, Dept. de Prehistòria, Història Antiga i Arqueologia, Universitat de Barcelona, C/ de Baldiri i Reixac, s/n, 08028 Barcelona (Catalonia, Spain) 2- Gruppe Archäometrie, Institut für Strahlen- und Kernphysik der Universität Bonn,
Nußalle 14-16, D 53115 Bonn (Germany)
One of the most important reference groups for Mycenaean pottery is the Mycenae/Berbati (MB). In several studies, a second group has been identified (MBKR). The chemical compositions were similar to MB, but with important differences in Na, K, and Rb content. The present study suggests that these differences are due to selective alteration and contamination processes indirectly determined by the original firing temperature. Therefore, groups MB and MBKR should be considered as a single reference group.
KEYWORDS: BRONZE AGE, MYCENAE, BERBATI, POTTERY, NEUTRON ACTIVATION ANALYSIS, X-RAY DIFFRACTION ANALYSIS, ALTERATION, CONTAMINATION, FIRING TEMPERATURE, ALKALI ELEMENTS
1. INTRODUCTION
To date, several reference groups have been established as an outcome of a large research program on archaeometric characterization of Mycenaean pottery by means of Neutron Activation Analysis (NAA) conducted by the Archaeometry Group of Bonn University. Of these, one reference group is especially important because of the archaeological implications it has for the Mycenaean civilization and its trade relations. The chemical pattern of this group is found in a large number of Greek Bronze Age pottery sherds from the Argolid. Because of the geographical distribution of its members it was thought to come from a workshop somewhere in the Northern Argolid
and was called the Mycenae/Berbati (MB) pattern (Mommsen et al. 1988). Meanwhile, measurements of several wasters from the Mycenaean kiln site at Berbati supplied by B. Wells assigned this pattern to this site of production. Pottery from this group has been found not only in the Argolid, but also in many other sites in Mainland Greece and in several sites in Cyprus, Palestine, and Egypt (Mommsen et al. 1992, Mommsen and Maran, in press) and even in Spain (Mommsen et al. 1990), which suggests that this pottery was part of a large trade network. However, in several sites a second, smaller group, called MBKR, with a composition similar to the MB group, but with important differences in Na, K and Rb concentrations has also been found (Mommsen et al. 1996). Following Asaro (1977), the hypothesis for the existence of this group has been based on some chemical replacement in the raw clays. Therefore, this MBKR group should also be assigned to a Greek origin, and it may also have been involved in the MB trade network.
An alternative explanation for this MBKR group arose from the possibility that the chemical differentiation from the MB pattern was produced as the result of an alteration and contamination process during burial. Similar examples involving alkali elements have been observed in other cases, even in production centers (Buxeda 1999, Buxeda et al. in press). In order to study this alternative hypothesis, several individuals from each group have been examined by X-Ray Diffraction (XRD).
2. SAMPLING, NAA RESULTS AND XRD ANALYTICAL ROUTINE
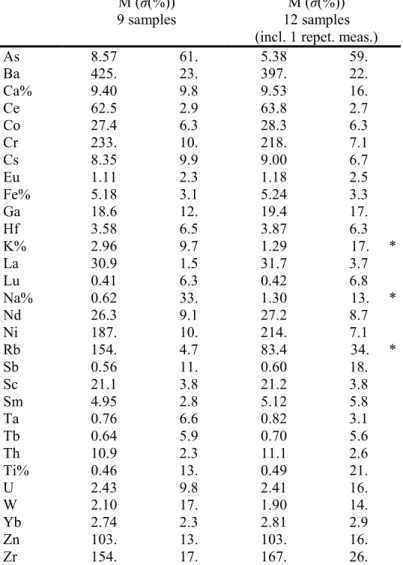
Nine individuals exhibiting the MB pattern and eleven exhibiting the MBKR pattern were selected depending on the amount of sample powder left. The individuals studied were found at the sites of Tiryns (Argolid, Greece) (Mommsen et al. 1988), Berbati (Argolid, Greece) (Mommsen et al. 1988), Prophitis Ilias (Katsingri, Argolid, Greece) (Mommsen et al. 1994), Kirra (Delphi, Greece) (unpublished results), and Qantir (Nile Delta, Egypt) (Mommsen et al. 1996; Mountjoy and Mommsen to be published). In Table 1 the average concentration data for the 9 and 11 samples, respectively, are recorded for 30 elements, after a best relative fit to the group mean values correcting for dilutions and experimental errors such as neutron flux inhomogeneities. The elemental values agree except for Na, K, and Rb which show large deviations (If the values of group MBKR are matched to group MB by a best relative fit factor of 0.97 (3% down), all values are similar inside ± 1 σave = average spread = average standard deviations
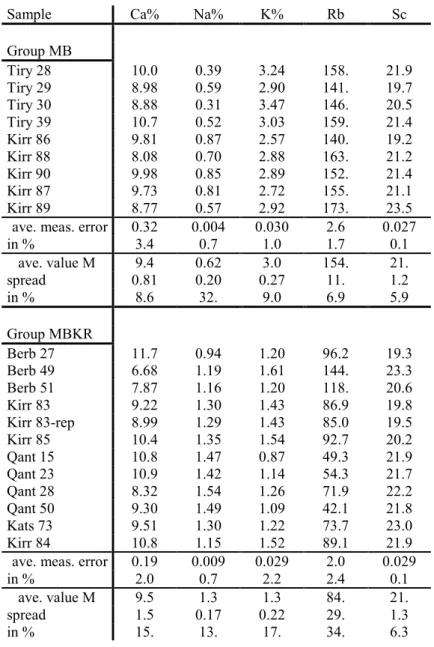
except for these three elements). In the group MBKR the large spreads of K and Rb indicate strong concentration dispersions whereas in the group MB the usual dispersions of these elements are encountered. Na exhibits large spreads in both groups, although in group MB it is larger than in group MBKR. The data for Na, K, Rb, Sc, used below in the raw data transformation, and Ca are listed in Table 2. Both groups, MB and MBKR, must be considered as calcareous pottery, i.e. pottery whose CaO content is over 5-6 %.
The mineralogical composition of all individuals in the ‘as received state’ (ARS) was determined by means of XRD, using about 100 mg of the same powders prepared for NAA analysis. Measurements were performed using a Siemens D-500 diffractometer working with the Cu Kα radiation (λ=1.5406 Å), and monochromator graphite in the diffracted beam, at 1.2 kW (40 kV, 30 mA). Spectra were taken from 4 to 70°2Θ, at 1°2Θ/min (step size=0.05°2Θ; time=3 s). Moreover, individual Tiry30 was chosen for a thermodiffractometric experiment, using the Siemens D-500 diffractometer equipped with a high temperature chamber. Several spectra were taken at room temperature, 600, 700, 800, 850, 900, 950, 1000, 1050 and 1100°C. A rate of 100°C/h was employed, and the temperature was maintained for 1 h before the spectra were recorded. The evaluation of crystalline phases was carried out using the DIFFRACT/AT program by Siemens, which includes the Joint Committee of Powder Diffraction Standards (JCPDS) data bank.
3. DISCUSSION OF XRD RESULTS
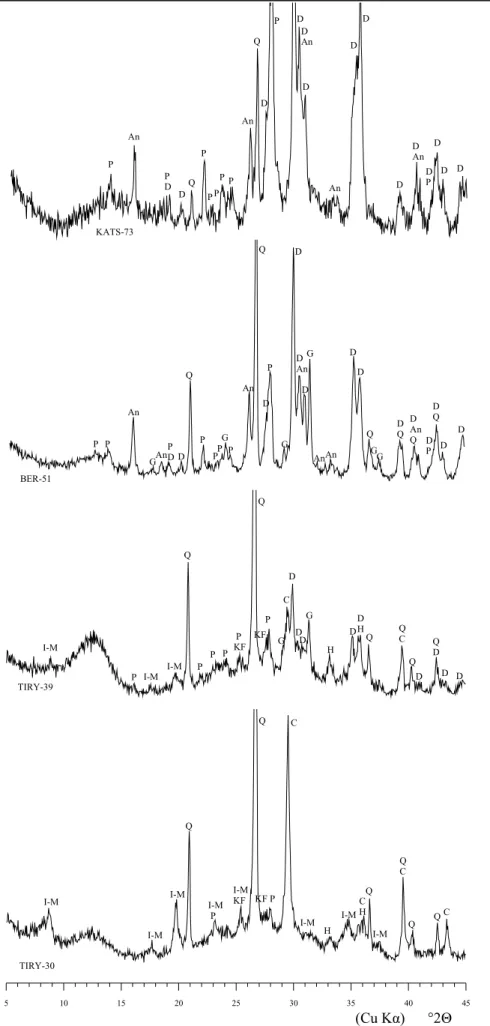
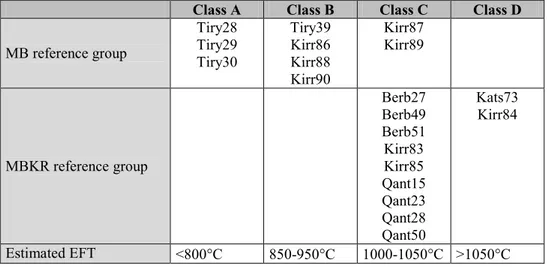
The observation of the ARS diffractograms from both groups reveals important differences. In fact, four different classes, which account for all individuals, can be proposed according to the observed mineralogical phases (Table 3). Typical diffractograms of these classes are shown in Figure 1.
Class A is represented by the diffractogram of individual TIRY-30 (group MB) (Figure 1, bottom). It exhibits quartz (Q) and calcite (C) as the most intense peaks. In addition, important peaks are observed that correspond to phyllosilicates of the illite-muscovite (I-M) type. Moreover hematite (H), alkali feldspars (KF) and plagioclases (P) are also present, but with peaks of lower intensity. Individuals TIRY-28 and TIRY-29 (both from group MB) are also ascribed to this class. All individuals in class A exhibit a pale orange color. Class B is represented by the diffractogram of individual TIRY-39
(group MB) (Figure 1, middle down). Here, illite-muscovite and calcite peaks show less intensity, while pyroxene (D) and gehlenite (G) peaks are clearly observed and can be related to firing phases which typically crystallize after the advanced decomposition of some primary phases, mainly clay minerals and calcite in calcareous pottery. Additionally, hematite peaks are also more intense, and this is related to the intense orange color of the individuals in class B. Individuals KIRR-86, KIRR-88 and KIRR-90 (all three from group MB) are also ascribed to this class. Class C is represented by the diffractogram of individual BER-51 (group MBKR) (Figure 1, middle up). These individuals exhibit a complete decomposition of illite-muscovite and calcite, and an important development of pyroxene, gehlenite and plagioclase. Alkali feldspar is no longer observed, either because the important development of plagioclase overlaps its characteristic peaks or because they had decomposed. Hematite is not observed either, even if an overlap can exist with analcime (An). The latter, which is a sodic zeolite, can be clearly observed in all individuals of this class except for individuals KIRR-87 and KIRR-89 (both from group MB). The rest of the individuals ascribed to this class (BERB-27, BERB-49, BERB-51, KIRR-83, KIRR-85, 15, 23, QANT-28 and QANT-50) belong to the group MBKR. Finally, class D is represented by the diffractogram of individual KATS-73 (group MBKR) (Figure 1, top). This class presents the most pronounced differences. Here, the most intense peaks correspond to pyroxene and plagioclase. Neither gehlenite, nor hematite are observed, and quartz exhibits very low intensity. Analcime is also present with clear peaks. Individual KIRR-84 is also ascribed to this class, and belongs to group MBKR too. All individuals ascribed to classes C and D exhibit a yellowish or greenish color.
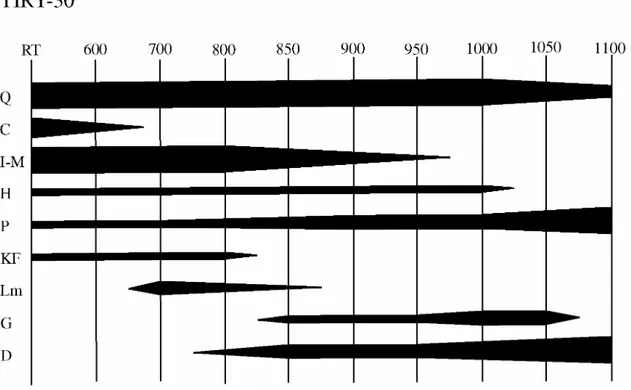
The four proposed classes seem to be related to different firing temperatures in calcareous pottery (Maggetti 1981, Maniatis et al. 1981), in such a way that the firing temperature should increase from class A to D. In order to confirm this possibility, a thermodiffractometric experiment was carried out on individual TIRY-30, using the same powder prepared for NAA analyses. This individual was selected because it is ascribed to class A, which is supposed to be related to the lowest firing temperatures for the ensemble of studied individuals. The results are summarized in Figure 2. As can be seen, calcite is completely decomposed before the temperature reaches 700°C, while lime is formed and will not totally disappear until the temperature exceeds 850°C. Over 800-850°C, new firing phases of calco-silicates and alumino-calco-silicates (pyroxene
and gehlenite) begin to crystallize. In addition, some primary phases also exhibit clear changes. Illite-muscovite starts undergoing a decomposition process that is complete between 950-1000°C. On the other hand, plagioclase show an increasing intensity of the peaks that must be related to the crystallization of anorthite. This increment of plagioclase peaks could overlap the weak peaks attributed to alkali feldspar that could otherwise have also decomposed at temperatures between 800-850°C. Over 950°C, a new increment of intensity in pyroxene and gehlenite peaks is observed after the total decomposition of illite-muscovite. Again, over 1000°C, pyroxene and plagioclase peaks exhibit further increments in intensity. At this temperature, quartz starts a decomposition, that will continue up to 1100°C, and hematite is observed for the last time. Finally, gehlenite totally decomposes over 1050°C.
From the previous discussed experiment, it is possible to estimate Equivalent Firing Temperatures (EFT) for the four proposed classes after the ARS diffractograms (Table 3). The total absence of firing phases in class A, characterized by intense peaks of calcite and illite-muscovite, enables us to estimate an EFT below 800°C. This EFT could be even lower since calcite is totally decomposed at about 700°C. However, the lime present in the sample at this temperature would undergo a process of recarbonation and calcite would be also observed by XRD, a technique that does not allow us to identify the primary or secondary character of this phase (Buxeda and Cau 1995). Therefore, class A individuals can be considered as low-fired. EFT in class B can be estimated in the range of 800/850-950°C, since pyroxene and gehlenite are observed. Moreover, illite-muscovite and calcite exhibit peaks of a clearly lower intensity than in class A. The latter is not even observed in individual KIRR-88. At this temperature, calcareous pottery can be considered as well-fired. Class C exhibits an association of crystalline phases by XRD that enables us to estimate an EFT in the range of 1000-1050°C. Illite-muscovite is completely decomposed, while pyroxene, gehlenite and plagioclase exhibit peaks of a high intensity. Only one individual, BERB-27 (group MBKR), exhibits a peak of calcite that must be considered as having a secondary origin. This possibility strongly agrees with the calcium content (11.7%), which is the highest for the twenty studied individuals. Finally, EFT for class D individuals can be estimated as over 1050°C, because of the decomposition of gehlenite, the clear partial collapse of quartz, and the extreme intense peaks of pyroxene and plagioclase. The last two classes, C and D, must be considered as high-fired or even initially over-fired materials.
A very important issue arises from the presence of analcime in almost all individuals ascribed to classes C and D. This phase is a sodic zeolite of composition Na(Si2Al)O6).H2O, which is clearly identified as secondary phase. A significant correlation is then established between the presence of analcime and membership of group MBKR. While none of the individuals from group MB exhibit analcime, this secondary phase is always present in the ARS diffractograms of all individuals from group MBKR.
4. COMPARISON WITH NAA DATA
Since the late 1970s, several studies have observed similar abnormal high sodium and abnormal low potassium values in high-fired calcareous pottery. The alteration of the glassy phase, together with the crystallization of zeolites, were then proposed as an explanation to this phenomenon (Picon 1976, Segebade and Lutz 1980, Lemoine et al. 1981, Schmitt 1989, Picon 1991). Even so, no XRD analyses were performed and there was no direct evidence of a presence of zeolites. During the 1990s, the presence of analcime was effectively observed in several studies conduced on different production centers: Late Minoan IA pottery from Kommos (Crete, Grece) (Buxeda et al. in press), punic amphorae from FE-13 (Eivissa, Spain) (Buxeda and Cau 1997), roman amphorae from Can Peixau, Cal Ros de les Cabres and Ca l’Arnau (Catalonia, Spain) (Buxeda and Gurt 1998), and Terra Sigillata and common pottery from Abella (Catalonia, Spain) (Buxeda 1999). All of these cases provide further invaluable evidence supporting the presence of zeolites, especially because all of them are reference groups of calcareous pottery, where analcime has been always observed in high-fired or over-fired individuals (in the range of the classes C and D defined in the present study). Moreover, those individuals with analcime also exhibit, from the chemical point of view, a characteristic sodium content significantly higher than the normal concentration determined for the rest of individuals in the same reference group. In addition, concentrations of potassium, rubidium, and lead, depending on each case study, are significantly lower than the normal contents for each reference group. Therefore, all of the accumulated evidence points clearly to the existence of a process that is different from the processes observed in the past concerning the decomposition of gehlenite under specific burial conditions (Maggetti 1981, Heimann and Maggetti 1981, Walter 1988). In the latter case, gehlenite from pottery fired at temperatures similar to class B
is decomposed and wairakite crystallizes. This phase is a calcium zeolite of composition CaAl2Si4O12.2H2O whose XRD pattern is similar to that of analcime.
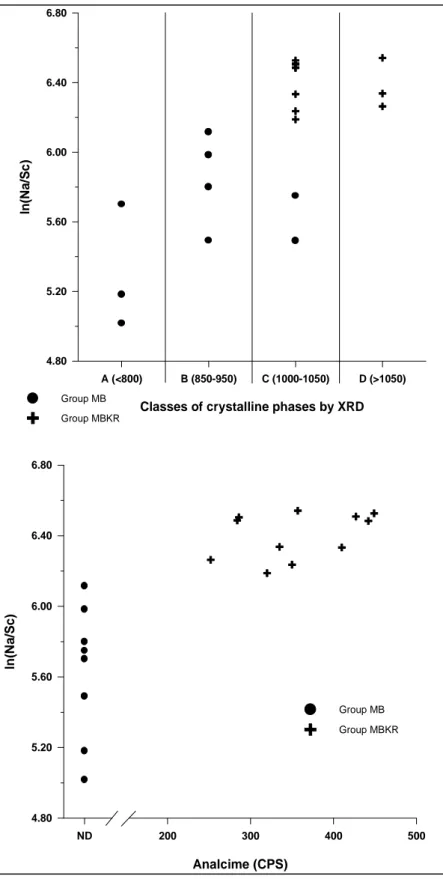
In the present case, after chemical data have been logratio transformed using Sc as divisor (Aitchison 1986, 1992, Buxeda 1999), alkaline elements have been plotted against the classes established according to the crystalline phases observed by XRD. In Figure 3 (top) it can be seen that all samples ascribed to classes C and D, except two samples from group MB, exhibit higher relative concentrations of Na than individuals ascribed to classes A and B. Moreover, as it is shown by the bivariate plot of analcime (semiquantified by the counts per second of the 5.59 Å peak - 15.8o2Θ -) versus the ln(Na/Sc) values (Figure 3, bottom), the presence of analcime is correlated with the high relative sodium content. This trend suggests that crystallization of analcime has played a major role in the fixation of sodium from the environment. Also noticeable is the high dispersion of the relative sodium values in the low-fired individuals of group MB.
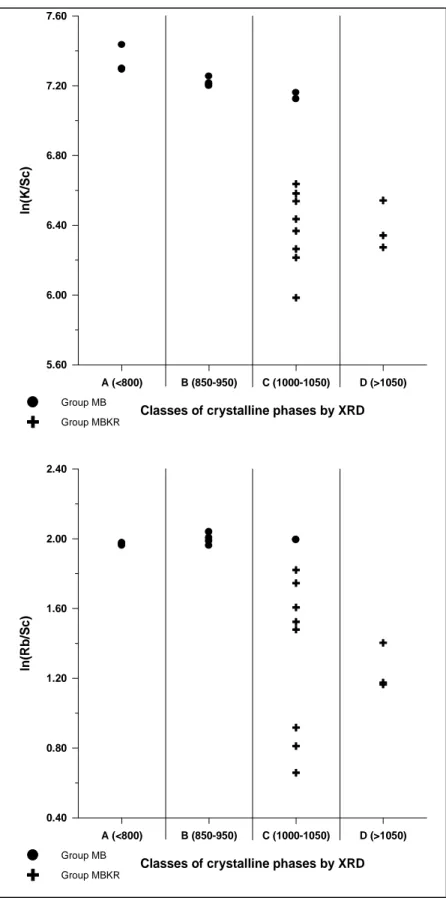
The situation is reversed in relation to the relative values of K (Figure 4, top) and Rb (Figure 4, bottom). In both cases, all individuals in classes C and D, except two samples from group MB, exhibit lower relative values than individuals ascribed to classes A and B. Besides, and also in contrast to the situation of the relative values of Na, it can be observed that relative values of K and Rb in group MB do not exhibit a high dispersion.
These observations correlate the relative concentration values for these elements with the estimated EFT. Moreover, they show the existence of a general trend that negatively correlates the relative variations of Na with K, and Rb, while it positively correlates the relative variations of K and Rb. This trend suggests the existence of a relationship between such variations that supports the hypothesis of a double alteration and contamination process. At first, the abundant glassy phase, which is typically produced in high-fired and over-fired calcareous pottery, would be altered, and potassium and rubidium would then be leached. Subsequently, the free silica material enabled the crystallization of a sodic zeolite, which would fix sodium from the environment (Buxeda 1999). The final result in the analyzed material is the observation of potassium and rubidium concentrations below the normal concentration found in pottery fired at lower temperatures, and sodium concentrations above the normal ones.
All ceramic products made by an ancient potter from a well-homogenized ball of clay paste certainly have the same elemental composition. The basic assumption of provenancing of pottery by chemical analysis is that the opposite conclusion is generally also correct; that all products having the same composition are made at the same workshop. For most cases this has been found to be correct as many successful provenance studies prove (Mommsen, in press). When many elements (usually more than 20 and the more the better) are measured with high precision, and these data are used to form groups of samples so that, average concentration patterns have low spread values of only a few percent for many elements (i. e. comparable or not much larger than the experimental errors), then these groups have a high probability of originating in the same place. But not all elements in a group of pottery made at the same workshop have generally small spreads. A large dispersion is often seen for the concentrations of As, Ba, Ca, and Na in the data, although these elements can be measured with small statistical errors by NAA. Therefore, in forming groups of samples with the same composition, these elements are usually left out in the initial phase of grouping.
To date, the individuals in group MBKR were separated from group MB because of the observed deviations of the elements K and Rb. With increasing numbers of such deviating cases it became clear that due to the large dispersion of these elements, MBKR did not represent a unique clay paste (which would result in small dispersions). Thus, it must be explained either as a recipe variation in the workshop using different amounts of an altered raw clay (Asaro 1977) or as an alteration of the pottery after its production. In the Bonn data set of Mycenaean pottery, such deviations occur in about 10 % of the samples. The XRD results now indicate that the chemical patterns MB and MBKR can be taken to be two representations of the same unique clay paste used by the potters in Berbati. Some of the individuals that originally belonged to MB, and whose firing temperatures are in the range of high-fired or over-fired, would have undergone a process of alteration when buried. Because of that, potassium and rubidium would have been leached, and analcime would have crystallized on the altered material, fixing sodium from the environment. This selective alteration and contamination would have been indirectly determined by the firing temperature, because it is responsible for the different physical, chemical and mineralogical characteristics of the fired materials, as well as by the presence of sodium in the soil solutions.
Therefore, the MBKR individuals can be considered to be additional members of group MB which were altered and contaminated after burial, and their provenance is
believed to be Berbati, too. The archaeological classification of the members of group MBKR in general does not contradict this provenance determination (Mountjoy and Mommsen, to be published). Moreover, in chemical provenance studies of pottery, individuals deviating from a given pattern only in the Na, K, and Rb concentrations should be considered as possible members of the same chemical group, which have undergone the proposed alteration and contamination processes.
Acknowledgements
The work presented here forms part of the GEOPRO Research Network funded by DGXII of the European Commission, under the Training and Mobility of Researchers Network Programme (Contract number ERBFMRX-CT98-0165). We are indeed most grateful to TMR in the European Commission for the funding which enables our collaborative work. XRD analyses were undertaken at the Scientific-Technical Services (University of Barcelona). We thank the staff of the research reactor in Geesthacht (GKSS) near Hamburg, Germany, for the irradiations.
6. REFERENCES
Aitchison, J., 1986, The Statistical Analysis of Compositional Data, Chapman and Hall, London.
Aitchison, J., 1992, On Criteria for Measures of Compositional Difference,
Mathematical Geology, 24, 365-379.
Asaro, F., 1977, in Excavations at Ancient Meiron, Upper Galilee, Israel 1971-72,
74-75, 1977 (ed. E.M. Myers), 139-146, ASOR and Duke University.
Buxeda i Garrigós, J., 1999, Alteration and Contamination of Archaeological Ceramics: The Perturbation Problem, Journal of Archaeological Sciences, 26, 295-313. Buxeda i Garrigós, J., and Cau Ontiveros, M.A., 1995, Identificación y significado de la
calcita secundaria en cerámicas arqueológicas, Complutum, 6, 293-309.
Buxeda i Garrigós, J., and Cau Ontiveros, M.A., 1997, Caracterización arqueométrica de las ánforas T-8.1.3.1. del taller púnico FE-13 (Eivissa), in FE-13: un taller
alfarero de época púnica en Ses Figueretes (Eivissa) (J. Ramon Torres),
173-192, Treballs del Museu Arqueològic d’Eivissa i Formentera 39, Govern Balear, Conselleria d’Educació, Cultura i Esports.
Buxeda i Garrigós, J., and Gurt i Esparraguera, J.M., 1998, La caracterització arqueomètrica de les àmfores de Can Peixau (Badalona) i la seva aportació al coneixement de la producció de Pascual 1 al territori de Baetulo, in El Vi a
l’Antiguitat, Economia, Producció i Comerç al Mediterrani Occidental (II Col·loqui d’Arqueologia Romana), 193-217, Monografies Badalonines, 14,
Museu de Badalona, Badalona.
Buxeda i Garrigós, J., Kilikoglou, V., and Day, P., in press, Chemical and mineralogical alteration of ceramics from a Late Bronze Age kiln at Kommos, Crete: the effect on the formation of a reference group, Archaeometry, 43.
Heimann, R.B., and Maggetti, M., 1981, Experiments on simulated burial of calcareous Terra Sigillata (mineralogical change). Preliminary results, in Scientific Studies
in Ancient Ceramics (ed. M.J. Hughes), 163-177, British Museum Occasional
Paper, 19, London.
Lemoine, C., Meille, E., Poupet, P., Barrandon, J.N., and Borderie, B., 1981, Étude de quelques altérations de composition chimique des céramiques en milieu marin et terrestre, Revue d’Archéométrie, Suppl. S, 349-360.
Maggetti, M., 1981, Composition of Roman pottery from Lousonna (Switzerland), in
Scientific studies in ancient ceramics (ed. M.J. Hughes), 33-49, British Museum
Occasional Paper, 19, London.
Maniatis, Y., Simopoulos, A., and Kostikas, A., 1981, Moessbauer Study of the Effect of Calcium Content on Iron Oxide Transformations in Fired Clays, Journal of
the American Ceramic Society, 64, 263-269.
Mommsen, H., in press, Provenance determination of pottery by trace element analysis: Problems, solutions and applications, Journal of Radioanalytical Nuclear
Chemistry.
Mommsen, H., Beier, Th., Diehl, U., and Podzuweit, Ch., 1992, Provenance determination of Mycenaean sherds found in Tell el Amarna by neutron activation analysis, Journal of Archaeological Science, 19, 295-302.
Mommsen, H., Beier, T., Heimermann, D., Hein, A., Ittameier, D., and Podzuweit, Ch., 1994, Neutron Activation Analysis of Selected Sherds from Prophitis Ilias (Argolid, Greece): a Closed Late Helladic II Settlement, Journal of
Archaeological Science, 21, 163-171.
Mommsen, H., Beier, T., Hein, A., Podzuweit, Ch., Pusch, E.B., and Eggebrecht, A., 1996, Neutron Activation Analysis of Mycenaean sherds from the town of
Ramesses II near Qantir and Greek-Egyptian trade relations, in Archaeometry 94 (eds. S. Demirci, A.M. Özer and G.D. Summers), 169-178, Tübitak.
Mommsen, H., Lambrecht, D., Diehl, U., Pantenburg, F. J., and Weber, J., 1990, Eine mykenische Scherbe in Spanien: Bestätigung ihrer Herkunft mit der Neutronenaktivierungsanalyse, Prähistorische Zeitschrift, 65, 59-61.
Mommsen, H., Lewandowski, E., Weber, J., and Podzuweit, Ch., 1988, Neutron Activation Analysis of Mycenaean Pottery from the Argolid: The Search for Reference Groups, in Proceedings of the 26th International Archaeometry Symposium (eds. R.M. Farquhar, R.G.V. Hancock and L.A. Pavlish), 165-171,
The Archaeomery Laboratory, University of Toronto, Toronto.
Mommsen, H., and Maran, J., in press, Production places of some Mycenaean pictorial vessels - the contribution of chemical pottery analysis, Opuscula Atheniensia. Mountjoy, P., and Mommsen, H., to be published, Mycenaean pottery from
Qantir-Piramesse, Egypt.
Picon, M., 1976, Remarques préliminaires sur deux types d'altération de la composition chimique des céramiques au cours du temps, Figlina, 1, 159-166.
Picon, M., 1991, Quelques observations complémentaires sur les altérations de composition des céramiques au cours du temps: cas de quelques alcalins et alcalino-terreux, Revue d’Archéométrie, 15, 117-122.
Schmitt, A., 1989, Méthodes géochimiques, pétrographiques, et minéralogiques
appliquées à la détermination de l’origine des céramiques archéologiques.
Thèse de Doctorat, Université de Bordeaux III, Bordeaux.
Segebade, C., and Lutz, G.J., 1980, Photon activation analysis of ancient Roman pottery, in Proceedings of the 16th International Symposium on Archaeometry
and Archaeological Prospection (Edinburgh, 1976) (eds. E.A. Slater and J.O.
Tate), 20-49, National Museum of Antiquities of Scotland.
Walter, V., 1988, Étude pétrographique, minéralogique et géochimique d’amphores
gauloises découvertes dans le Nord-Est de la France, Thèse de Doctorat,
Université des Sciences Humaines de Strasbourg, U.F.R. des Sciences Historiques, CNRS - Centre de Sédimentologie et de Géochimie de la Surface, Strasbourg.
Figure 1. Representative diffractograms (5 to 45°2Θ), from bottom to top, of classes A (individual TIRY-30, group MB), B (individual TIRY-39, group MB), C (individual BERB-51, group MBKR), and D (individual KATS-73, group MBKR). Q = quartz; C = calcite; I-M = illite-muscovite; H = hematite; P =
KATS-73 P An P D D Q P P P P P An Q D P D An D An D D D D D An D P D D D BER-51 P P An GAn P D D Q P PP G P An Q D P G D An D G AnAn D D D Q G G D Q D An Q D P D Q D D TIRY-39 I-M I-M I-M Q P P KF Q C KF H D H Q QC Q Q D D P P D P P D D G G D D D 5 10 15 20 25 30 35 40 45 TIRY-30 I-M I-M I-M Q I-M P I-M KF Q C KF P I-M H I-M C H Q I-M Q C Q Q C (Cu Kα) °2Θ
Figure 2. Thermodiffractometric experiment conduced on individual TIRY-30, with spectra taken at room temperature (RT), 600, 700, 800, 850, 900, 950, 1000, 1050 and 1100°C. Q = quartz; C = calcite; I-M = illite-muscovite; H = hematite; P = plagioclase; KF = alkaline feldspar; Lm = lime; G = gehlenite; D = pyroxene.
Figure 3. Top. Bivariate plot of classes of crystalline phases by XRD vs. ln(Na/Sc). Estimated EFT in ºC for each class is indicated in brackets. Bottom. Bivariate plot of Analcime (in counts per second -CPS- of its 5.59 Å peak - 15.8o2Θ -) vs. ln(Na/Sc). Dots: individuals of group MB; crosses: individuals of group MBKR; ND: not observed.
A (<800) B (850-950) C (1000-1050) D (>1050)
Classes of crystalline phases by XRD
4.80 5.20 5.60 6.00 6.40 6.80 ln (N a /S c ) Group MB Group MBKR ND 200 300 400 500 Analcime (CPS) 4.80 5.20 5.60 6.00 6.40 6.80 ln (N a /S c ) Group MB Group MBKR
Figure 4. Top. Bivariate plot of classes of crystalline phases by XRD vs. ln(K/Sc). Estimated EFT in ºC for each class is indicated in brackets. Bottom. Bivariate plot of classes of crystalline phases by XRD vs. ln(Rb/Sc). Estimated EFT in ºC for each class is indicated in brackets. Dots: individuals of group MB; crosses: individuals of group MBKR.
A (<800) B (850-950) C (1000-1050) D (>1050)
Classes of crystalline phases by XRD
5.60 6.00 6.40 6.80 7.20 7.60 ln (K /S c ) Group MB Group MBKR A (<800) B (850-950) C (1000-1050) D (>1050)
Classes of crystalline phases by XRD
0.40 0.80 1.20 1.60 2.00 2.40 ln (R b /S c ) Group MB Group MBKR
group MB M (σ(%)) 9 samples group MBKR M (σ(%)) 12 samples (incl. 1 repet. meas.)
As 8.57 61. 5.38 59. Ba 425. 23. 397. 22. Ca% 9.40 9.8 9.53 16. Ce 62.5 2.9 63.8 2.7 Co 27.4 6.3 28.3 6.3 Cr 233. 10. 218. 7.1 Cs 8.35 9.9 9.00 6.7 Eu 1.11 2.3 1.18 2.5 Fe% 5.18 3.1 5.24 3.3 Ga 18.6 12. 19.4 17. Hf 3.58 6.5 3.87 6.3 K% 2.96 9.7 1.29 17. * La 30.9 1.5 31.7 3.7 Lu 0.41 6.3 0.42 6.8 Na% 0.62 33. 1.30 13. * Nd 26.3 9.1 27.2 8.7 Ni 187. 10. 214. 7.1 Rb 154. 4.7 83.4 34. * Sb 0.56 11. 0.60 18. Sc 21.1 3.8 21.2 3.8 Sm 4.95 2.8 5.12 5.8 Ta 0.76 6.6 0.82 3.1 Tb 0.64 5.9 0.70 5.6 Th 10.9 2.3 11.1 2.6 Ti% 0.46 13. 0.49 21. U 2.43 9.8 2.41 16. W 2.10 17. 1.90 14. Yb 2.74 2.3 2.81 2.9 Zn 103. 13. 103. 16. Zr 154. 17. 167. 26.
Table 1. Average NAA concentrations M of 30 elements of the groups MB and MBKR in µg/g (ppm), if not indicated otherwise, and spreads σ in % of M, corrected for dilution (using all elements except As, Ba, Ca, K, Na, Rb).
Sample Ca% Na% K% Rb Sc Group MB Tiry 28 10.0 0.39 3.24 158. 21.9 Tiry 29 8.98 0.59 2.90 141. 19.7 Tiry 30 8.88 0.31 3.47 146. 20.5 Tiry 39 10.7 0.52 3.03 159. 21.4 Kirr 86 9.81 0.87 2.57 140. 19.2 Kirr 88 8.08 0.70 2.88 163. 21.2 Kirr 90 9.98 0.85 2.89 152. 21.4 Kirr 87 9.73 0.81 2.72 155. 21.1 Kirr 89 8.77 0.57 2.92 173. 23.5 ave. meas. error 0.32 0.004 0.030 2.6 0.027
in % 3.4 0.7 1.0 1.7 0.1 ave. value M 9.4 0.62 3.0 154. 21. spread 0.81 0.20 0.27 11. 1.2 in % 8.6 32. 9.0 6.9 5.9 Group MBKR Berb 27 11.7 0.94 1.20 96.2 19.3 Berb 49 6.68 1.19 1.61 144. 23.3 Berb 51 7.87 1.16 1.20 118. 20.6 Kirr 83 9.22 1.30 1.43 86.9 19.8 Kirr 83-rep 8.99 1.29 1.43 85.0 19.5 Kirr 85 10.4 1.35 1.54 92.7 20.2 Qant 15 10.8 1.47 0.87 49.3 21.9 Qant 23 10.9 1.42 1.14 54.3 21.7 Qant 28 8.32 1.54 1.26 71.9 22.2 Qant 50 9.30 1.49 1.09 42.1 21.8 Kats 73 9.51 1.30 1.22 73.7 23.0 Kirr 84 10.8 1.15 1.52 89.1 21.9 ave. meas. error 0.19 0.009 0.029 2.0 0.029
in % 2.0 0.7 2.2 2.4 0.1
ave. value M 9.5 1.3 1.3 84. 21.
spread 1.5 0.17 0.22 29. 1.3
in % 15. 13. 17. 34. 6.3
Table 2. Selected individual element concentrations C in µg/g (ppm) or %, average measuring errors, also in percent of C, average values M and spreads, also in percent of M, without dilution correction (compare the smaller spread value of Sc in Table 1). Kirr83-rep is a repeated measurement of individual Kirr83.
Class A Class B Class C Class D MB reference group Tiry28 Tiry29 Tiry30 Tiry39 Kirr86 Kirr88 Kirr90 Kirr87 Kirr89 MBKR reference group Berb27 Berb49 Berb51 Kirr83 Kirr85 Qant15 Qant23 Qant28 Qant50 Kats73 Kirr84 Estimated EFT <800°C 850-950°C 1000-1050°C >1050°C
Table 3. Ascription of studied individuals to classes A to D established according to the observed mineralogical phases in the as received state (ARS) diffractograms. Estimated equivalent firing temperatures (EFT) are also indicated for each class.