Università Politecnica delle Marche
Scuola di Dottorato di Ricerca in Scienze dell’Ingegneria Curriculum in INGEGNERIA
INFORMATICA, GESTIONALE E DELL’AUTOMAZIONE ---
How students solve problems during
Educational Robotics activities:
identification and real-time measurement
of problem-solving patterns
Ph.D. Dissertation of:
Lorenzo Cesaretti
Advisor:
Prof. David Scaradozzi
Curriculum supervisor:
Prof. Francesco Piazza
Università Politecnica delle Marche
Scuola di Dottorato di Ricerca in Scienze dell’Ingegneria Curriculum in INGEGNERIA
INFORMATICA, GESTIONALE E DELL’AUTOMAZIONE ---
Come gli studenti risolvono problemi
durante le esperienze di Robotica
Educativa: identificazione e misurazione
in tempo reale delle strategie di
problem-solving
Ph.D. Dissertation of:
Lorenzo Cesaretti
Advisor:
Prof. David Scaradozzi
Curriculum supervisor:
Prof. Francesco Piazza
Università Politecnica delle Marche Dipartimento di Ingegneria dell’Informazione (DII)
Acknowledgements
I would like to thank my supervisor, professor David Scaradozzi: his advises, his continuous support and his guidance were fundamental during these three years. A special thanks goes also to professor Eleni Mangina (University College Dublin): she helped me in the study and development of machine learning techniques applied to our dataset during my visiting period in Dublin.
All the research results, all the projects, all the “stuff” we created were possible thanks to a special colleague and friend, Laura Screpanti. Thanks for all the “scientific” (and not scientific) chats we had during the PhD. Thanks also to Arianna: her great professionalism has made possible an amazing event (Fablearn Italy 2019), the “icing on the cake” at the end of the PhD. Thanks to Nicolò, for cooking for me during our visiting period at Hopkins Marine Station (California).
Three years ago, I decided to follow my dreams (in practice: I quit a job, founded a startup and started a PhD) because the love of my life, my wife Giada, pushed me towards what is really important for me. We are trying to put into practice some words that I love to read: “The very basic core of a man's living spirit is his passion for adventure. The joy of life comes from our encounters with new experiences, and hence there is no greater joy than to have an endlessly changing horizon, for each day to have a new and different sun.” (Jon Krakauer, Into the Wild).
Thanks to my mother Mirella and my dad Giancarlo: they taught me that great sacrifice and hard work (and sometimes sleep a few hours in a night) is needed to create excellent things. Thanks to my sister, Elisa, her husband Francesco and their daughter, Giorgia (the other love in my life) for all the laughs every Sunday evening. Thanks to my parents in law Valeria and Renzo, for boosting me in this adventure and for giving me my first Educational Robotics book.
Thanks to Elisa and Michele, unique friends, every day involved in the building, brick by brick, of our projects TALENT and Weturtle. Their decision to invest in my research project was a turning point in my life.
Thanks to all the TALENT collaborators and friends: Federico, Luca, Nico, Susanna, Roberto, Alessandra, Elena. Their patience in collecting log files following the protocol was incredible. Thanks to all my friends Francesco, Cecilia, Alessio, Giulia, Marco, Kelly, Marco, Cecilia, Gian-Luca, Elisa, Jacopo, Giulia, Don Andrea, Maila and Paolo for being with me during this journey. Thanks to Michele and Alessandro (and to Pizzeria La Grotta) for all the relaxing moments with good food and good beer (Coke for Michele).
Finally, thanks to all the students and teachers involved in the experimentation presented in the following pages: three years ago I left a job as robotics engineer, but I found the most beautiful job in the world.
“Don't settle down and sit in one place. Move around, be nomadic, make each day a new horizon. You are still going to live a long time, Ron, and it would be a shame if you did not take the opportunity to revolutionize your life and move into an entirely new realm of experience.” (Jon Krakauer, Into the Wild)
“Space is big. You just won't believe how vastly, hugely, mind-bogglingly big it is. I mean, you may think it's a long way down the road to the chemist's, but that's just peanuts to space.” (Douglas Adams, The Hitchhiker's Guide to the Galaxy)
Abstract
This dissertation aims to provide the results through the utilisation of data mining and machine learning techniques for the assessment with Educational Robotics (ER).
This research work has three main objectives: identify different patterns in the students’ problem-solving trajectories; predict the students’ team final performance, with a particular focus on the identification of learners with difficulties in the resolution of the ER challenges; analyse the correlation of the discovered patterns of students’ problem-solving with the evaluation given by the educators.
We analysed the literature on Educational Robotics’ traditional evaluation and Educational Data Mining for assessment in constructionist environments.
An experimentation with 455 students in 16 primary and secondary schools from Italy was conducted, through updating Lego Mindstorms EV3 programming blocks in order to record log files containing the coding sequences designed by the students (within team work), during the resolution of two preliminary Robotics’ exercises (Exercise A and B).
The collected data were analysed based on data mining methodology. We utilised five machine learning techniques (logistic regression, support vector machine, K-nearest neighbors, random forests and Multilayer perceptron neural network) to predict the students’ performance, comparing two approaches:
• a supervised approach, calculating a feature matrix as input for the algorithms characterised by two parts: the team’s past problem-solving activity (thirteen parameters extracted from the log files) and the learners’ current activity (three indicators for Exercise A and four indicators for Exercise B); and
• a mixed approach, applying an unsupervised technique (the k-means algorithm) to calculate the team’s past problem-solving activity, and considering the same indicators of the supervised approach representing the students’ current activity. Firstly, we wanted to verify if similar findings emerged comparing younger students and older students, so we divided the entire dataset in two subsets (students younger than 12 years old and students older than 12 years old) and applied the supervised and mixed approach in these two subgroups for the first exercise, and a clustering analysis for the second exercise. This process demonstrated that similar problem-solving strategies were applied by both younger and older students, so we aggregated the dataset and performed the supervised and the mixed approach comparing the performances of these two techniques considering the entire dataset.
The results have highlighted that MLP neural network with the mixed approach outperformed the other techniques, and that three learning styles were predominantly emerged from the data mining. Furthermore, we deeply analysed the pedagogical meaning of these three different approaches and the correlation of the discovered patterns with the performance obtained by learners. We denote the added value of data mining and machine learning applied to Educational Robotics research and highlight the significance of further implications. Finally, we discuss the future further development of this work from educational and technical view.
Contents
Acknowledgements ... i
Abstract ... iii
Contents ... iv
List of Figures... vi
List of Figures in Appendices ... viii
List of Tables ... ix
List of Tables in Appendices ... x
Chapter 1. ... 1
1 Introduction ... 1
1.1 Educational Robotics ... 1
1.2 Literature Review ... 4
1.2.1 Traditional assessment methods in Educational Robotics ... 4
1.2.2 Assessment of students’ problem-solving performances ... 7
1.2.3 Machine learning and data mining for assessment in constructionist environments ... 8
Chapter 2. ... 18
2 Methodology ... 18
2.1 Methodology description ... 18
2.2 Participants and procedure ... 22
2.2.1 Exercise A: the robot has to cover a given distance... 31
2.2.2 Exercise B: the robot has to stop at a given distance from the wall, using the ultrasonic sensor ... 32
2.3 Data preparation ... 33
2.4 Machine learning algorithms ... 38
Chapter 3. ... 43 3 Results ... 43 3.1 Data Insights ... 43 3.1.1 Exercise A ... 43 3.1.2 Exercise B ... 46 3.2 Younger students... 48 3.2.1 Exercise A ... 48 3.2.2 Exercise B ... 52 3.3 Older students ... 55 3.3.1 Exercise A ... 55 3.3.2 Exercise B ... 60 3.4 Complete dataset ... 63
3.4.1 Prediction performance of supervised and mixed approach ... 65
3.4.2 Problem solving styles ... 73
3.4.3 MLP Neural Network prediction performance ... 79
Chapter 4. ... 88
References ... 93
Appendix A. ... 99
The tracking system: technical details ... 99
A.1. Data collection ... 99
A.2. Data preparation ... 102
Appendix B. ... 107
List of Figures
Figure 1. Robot built by students during an ER activity ... 1
Figure 2. From Lego/Lego (grey brick in the upper left corner), to Lego Mindstorms EV3 block (grey and white brick on the right-hand side) ... 2
Figure 3. The TMI cycle (Martinez & Stager, 2013). ... 6
Figure 4. ML expert workflow and teacher workflow in this experimentation ... 20
Figure 5. Student’s activities workflow during an ER intervention... 21
Figure 6. Structure of the Lego Mindstorms EV3 blocks software update ... 22
Figure 7. The columns report the percentage of how many students use a specific technology at school or at home ... 29
Figure 8. Lego Mindstorms Education EV3 Education screen ... 31
Figure 9. The “Move Steering” Block ... 31
Figure 10. A possible solution for the Ex. B ... 33
Figure 11. Pseudocode for the delta calculation ... 35
Figure 12. Flowchart for the delta calculation ... 36
Figure 13. Microsoft MakeCode for Lego Mindstorms EV3 software interface ... 37
Figure 14. Lego Mindstorms EV3 Scratch extension ... 37
Figure 15. mBlock (mBot robot) software interface ... 38
Figure 16. Team problem-solving activity representation (at the n-th trial) for the Ex. A passed as input to the machine learning algorithms (supervised approach) ... 39
Figure 17. Team problem-solving activity representation (at the n-th trial) for the Ex. B passed as input to the machine learning algorithms (supervised approach) ... 40
Figure 18. Team problem-solving activity representation (at the n-th trial) for the Ex. A passed as input to the machine learning algorithms (mixed approach) ... 41
Figure 19. Team problem-solving activity representation (at the n-th trial) for the Ex. B passed as input to the machine learning algorithms (mixed approach) ... 41
Figure 20. Rotations graph – Example 1 ... 44
Figure 21. Rotations graph – Example 2 ... 45
Figure 22. Rotations graph – Example 3 ... 45
Figure 23. Seconds graph – Example 4 ... 46
Figure 24. Delta Conditionals graph – Example 1 ... 47
Figure 25. Delta Conditionals graph – Example 2 ... 47
Figure 26. Results for the Ex. A (considering only younger students) obtained applying the supervised approach ... 48
Figure 27. Results for the Ex. A (considering only younger students) obtained applying the mixed approach ... 49
Figure 28. Younger students’ teams results for the Ex. A ... 49
Figure 29. The Elbow Method for the Ex. A (considering only younger students) (Within-Cluster-Sum-of-Squares (WCSS) over the Number of clusters) ... 51
Figure 30. Younger students’ teams results for the Ex. B ... 52
Figure 31. The Elbow Method for the Ex. B (considering only younger students) (Within-Cluster-Sum-of-Squares (WCSS) over the Number of clusters) ... 55
Figure 32. Results for the Ex. A (considering only older students) obtained applying the
supervised approach ... 56
Figure 33. Results for the Ex. A (considering only older students) obtained applying the mixed approach ... 56
Figure 34. Older students’ teams results for Ex. A ... 57
Figure 35. The Elbow Method for the Ex. A (considering only older students) (Within-Cluster-Sum-of-Squares (WCSS) over the Number of clusters) ... 59
Figure 36. Older students’ teams results for the Ex. B ... 60
Figure 37. The Elbow Method for the Ex. B (considering only older students) (Within-Cluster-Sum-of-Squares (WCSS) over the Number of clusters) ... 63
Figure 38. Example of the usage of the Wait Block setting a condition on the Ultrasonic Sensor ... 64
Figure 39. Example of the usage of the Switch and Loop Blocks setting a condition on the Ultrasonic Sensor ... 65
Figure 40. Results for the Ex. A obtained applying the supervised approach (considering the whole dataset) ... 66
Figure 41. Results for the Ex. A obtained applying the mixed approach (considering the whole dataset) ... 66
Figure 42. Results for the Ex. B obtained applying the supervised approach (considering the whole dataset) ... 67
Figure 43. Results for the Ex. B obtained applying the mixed approach (considering the whole dataset) ... 67
Figure 44. The Elbow Method for the Ex. A (blue curve) and B (red curve) (Within-Cluster-Sum-of-Squares (WCSS) over the Number of clusters) ... 72
Figure 45. Different problem-solving styles that emerge from the Ex. A ... 74
Figure 46. Problem-solving styles showed by students’ teams in the Ex. A ... 75
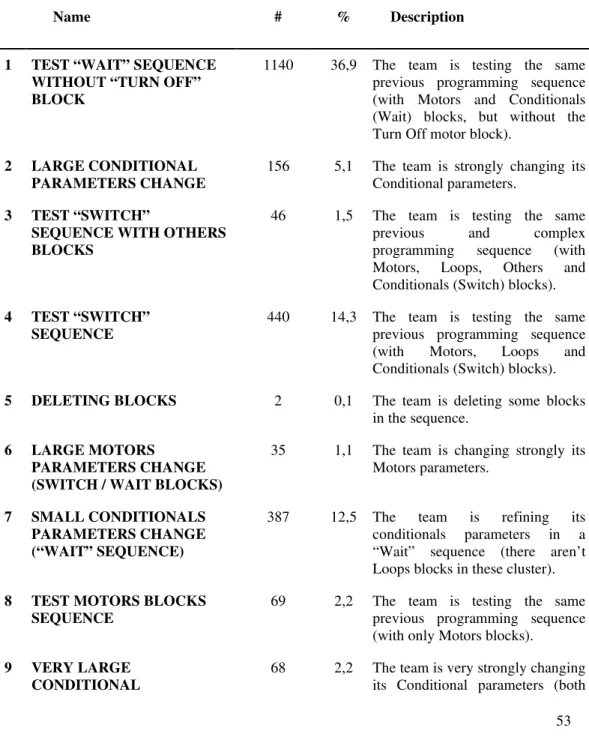
Figure 47. Different problem-solving styles that emerge from the Ex. B ... 76
Figure 48. A programming sequence designed for the Ex. B (characterised by the Wait conditional block), without the “Turn Off” Motor block ... 76
Figure 49. Problem-solving styles showed by students’ teams in the Ex. B ... 77
Figure 50. Best correlated features for the Ex. A (1: positive performance, 0: negative performance)... 78
Figure 51. Best correlated features for the Ex. B (1: positive performance, 0: negative performance)... 79
Figure 52. MLP Neural network structure ... 80
Figure 53. Prediction results for the Ex. A comparing the previous best ML technique (SVM) and the MLP neural network, applying the mixed approach (considering the whole dataset) ... 80
Figure 54. Prediction results for the Ex. B comparing the previous best ML technique (SVM) and the MLP neural network, applying the mixed approach (considering the whole dataset) ... 81
Figure 55. Prediction results for the Ex. A applying the MLP neural network considering n, n-1, n-2 programming sequences for each log files in our dataset ... 82
Figure 56. Prediction results for the Exercise B applying the MLP neural network considering n, n-1, n-2 programming sequences for each log files in our dataset ... 82
Figure 57. MLP neural network ROC curve for the Ex. A (considering all the n trials for
each students’ team in the experimentation) ... 84
Figure 58. MLP neural network ROC curve for the Ex. A (considering n-1 trials for each students’ team in the experimentation) ... 84
Figure 59. MLP neural network ROC curve for the Ex. A (considering n-2 trials for each students’ team in the experimentation) ... 85
Figure 60. MLP neural network ROC curve for the Ex. B (considering all the n trials for each students’ team in the experimentation) ... 85
Figure 61. MLP neural network ROC curve for the Ex. B (considering n-1 trials for each students’ team in the experimentation) ... 86
Figure 62. MLP neural network ROC curve for the Ex. B (considering n-2 trials for each students’ team in the experimentation) ... 86
List of Figures in Appendices
Figure A 1. A programming sequence example designed in Lego Mindstorms EV3 software ... 99Figure A 2. Log File generated by the execution of the sequence in Fig. A.1 ... 99
Figure A 3. An example of log file with 3 tests ... 101
Figure A 4. Two example tests containing the loop block... 105
Figure A 5. The log file related to the Figure A.4 ... 105
Figure B 1. MLP Neural network structure, with parameters set to obtain best performances presented in Results chapters ... 110
List of Tables
Table 1. Features, Machine Learning techniques and outcomes of studies carried out in constructionist environments. ... 12 Table 2. Summary of data describing the sample of students collected by a questionnaire (schools 1-8). ... 23 Table 3. Summary of data describing the sample of students collected by a questionnaire (schools 1-8). ... 26 Table 4. Best performance parameters for Exercise A (younger students). ... 50 Table 5. Clusters obtained with the k-means algorithm applied on Ex. A (considering only younger students). ... 50 Table 6. Mean values and standard deviation (M (SD)) calculated for the 13 indicators for each cluster in Table 5. ... 51 Table 7. Clusters obtained with the k-means algorithm applied on the Ex. B (considering only younger students)... 53 Table 8. Mean values and standard deviation (M (SD)) calculated for the 13 indicators for each cluster in Table 7. ... 54 Table 9. Best performance parameters for the Ex. A (older students). ... 57 Table 10. Clusters obtained with the k-means algorithm applied on the Ex. A (considering only older students). ... 58 Table 11. Mean values and standard deviation (M (SD)) calculated for the 13 indicators for each cluster in Table 10. ... 58 Table 12. Clusters obtained with the k-means algorithm applied on the Ex. B (considering only older students). ... 60 Table 13. Mean values and standard deviation (M (SD)) calculated for the 13 indicators for each cluster in Table 12 ... 62 Table 14. Best performance parameters for the Ex. A and B, considering the whole dataset. ... 68 Table 15. Clusters obtained with the k-means algorithm applied on the Ex. A. ... 68 Table 16. Mean values and standard deviation (M (SD)) calculated for the 11 indicators for each cluster in Table 15. ... 69 Table 17. Clusters obtained with the k-means algorithm applied on the Ex. B. ... 70 Table 18. Mean values and standard deviation (M (SD)) calculated for the 12 indicators for each cluster in Table 17. ... 71 Table 19. SVM and MLP neural network detailed performance for Ex. A ... 81 Table 20. SVM and MLP neural network detailed performance for Ex B ... 81 Table 21. MLP neural network detailed performance (considering n, n-1, n-2 programming sequences in each log file) for Ex. A ... 83 Table 22. MLP neural network detailed performance (considering n, n-1, n-2 programming sequences in each log file) for Ex. B ... 83
List of Tables in Appendices
Table A 1. Examples of LEGO EV3 block names and options. ... 100
Table A 2. Example of log file transformation. ... 102
Table A 3. Mapping of 1st Block Feature string and 2nd Block Feature string into numeric value. ... 102
Table A 4. Transformation into a matrix of log file in Figure A.5 ... 106
Table B 1. ML parameters for the supervised approach, Ex. A, younger students’ teams 107 Table B 2. ML parameters for the supervised approach, Ex. A, older students’ teams ... 107
Table B 3. ML parameters for the supervised approach, Ex. A, whole dataset ... 108
Table B 4. ML parameters for the supervised approach, Ex. B, whole dataset ... 108
Table B 5. ML parameters for the mixed approach, Ex. A, younger students’ teams ... 108
Table B 6. ML parameters for the mixed approach, Ex. A, older students’ teams ... 109
Table B 7. ML parameters for the mixed approach, Ex. A, whole dataset ... 109
Chapter 1.
1
Introduction
1.1
Educational Robotics
Nowadays Educational Robotics (ER) is increasingly spreading in schools all over the world (Miller & Nourbakhsh, 2016), thanks to teachers and educators that are using this approach during the course of their standard lessons. The expression “ER” is more and more cited in the educational context and policymakers have decided to invest funds in the students’ and teachers’ training (see for example in Italy the National Plan for Digital School, PNSD (2019), PON Digital Creativity - PON Creatività Digitale (2019) and “In Summer we learn STEM - In Estate si imparano le STEM” (2019)).
In this situation also the academic community is paying more attention to the study of the effects of the use of robots in the educational environment: Angel-Fernandez and Vincze (2018) showed how the number of scientific papers using the words “robotics” and “education”, or the expression “ER” has increased in the last two decades.
But how can we define ER? It is not enough introducing robots in an educational setting to propose an ER activity (Scaradozzi, Screpanti & Cesaretti, 2019): ER is characterized by a workflow that allows students to design, build and program robotic artefacts, creatively solve problems and carry out meaningful projects.
ER can facilitate active teaching and learning, promote active reasoning and critical thinking, and also enhance students' engagement and interest, while motivating them to address complex or abstract subjects (Cheng, Sun & Chen, 2018). ER is a growing field with the potential to significantly impact the nature of engineering and science education at all levels (Cho, 2011; Barker, Nugent, Grandgenett & Adamchuk, 2012).
In 1980 mathematician and pedagogist Seymour Papert proposed the constructionist approach (Papert, 1980), the pedagogical theory at the base of ER: the construction of a personal and meaningful artefact (a robotic artefact, considering ER) promotes the construction of deep knowledge and “can provide children with new possibilities for learning, thinking, and growing emotionally as well as cognitively” (Papert, 1980). Moreover, the sharing of this product with the educational community (peers’ group, teachers, parents) makes the artefact a “public entity” (Papert, 1991) and provide a richer learning experience to the pupils. Papert contributed to the design of one of the first examples of Educational Robotic kits, the Lego / Logo construction kit (Resnick, Ocko & Papert, 1988), proposed in 1988 by the MIT Media Laboratory.
Lego Mindstorms EV3 Education (2019) is the kit chosen for the experimentation presented in this dissertation, and it’s one of the successors of the Lego / Logo kit (and the name of the kit, “Mindstorms”, is a way to thank Papert remembering the title of his main publication “Mindstorms. Children, Computers and Powerful Ideas”). Teachers can propose to carry out ER activities in their class through the use of Lego Mindstorms EV3. Since constructionism is the pedagogical approach at the base of ER, when students design, build, program, debug and share a robot artefact they explore the everyday phenomena in their lives in a new and playful way (Resnick, Martin, Sargent & Silverman, 1996), improving their problem-solving and thinking capabilities.
Figure 2. From Lego/Lego (grey brick in the upper left corner), to Lego Mindstorms EV3 block (grey and white brick on the right-hand side)
The evaluation of constructionist activities could be difficult for teachers: as Berland, Baker and Blikstein (2014) suggest, what students learn thanks to a constructionist approach (such as ER) is hardly detected via analysing scores obtained through standard tests (questionnaires, multiple choice questions, etc.). These activities are characterised by a personal design process: documenting, analysing and evaluating this process can be costly in terms of time for an educator. Moreover, what and how to assess the artefact designed by students it’s a question without a clear answer from the academic community. Some alternative strategies have been proposed to evaluate not only the final product, but also the underlying process. Papert (1980) proposed to consider feedback provided by detailed peer critiques or actual use of a student’s tool in an authentic setting (as reported by Berland et
al. (2014)), other researchers proposed students’ interviews, the development and analysis of portfolios (Brennan & Resnick, 2012; Tangdhanakanond, Pitiyanuwat & Archwamety, 2006) and MIT (Playful Journey Lab) in collaboration with MakerEd proposed the “Beyond Rubrics Toolkit”, a collection of tools to support embedded assessments in maker-centered classrooms (Introducing the Beyond Rubrics Toolkit, 2019).
The latest developments in the field of data mining and machine learning consent to explore and extract new, valuable and non-trivial information and relationships in large volumes of data (Kantardzic, 2011), instead of trying to test prior hypotheses (Collins, Schapire & Singer, 2004). Applying data mining and machine learning methods to data collected from the educational environments (Educational Data Mining, EDM) can allow to predict and classify students’ behaviours and discover latent structural regularities to large educational dataset (Berland et al., 2014). The raw data coming from educational systems (for example web platform used by students) are transformed into useful and meaningful information that could be strongly helpful for the educational research and practice (Dutt, Ismail & Herawan, 2017). In recent years some research projects in the educational fields used these techniques to predict the students’ success probability, analysing their behaviour during the interaction with software applications or with online platforms (Beck & Woolf, 2000; Merceron & Yacef, 2004; Piech, Bassen, Huang, Ganguli, Sahami, Guibas, et al., 2015; Ornelas & Ordonez, 2017), or analysing school career related data (Asif, Merceron, Ali & Haider, 2017; Fernandes, Holanda, Victorino, Borges, Carvalho & Van Erven, 2019). Creating systems able to gather and organize data during open-ended and constructionist activities could let us deeply explore the problem-solving and design process performed by learners, using machine learning algorithms; these developments could give a great support to teachers during the evaluation phase of learners. Artificial Intelligence will aid educators in the analysis of the fine-grained data collected during the interaction between pupils and technological devices (laptops, tablets, educational robots, etc.), and will give interesting insights related to the students’ usage of these materials, to their cognitive process and to their problem-solving styles (Luckin, 2017); from a metacognitive point of view this approach could improve learners’ self-awareness and could allow them to discover the best personalised ways to successfully reach educational objectives (Winne & Baker, 2013). In the ER field machine learning and data mining techniques can offer a strong contribute: data related to the utilization of the robot could be recorded and analysed, in order to verify how students have designed the robotic artefact, how they have solved a problem or how they have created a programming sequence.
This dissertation presents a research work that aims to implement this approach: thanks to the upgrade of the Lego Mindstorms EV3 programming blocks it was possible to register some log files containing the programming sequences created by 455 Italian Primary and Secondary school students (organized in teams), during the resolution of two introductory
Robotics exercises. Using the collected data as inputs for machine learning algorithms, this work explores the following ideas:
• identification of different patterns in the students’ problem-solving trajectories; • accurate prediction of students’ team final performance; and
• correlation of the discovered patterns of students’ problem-solving with the evaluation given by the educators.
The Literature Review with analysis of related work is provided within the following section. The traditional assessment methods applied to ER and EDM for evaluation in constructionist environments were taken into consideration. A description of the tracking system designed, how the data were collected during the experimentation and the details of the machine learning algorithms that have been applied are reported in the second section of this dissertation; moreover, in this section an abstract description of the data structure is given, with the aim of making this experimentation replicable using different robotic kits. Chapter 3 (Results) at first presents some insights of the collected data, in order to allow some preliminary considerations related to the presented approach; then it proposes the results obtained in terms of prediction and the patterns discovered based on the input data. Finally, the conclusions of the analysis based on the results from an educational point of view (Chapter 4) are presented along with the future developments in order to improve the presented approach.
1.2
Literature Review
1.2.1 Traditional assessment methods in Educational Robotics
ER have been considered as an educational approach that allows students to design, build, program and debug robotic artefacts (both hardware and software components) (Denis & Hubert, 2001). Educators have considered different strategies to utilise this approach, related to the learning environment where the activities take place (formal or non-formal), to the impact on curriculum of the ER activities and to the evaluation procedures chosen in order to quantify learning outcomes (qualitative, quantitative or mixed methods) (Scaradozzi, Screpanti & Cesaretti, 2019). ER not only helps students in the exploration of the main concepts of Robotics (Castro, Cecchi, Valente, Buselli, Salvini, & Dario, 2018), but also allows them to build knowledge related to Science Technology Math Engineering (STEM) disciplines (Cristoforis, Pedre, Nitsche, Fischer, Pessacg, & Di Pietro, 2013; Kim, Kim, Yuan, Hill, Doshi, & Thai, 2015) and in some cases also related to Arts and Humanities (Montero & Jormanainen, 2016; Jeon, FakhrHosseini, Barnes, Duford, Zhang, Ryan et al., 2016).
In the ER field evaluation is considered a crucial activity and researchers have identified lack of quantitative analysis on how robotics can improve skills and increase learning achievements in students (Benitti 2012; Alimisis, 2013). For this reason, in the last years, different studies focused on the assessment of ER projects, adopting qualitative, quantitative or mixed methods for the collection of educational data.
ER activities, as previously reported, are based on the constructionist theory: students learn when they are involved in meaningful experiences, characterized by the construction of an artefact (a robot, a mechanism, a computer program, etc.). Furthermore, in this kind of activity students usually have to design a solution for a given open-ended problem, related to specific software aspects (for example creating a pre-defined robotic behaviour) or to hardware aspects (designing and assembling a robot that meets specific requirements). Generally, there are unlimited options that students can explore and implement. These features make ER activities particularly suitable for a qualitative evaluation: through observations, interviews, focus groups, essays and projects’ analysis, teachers can
extrapolate useful information about the problem-solving and learning paths adopted by their students. Nevertheless, this methodology could be strongly affected by the human bias and by external factors. Several research studies in the ER field reported this type of assessment: Denis and Hubert (2001) observed interactions among students during ER activities, and thanks to the introduction of an observation grid they tried to analyse improvements in teamwork and problem-solving skills. Liu (2010) interviewed students previously involved in ER lessons, investigating the learners’ perceptions of educational robots and learning of robotics. This study proposed three clusters resulting from the interviews’ analysis (robotics as a plaything, as a source of employment, and as a way to high technology). Elkin, Sullivan and Bers (2014) evaluated the introduction of a robotics’ curriculum in a Montessori classroom, collecting surveys, interviews, and impressions from the personal blog written by the teacher responsible for the project and they proposed best practices for integrating programming and engineering concepts into Montessori education. Qualitative assessment was useful also to evaluate activities outside school hours, for example during robotics training camps, as experimented by Ucgul and Cagiltay (2014). Interviews with children and instructors, observations, field notes, and camp evaluation forms were utilised by the researchers to discover the best educational approach to adopt in this type of experience, and the participants’ preferred activity. After-school program activities related to STEM are another example of non-curricular opportunities where the same approach was applied (Sahin, Ayar, & Adiguzel, 2014).
On the other hand, quantitative assessment focuses on standardized tests, questionnaires and exercises that allow to obtain more reliable numeric outputs, so that students’ performances can be analysed and compared. Summarising learning through a quantifiable parameter sometimes could be reductive, especially in an open-ended constructionist environment, where what is learned indirectly results in quantitative test outcomes (Berland et al., 2014). In spite of this consideration, the only way to manage large scale studies until now, trying to discover the correlation between ER and the development of skills or a better understanding of curricular subjects, is the quantitative approach. Some research projects propose a pre and post assessment (administering a questionnaire), evaluating the students’ technical (programming, robotics) and social skills (teamwork, problem-solving, self-efficacy) and their attitude towards STEM (Kandlhofer & Steinbauer, 2016; Atmatzidou & Demetriadis, 2016; Castro et al., 2018) or the teachers’ attitude toward ER (Scaradozzi, Screpanti, Cesaretti, Storti, & Mazzieri, 2019). Other case studies propose only a post evaluation (Cesaretti, Storti, Mazzieri, Screpanti, Paesani, & Scaradozzi, 2017; Screpanti, Cesaretti, Storti, Mazzieri, Longhi, Brandoni et al., 2018; Screpanti, Cesaretti, Marchetti, Baione, & Scaradozzi, 2018).
To obtain the benefits from both the approaches, especially in a complex field like ER, some studies show a mixed approach, using quantitative and qualitative tools, during teachers’ training courses and activities with students (Kim et al., 2015; Chalmers, 2018; Ferrarelli, Villa, Attolini, Cesareni, Micale, Sansone et al., 2018; Angeli & Valanides, 2019). In this case, the possibility to deeply analyse the students’ learning process requires an expensive work in terms of time required and human resources and it’s not applicable to a large number of students. This dissertation focuses on a potential improvement of the evaluation within ER activities based on the recordings from every single step performed by the students during the design of their solution. From these recordings, the investigation
problem-solving path, which could be then analysed in relation to the performance reached by the students.
An ER activity is usually characterized by a cyclical experimentation, where learners modify their programming sequence or their robot’s hardware structure, trying to reach a specific goal set by the teacher or by themselves. A suitable model that represents this way of working is the “Think Make Improve” (TMI) cycle (Martinez & Stager, 2013) where the following steps are taking place (see also Figure 3):
• students usually start thinking about how to solve a problem or how to create a prototype that meets certain requirements (Think); they can adopt a “tinkering”, a “planning” approach or a mix of them, and it’s important that the educator doesn’t force them to take a certain and more scholastic path (Resnick & Rosenbaum, 2013);
• students try to realise the solution by building and programming the robot (Make); • at the end of the cycle, students observe their artefacts and try to debug or improve
them (Improve); in this phase they discuss with peers and/or with the expert, and play with their robot, trying to figure out what’s going wrong (or what to improve). From the analysis of the real feedback of the robot, students decide what changes to implement in the software or in the hardware.
The cycle starts again with “Think” phase: if the students’ team identify a feature to modify, they have to decide what changes to implement (hardware or software) and the best strategy to pursue.
A similar model was developed by LEGO, the “4C” framework (LEGO 4C Framework, 2019):
• Connect: pupils are presented with a challenge or task that is open-ended and that places them in the position of solution-seekers.
• Construct: students build prototypes to solve the challenge or to carry out the task (when students construct artefacts in the world, they simultaneously construct knowledge in their minds)
• Contemplate: learners are given the opportunity to consider what they have learned and to talk about and share insights they have gained during the Construct phase. In this phase they could decide what to improve in their artefact.
• Continue: every task ends with a new task that builds on what has just been learned. This phase is designed to keep the learner in ‘a state of Flow’ (Csikszentmihalyi, 1997).
TMI is the framework for our experimentation phase, therefore features extracted from this process will be meaningful characteristic from this way of approaching an ER activity. This could be useful, amongst other things, because it lays the basis of a systematical analysis of the impact of ER into such framework. Thus, EDM and machine learning will enhance the perspective of assessment.
1.2.2 Assessment of students’ problem-solving performances
In this PhD dissertation we will focus on the identification of learners’ problem-solving patterns during ER activities. In the educational context other studies proposed some strategies for an assessment of the students’ problem-solving performances.
Greiff, Holt, and Funke (2013) classified problem-solving in three categories (based on PISA 2003, PISA 2012 and PISA 2015):
• analytical problem-solving [paper-pencil based analytical problem solving, defined as “an individual’s capacity to use cognitive processes to resolve real, cross disciplinary situations where the solution path is not immediately obvious” (OECD, 2004)];
• interactive problem-solving [characterized by the dynamic interaction between a problem solver and the problem to generate and integrate information about the problem; administering interactive problems through computers or technological devices, it’s possible to gather and analyse process data (computer-generated log files) created by the interaction between students and the software interface]; • collaborative problem-solving (the problem solver interacts with a task and
collaborates with several problem solvers during the resolution process). A theoretical formulation for the assessment of paper-pencil based analytical problem solving (Deek, Hiltz, Kimmel and Rotter, 1999) divided the students’ process into three phases: formulating the problem, planning the solution, designing the solution; this method took into consideration the thinking skills required by students learning how to program. Furthermore, this formulation proposed four dimensions for the evaluation of the learners’
Considering the interactive problem-solving Baker and Mayer (1999) proposed some components required to assess student problem solving in technology environments; starting from a definition of problem solving, they identified some issues in the assessment of this skill and proposed some techniques and standards for measuring the quality of student understanding (the cognitive analysis, the CRESST model of learning).
Some experimentations of software environments related to problem-solving (interactive problem-solving) were implemented by Bottge, Rueda, Kwon, Grant, and LaRoque (2009) and Shute, Wang, Greiff, Zhao and Moore (2016); the first one compared a computer-based test and paper pencil test: data collected thanks to the computer-based test revealed that the weak students were able to navigate the test, spent about the same amount of time solving the subproblems as the more advanced students, and made use of the learning scaffolds. The second one measured middle-school students’ problem solving skills using a
videogame (“Use Your Brainz”); these researchers chose Bayesian networks to analyse data gathered during three-hours session of students’ playing and compared this analysis with two external problem solving measures (Raven’s Progressive Matrices and MicroDYN): their results indicated that the problem solving evaluation obtained from the videogame significantly correlated with the external measures.
Cooper, Cox Jr, Nammouz, Case and Stevens (2008) tried to assess collaborative problem solving: they involved in a research study 713 students enrolled in the first semester of a general chemistry course for science and engineering majors; they utilised a suite of software tools and pedagogies of small-group student collaborations to assess both student problem-solving strategies and student abilities as they change over time: their results showed that using small group interaction improved students’ problem solving skill.
1.2.3 Machine learning and data mining for assessment in constructionist
environments
There are several examples of the application of data mining and machine learning techniques for the evaluation of students during constructionist activities, but all these
research projects concern programming, and not the use of robots. Table 1 denotes an overview of the main aspects of these studies (features selected, implemented machine learning techniques and obtained results) and provide the motivation for the work described in this dissertation.
To the best of our knowledge, only one experimentation used data mining and machine learning in the field of ER (Jormanainen and Sutinen, 2012), but in a very small scale. They designed a new visual programming environment that allowed to program the Lego Mindstorms RCX and gathered data about the students’ interactions with the fundamental functions of the software. The study’s objective was the creation of an Open Monitoring Environment, a system that tried to find the current students’ learning behaviours during robotic activities, showing them to the teachers. This system, using trees algorithm (J48 implementation), classified the data entries into four classes that marked the observed students’ group’s progress, indicated by colour: white (neutral situation), if students were not progressing without showing problems, green if students were progressing without problems, yellow if teacher’s intervention was required soon (high probability that students
were facing problems), red if teacher’s intervention was certainly required. There were some weaknesses in this experimentation; first, the kit utilised in the study was obsolete, as in 2012 the Lego Mindstorms NXT (the new model) had been on the market since 2006 (Lego Robotics History, 2019); second, it was a very small scale study (only 12 students and 4 teachers from primary school were involved); third, the authors defined their new programming environment graphical, but students had to create textual sequences of instructions (clicking on a set of given functions), maybe a block-based approach could be more friendly for primary school pupils.
Ahmed, Lubold and Walker (2018) presented an interesting system that gives feedback to pupils in real-time, while they are programming the Lego Mindstorms EV3 robot. But in this case, the researchers did not train their system using machine learning techniques but using deterministic rules.
Berland, Martin, Benton, Petrick Smith and Davis (2013) registered students’ programming actions and used clustering (k-means algorithm) to study different pathways of novice programmers (53 high school girls participated to the study). This led to the identification of three general patterns (Tinkering, Exploring, and Refining) and to the definition of the EXTIRE framework. They analysed how students’ programming activity changed over time and how these changes relate to the quality of the programs that students were writing. The researchers discovered that the quality of the programming sequences designed by the students was higher in two of the above-mentioned phases (tinkering and refine).
Blikstein, Worsley, Piech, Sahami, Cooper and Koller (2014) presented a study that focused on how students learn computer programming, analysing if different programming styles affect students’ achievements. The research project was based on data drawn from 154,000 code snapshots of computer programs under development by approximately 370 students enrolled in an introductory undergraduate programming course. They used methods from machine learning to discover patterns in the data and tried to predict midterm and final exam grades. They performed 2 different types of analysis: the first one looked for patterns across several assignments and tried to find correlations between these patterns and students’ assignment results or exam grades. They considered how many lines of code and characters were added, modified and deleted, without looking at the content of the code: indeed, extracting this kind of data is a good choice taking into account computational cost and usefulness. The second one examined in detail one single assignment, building a machine learning–induced progression maps (using Hidden Markov Model (Rabiner & Juang, 1986) to represent students’ programming states), and demonstrating that the topologies of such maps are correlated with course performance. In particular, they used a variety of machine-learning techniques to translate the myriad code logs into maps of states that show the progress of the students’ work and the correlation of this work with student final performance.
These two research projects (Berland et al., 2013; Blikstein et al. 2014) extended the previous work by Turkle and Papert (1992), that proposed two opposite approaches to programming: the “bricoleur scientist” (the tinkerer, in these studies), that prefers “a negotiational approach and concrete forms of reasoning”, and the “planner scientist”, that prefers “an abstract thinking and systematic planning”.
Chao (2016) analysed the patterns in visual programming showed by novice programmers during problem-solving activities related to computational problems, and the differences in
participants in this study were 158 college students majoring in information communication from three classes at the same university in northern Taiwan. Chao chose different indicators for the study (classified into 3 categories, Computational practice, Computational design and Computational performance), using only five of them to identify diverse students’ behaviours: sequence, selection, simple iteration, nested iteration and testing. The participants' frequencies of the five indicators were analysed by cluster analysis (Ward's minimum variance (Ward, 1963) and k-means algorithm (Bock, 2007)); four clusters were obtained: sequent approach (students recognizable by their prevalent linear progression in solving computational problems, using mostly sequence or simple iteration); selective approach (students identifiable by their selective and divergent approach to computational problem-solving, using frequently nested iterations and selection); repetitious approach (participants appeared capable in discovering repeated patterns, and with a very high number of simple iteration blocks); trial approach (students that showed a trial and error approach, applying different control-flow blocks during the programming activity and evaluating the effect of their implementation). Comparing the computational performance among these patterns, the results showed that the trial approach seemed to have a significantly lower performance and a worse capacity to create efficient programming sequences than the sequent approach and the repetitious approach. The selective approach and the repetitious approach showed good outcomes related to the programs’ efficiency. Wang, Sy, Liu and Piech (2017) collected log data from one of the most popular platforms for introducing young students to Computer Science and programming, Code.org. They fed the embedded program submission sequences into a recurrent neural network (a Long Short Term Memory architecture (Hochreiter & Schmidhuber, 1997)) and trained it on two tasks of predicting the student’s future performance. They represented each program using an Abstract Syntax Tree, and converted into program embeddings using a recursive neural network. This research study implemented two experiments, using the “Exercise 18” in Code.org environment (1263360 code submissions, made by 263569 students). Knowing the student’s trajectory (namely the sequence of code submission attempts), the success or the fail in the completion of the next programming exercise in the same course was predicted. Furthermore, the researchers evaluated the possibility to predict the success in a programming exercise considering only a certain number of student’s attempts to solve that test. This work presented interesting aspects in terms of the transformation of students’ code attempts in program embeddings over time (other studies are characterized by hand-picked features), and the distinct clusters obtained through this representation, that can predict future students’ performance.
Bey, Pérez-Sanagustín and Broisin (2019) identified three clusters in a dataset created collecting programs from 100 students registered to a three-week course on the essential of Shell programming; they also determined some students’ behavioral trajectories correlated with their performance at the final exam. In this paper unsupervised clustering techniques were applied (mixture Gaussian Clustering algorithm) for automatically identifying learners’ programming behaviour.
Filvà et al. (2019) used k-means technique on data generated by students’ clicks in Scratch (and not on handpicked features), with the objective to categorize learners’ behaviour in programming activities: they identified three different patterns and a strong correlation between these behaviours and the evaluation given by some teachers involved in the research project, using a rubric for programming assessment. The patterns identified were:
the “Blocked development” (those students who are behind in the coding of the program), the “Development at a normal pace” (those students who have a balance of development between the graphics interface of the program and the coding) and the “Rapid development based on trial–error” (those students who make rapid changes in the program and constantly check the results). These researchers affirmed that there is a correlation between those projects in which students make rapid iterations of trial and error and good results. To evaluate different aspects of constructionist activities, other works relied also on external sensors (cameras, microphones, physiologic sensors), and automated techniques, like text analysis, speech analysis, handwriting analysis, and others (Blikstein & Worsley, 2016). A key for future developments and experimentations will probably be connected to the availability and cost of implementation of such technological solutions for classroom assessment. External sensors may be more expensive, whereas embedded software solutions and machine learning algorithms could be effective and reliable in extracting evidence of students’ learning process and helping teachers to provide personalised feedback to students.
The majority of the studies presented above (Berland et al., 2013; Blikstein et al. 2014; Chao, 2016; Wang et al., 2017; Bey et al., 2019, Filva et al. 2019) applied machine learning techniques and data mining approach to data gathered from students during programming activities without the presence of physical robots, obtaining good results in the identification of different patterns in specific tasks. Some of the research results show also a correlation between the patterns and the final grades obtained by students. This dissertation takes the existing work further through the utilisation of educational robots. ERs have a distinctive feature, compared to the programming activity of a virtual avatar as the student can seek constant feedback from the physical object during the programming process, through a number of observations and analysis of the robot’s feedback. These processes promote a recursive activity that tries to optimise the prototype’s behaviour and to reach the desired performance (Sullivan, 2008; Mikropoulos & Bellou, 2013). Within the research described in this dissertation, the data mining techniques applied to data collected during ER projects will allow an analysis of how students understand the robot’s feedback. In a field like ER where quantitative measures are fundamental but maybe restrictive, the use of these new techniques could add important insight to the state of the art. Furthermore, the growing spread of ER projects in schools all over the world and the growing interest on this approach shown by teachers and policy-makers justify the research of new approaches that allow a rich and deeper evaluation of the students’ results. The study proposed by Jormanainen and Sutinen (2012) doesn’t attempt to investigate diverse learning paths, but to identify when students have difficulties in problem-solving and programming tasks. These specific gaps in the current research have prompted the research described in this doctoral thesis.
Table 1. Features, Machine Learning techniques and outcomes of studies carried out in constructionist environments.
Paper Features selected ML techniques Results
Blikstein et al. (2014) [1st experiment]
Code update differential, characterised by: number of lines added, lines deleted, lines modified, characters added, characters removed, characters modified.
Simple regression between exam grades and average size (calculated considering one data point per assignment, they had 4 assignments) of the code updates per student.
No significant results.
Blikstein et al. (2014) [2nd experiment]
Code update differential (see above).
X-means clustering algorithm (applied to data obtained dividing each assignment into four equal time-based segments and extracted the average of each segment).
The clusters appeared to be significantly different from each other; the results with regard to grades showed effect sizes on the order of 0.2 (quite small).
Blikstein et al. (2014) [3rd experiment]
Code update differential (see above).
X-means clustering algorithm (applied to the previous dataset, divided calculating proportion of large, medium, and small changes).
The clusters (2) were quite distinct. The difference in average final grades corresponded to a Cohen’s d of 0.21 (quite small).
Blikstein et al. (2014) [4th experiment]
Code update curves (combination of frequency and size in changes made by students).
Dynamic time warping and scaled dynamic time warping distance (to calculate the difference between two given code update curves).
Considering four assignments, calculated (for the same student) how different his or her curve was related the other assignment.
The results indicated that there was a connection between students’ grades and the amount of change in their programming patterns. The results were not statistically strong.
Blikstein et al. (2014) [5th experiment]
Modelling of a student’s trajectories as an HMM (Hidden Markov Model, each state of the model represents a milestones of the assignment).
Two clustering algorithms: k-medioid and hierarchical agglomerative clustering (to compute the different states of the HMM). Expectation maximization algorithm to compute both the transition and emission probabilities in the state diagram. To find patterns in students transition, clustered the paths through the HMM using a method developed by Smyth (1997).
After defining the 3 clusters, they found that the group a student was clustered into was predictive of his or her midterm grade. The distinction between the groups contained in two clusters was particularly large, having a mean midterm score difference of 7.9% (p < .04, two-tailed t test)."
Berland et al. (2013) Measures of Individual Program States (these measures were calculated for each
X-Means clustering algorithm They found 6 different clusters (Active, Balanced, Compact, Logical, Minimal,
primitives), Logic (number of logic and sensor primitives), Unique primitives (number of unique action, logic, and sensor primitives), Length (number of primitives, equivalent to lines of code in other programming languages), Coverage (the percentage of possible combinations of sensor inputs for which the program state generates actions).
(Explore, Tinkering, Refine) and found that Quality Program is higher in 2 of the above cited phases (Tinkering and Refine). The number of program quality scores (low, average, and high) differed significantly for each period, χ2(4, N = 53) = 441.35, p < .05 quality programs per period became significantly better over time (F = 5.639, p < .01, partial η2 = .163).
Jormanainen & Sutinen (2012)
6 events: Add statement,
Add command to code, Remove line, Upload program to robot, Compiling errors, Sum of all these events.
Decision trees, decision tables, Bayesian networks, and multi-layer perceptrons to predict students’ progress. To measure the accuracy of the tested algorithms, we used the 10-fold cross-validation method.
The J48 algorithm (87.1% accuracy), best-first decision tree (BFTree) algorithm (82.3% accuracy), and multi-layer perceptrons (MLP) algorithm (82.3% accuracy) outperformed other algorithms in the classification of the data in 4 states (green, white, yellow, red).
Chao (2016) Related to Computational practice (5 measures): Sequence, Selection, Simple iteration, Nested iteration
Testing.
Ward's minimum variance method (to identify number of clusters), followed by the k-mean cluster analysis (on the identified cluster number).
Separate ANOVAs and post hoc tests (for descriptive purpose) with the cluster group as an independent factor were conducted to determine the difference of the participants' computational practices among different clusters by comparing the indicators.
They obtained 4 clusters of different approaches (Sequent approach, Selective approach, Repetitious approach and Trial approach). Trial approach groups’ had a significantly lower performance in solving the computational problems and in designing efficient sequences.
Comparing the differences between groups in different clusters they obtained: for students’ performance F(ANOVA) = 4.386 (p < .001), for sequences’ efficiency F(ANOVA) = 9.139 (p <.0001). Wang et al. (2017) [1st experiment, task A]
A student’s trajectory consists of all the program submissions, which are represented as ASTs (that contain all the information about a program
and can be mapped back into a program). These ASTs are converted into program embeddings using a recursive neural network.
Long Short-Term Memory (LSTM) Recurrent Neural Network (RNN).
For both the pathscore baseline model and the LSTM model, they used 90% of the data set to perform training and validation and the remaining 10% for testing. The LSTM model outperforms the path score baseline by around 5% on test accuracy at every trajectory length.
Wang et al. (2017) [2nd experiment, task B]
Same features of their 1st experiment, from ASTs they calculated program embeddings.
LSTM RNN They compared LSTM results with a
Logistic regression algorithm. Logistic regression had higher performance considering Precision (0.7), but LSMT had higher performance considering Recall (0.8).
Bey et al. (2019) Number of Submissions, Average time between two submissions, Average number of changes, Percentage of syntactical errors, Time standard deviation (the standard deviation of the average time between two submissions), Code standard deviation (the standard deviation of the average
number of changes).
Mixture Gaussian Clustering algorithm Cluster 1: students who submit frequently a large number of submissions with short time intervals between submissions, and who make irregular changes in their source code characterized by the most important number of syntactical errors. Cluster 2: students who do not submit an important number of submissions, as they spend more time to make significant changes in their source code. Students of this cluster make however a significant number of syntactical errors as well. Cluster 3: students who submit the lowest number of submissions even if they need a short period of time between two submissions.
Filva et al. (2019) Clickstream K-means cluster analysis Strong correlation (0.93) between the evaluation by rubric and the clicks to the green flag button. The p-value of the statistical test is less than 0.05.
Chapter 2.
2
Methodology
2.1 Methodology description
This dissertation aims to analyse different problem-solving paths that characterize students’ team workflow during an ER lesson by focusing on the step-by-step software development carried out by learners in order to solve the challenges proposed by the educators.
In order to capture behaviours from the field and to perform a deep analysis of the programming sequences designed by students (and of the problem-solving strategies that could be extrapolated), we updated the original Lego Mindstorms EV3 software blocks, in order to write in a log file on an SD card all the attempts carried out by each students’ team involved in the research project, during the resolution of two given exercises (“Software updated into Lego Mindstorms EV3 blocks”, in Figure 4). Sixteen schools were involved in the experimentation, and data were gathered in order to provide input to the clustering and prediction algorithms (“Data acquisition”, in Figure 4).
Then, the dataset was divided into two subsets (schools with students younger than 12 years old and schools with students older than 12 years old): the latter were developed to transform the log files of these two subsets in two features’ matrices (“Algorithmic problem solving for input data transformation”, in Figure 4); which were then evaluated by different algorithms: both supervised approach, using Logistic Regression, Support Vector Machine (SVM), K-nearest neighbors (KNN), Random Forest, and a mixed approach, using both unsupervised K-means clustering, and the previously cited supervised algorithms. This strategy aimed to verify and highlight different patterns in the students’ behaviours, and if these patterns are related to the students’ performances (“Data clustering and performance prediction”, in Figure 4); a model validation was performed to calculate the reliability of the system [using the repeated 10 fold cross validation (Kim, 2009), “Clusters’ model validation” in Figure 4], and a detailed analysis of the clusters in relation to the results obtained by the students was implemented to verify the pedagogical meaning of the project results [“Correlation results (Cluster analysis vs. Student performance)”, in Figure 4].
Similar problem-solving behaviours between the two groups (younger students and older students) have emerged during the analysis: for this reason, the dataset was aggregated again, and the procedure was repeated (from “Data clustering and performance prediction” to “Correlation results”), to verify if the same results were achieved considering the whole dataset. Thanks to this larger dataset, it was possible to use another machine learning technique: the performance of a Multilayer Perceptron (MLP) neural network was compared with the previously cited techniques (Logistic Regression, SVM, KNN, Random Forest).
Figure 4 shows also the teachers’/educators’ workflow during our experimentation: at the beginning of the research project (“Software and firmware installation”, see Figure 4)
teacher had to install updated software and firmware in the school devices (laptops, robotic kits); then, he/she could start the ER activity with students (“ER activity with students”, see Figure 4), at the end of which it was necessary to download log files and upload them to a cloud storage (“Download log files from EV3 brick and upload them to a cloud storage”, see Figure 4); when the ML analysis of the collected data was completed, the teacher gave his/her support for the analysis of the results, trying to compare the findings obtained by the ML algorithms with his/her knowledge about students’ behaviours during standard educational activities (“Clustering results validation from a pedagogical point of view”, see Figure 4). Finally, teachers tried to identify some strategies to help students with worst ER performance results, reflecting also on the problem-solving style showed by them.
As stated before, the students’ workflow in an ER activity could be represented with the TMI cycle. Students, after having observed their robot’s behaviour, discuss in the peer group (or with the expert) about how to improve their artefact and modifies their software to obtain the desired performance, and this procedure usually is repeated many times (Figure 5 shows a diagram of this workflow). This students’ cyclical activity of modifying the programming sequence after having observed the robot’s feedback, tracked by our system, is the input to the following ER Data Analytics.
Figure 5. Student’s activities workflow during an ER intervention
For the research purposes of the work described in this dissertation, the original blocks were modified based on the software suite Lego Mindstorms EV3 Developer kit (2019) with the objective to keep track of all the programming sequences designed by the students’ team involved in Educational Robotics labs. Figure 6 denotes the development of this software update:
• during the students’ team interaction with Lego Mindstorms software, the Lego block input data are defined (students create the programming sequences and define this parameters);
• the EV3 brick executes a programming block and simultaneously performs a Log Writing routine (it doesn’t only perform the standard function of that block, for example turning on/off the motors, reading a value from a sensor, executing a loop or a conditional statement, etc.). It writes on a log file a string containing the principal information of the block (block type, options and parameters set by the students’ team).
• the standard LEGO function, at the end of the process generates a double output: the standard behaviour of the robot and a log file with all the information about the executed blocks.
We substituted the original version of Lego blocks with the one shown in Figure 6 (using the same name and VIX extension of the original blocks) to obtain this new behaviour.
Figure 6. Structure of the Lego Mindstorms EV3 blocks software update
2.2
Participants and procedure
Stakeholders involved in the research project were students from sixteen Italian Primary and Secondary schools, located in the Emilia Romagna, Lazio and Marche regions. The total number of students involved in this study is 455. The experimentation was carried out from March 2018 to October 2019. We used a convenience sampling method to involve students in the experimentation: we collected data thanks to the Robotics courses organized in schools by the startup TALENT (partner in the research project).
Before starting the ER course, students were asked to compile a questionnaire, comprising 3 types of questions:
- Demographic questions (gender, age);
- School-related questions (the category of their favourite subject: TS stands for Technological/Scientific, AH stands for Artistic/Humanistic);
- Technology-related questions (which technologies they use at school or at home, if they use videogames).
Personal data, School-related data and Technology-related data are presented in Table 2 and Table 3.
Figure 7 represents the histogram of students’ usage of technology at school or at home by category.