Scuola di Dottorato di Ricerca in Scienze dell’Ingegneria Curriculum in Ingegneria Meccanica e Gestionale
Methods and tools for reducing food waste
in the household environment
Ph.D. Dissertation of
Advisor
Alessandra Papetti
Prof. Michele Germani
Curriculum supervisor
Prof. Nicola Paone
Acknowledgements
A huge and sincere gratitude to my advisor, Prof. Michele Germani, that allows me to be part of the DT&M Research Group where every day is a challenge between projects, proposals, papers and deadlines, but it is full of satisfactions. Thanks for your daily guidance and support. Thanks to be an example of knowledge, respect and generosity. Thanks for all, Michele.
A heartfelt gratitude to the Indesit Company in the persons of Giorgio
Sabatini, Caterina Madonna and Marco Piccioni for making this research work
possible. Each brainstorming was an explosion of ideas and an opportunity for improvement, thank you very much.
It is a duty and a pleasure to thank Ad Van Berlo and the Onmi team for giving me the opportunity to spend three months of my PhD at you. You allowed me to grow from a professional and personal point of view, integrate my work in a wider smart context and discover the designers’ world. In particular… thanks
Idowu for advises, laughs and making fun; thanks Sander for your special Dutch
lunches; thanks Daniel for the coloured moments and thanks Claartje for the daily ping-pong challenges. Thanks guys to teach me to do something different every day!
A special thanks to all my colleagues to make every working day a pleasure. This work would not have been the same without your friendship, collaboration, and availability. I can’t imagine a better team to be part of. Thanks guys!
I would also like to thank you my friends to be part of my life and share every goals with me. When I need, I know I can count on you! Thank you all!
III
Abstract
The total quantity of food waste in the European Union has been estimated at around 89 million tonnes per year of which about 42% is thrown out by households. Furthermore, it has been esteemed that the 60% of the latter would be avoidable by increasing users’ awareness and encouraging them to adopt better eating habits, which also allow reducing the health and obesity problems.
For this reason, several attempts have been dedicated by the scientific and industrial world to the reuse of food industries wastes, the development of systems for a more efficient waste management and the launch of campaigns to attract interest of citizens on this issue. However, methods and tools able to support consumers to prevent the waste are still lacking.
In this context, the goal of the present research work, carried out in collaboration with the Indesit Company, consists in the study and development of an integrate system able to reduce the household food waste and improve the end-users lifestyle in terms of health and wellbeing.
In particular, a web application and a set of related services have been developed to guide the user in the proper storage of food, support him/her in the purchase planning and suggest the recipes that better satisfy his/her energy and nutritional requirements and need ingredients close to expire.
Such result was possible thanks to the development of a smart fridge equipped with a NFC reader that allows reading specific NFC tags that the user can configure according to the food information. This allows having an updated stocks inventory and tracking the products expirations.
The potentialities of the system has been evaluated from the usability, environmental and economic point of view. Finally, the system integration in a wider smart ecosystem allowed also evaluating its interoperability.
IV
List of Contents
ABSTRACT ... III LIST OF FIGURES ... VI LIST OF TABLES ... X INTRODUCTION ... 1CHAPTER 1 THE FOOD WASTE ... 5
1.1HOW MUCH FOOD IS LOST OR WASTED? ... 7
1.2ENVIRONMENTAL, ECONOMIC AND SOCIAL IMPACT OF FOOD WASTE ... 9
1.3THE REASONS BEHIND FOOD WASTE ... 13
1.4HOW TO REDUCE FOOD WASTE ... 17
1.5THE OVEREATING PHENOMENON ... 18
1.6THE ROLE OF THE CONSUMER ... 21
CHAPTER 2 LITERATURE REVIEW AND COMMERCIAL SOLUTIONS ... 24
2.1ACTION INITIATIVES... 24
2.2HCI AND IOT IN THE FSC ... 29
2.3DRIVING FORCES AND BARRIERS ... 32
CHAPTER 3 THE METHODOLOGY ... 35
3.1ANALYSIS OF USER’S NEEDS AND HABITS ... 36
3.2SERVICES REQUIREMENTS ... 45
3.3INFORMATION MODEL ... 47
3.4SYSTEM ARCHITECTURE ... 50
3.5SERVICES EVALUATION ... 51
CHAPTER 4 THE SYSTEM ARCHITECTURE ... 53
4.1THE CLOUD DATABASE ... 53
4.2THE SMART FRIDGE ... 59
4.3THE WEB APPLICATION ... 61
4.3.1 Check-in ... 63
V
4.3.3 Products list ... 68
4.3.4 Recipes ... 72
4.3.5 Shopping list ... 86
4.3.6 Pharmacies ... 90
CHAPTER 5 SYSTEM PERFORMANCES AND SUSTAINABILITY ... 92
5.1PERFORMANCES EVALUATION ... 92
5.1.1 Recipes algorithm validation ... 93
5.1.2 System usability ... 104
5.2LIFE CYCLE ASSESSMENT ANALYSIS ... 110
5.2.1 Goal and scope definition ... 111
5.2.2 Life Cycle Inventory ... 113
5.2.3 Life Cycle Impact Assessment ... 119
5.2.4 Results interpretation ... 121
5.3LIFE CYCLE COSTING ANALYSIS ... 125
CHAPTER 6 SYSTEM INTEROPERABILITY ... 129
6.1THE APPROACH ... 130 6.2THE CASE STUDY ... 132 6.2.1 Data model ... 133 6.2.2 Data analysis ... 139 CONCLUSIONS ... 146 REFERENCES ... 149
VI
List of figures
Figure 1 – Per capita food losses and waste, at consumption and
pre-consumptions stages, in different regions [13] ... 8
Figure 2 – Food wastage, at world level, by phase and by region of the food supply chain [9] ... 9
Figure 3 – Contribution of each phase of the food supply chain to food wastage and carbon footprint [9] ... 11
Figure 4 – Overweight adults worldwide in 2014 (source: GHO) ... 19
Figure 5 – Obese adults worldwide in 2014 (source: GHO) ... 19
Figure 6 - Waste management hierarchy (source: WFD) ... 24
Figure 7 - User-centred design approach for smart services design ... 36
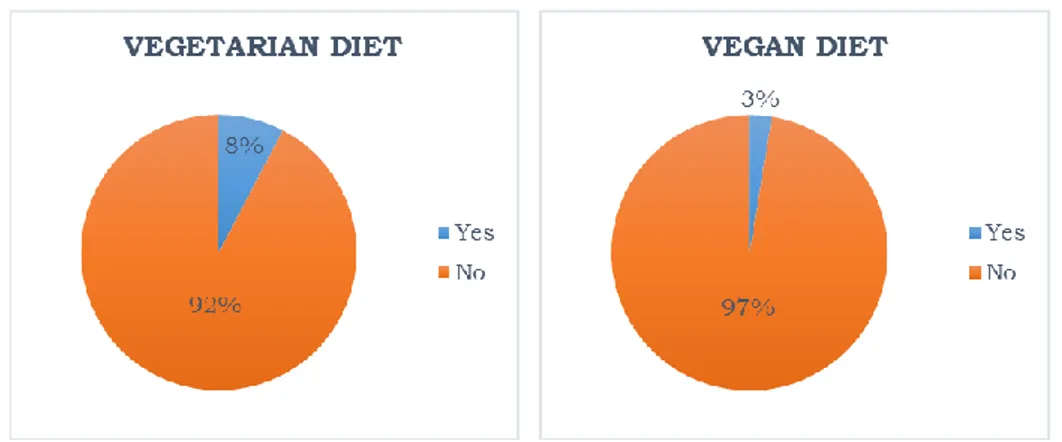
Figure 8 - Family/housing unit in which almost one member follows a vegetarian (left) or vegan diet (right) ... 38
Figure 9 – Most common foods stored in the fridge (left) and refrigerator (right) 39 Figure 10 – Typical food consumed for breakfast ... 39
Figure 11 - Food consumed for lunch ... 40
Figure 12 - Food consumed for dinner ... 41
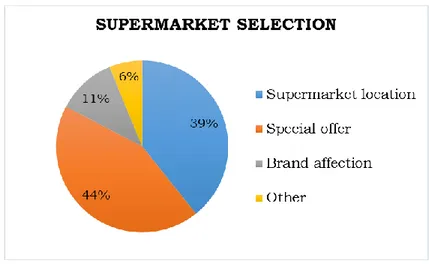
Figure 13 – Supermarket selection criteria ... 41
Figure 14 – Criteria for food placement inside the refrigerator... 42
Figure 15 - Recipes selection criteria ... 43
Figure 16 – Level of waste for each products category according to users’ answers ... 43
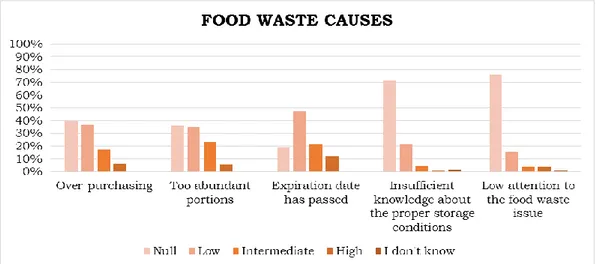
Figure 17 – Causes of household food waste according to users’ answers ... 44
Figure 18 – Users’ appreciation of new services that aim to reduce the household food waste ... 45
Figure 19 – The information model ... 49
Figure 20 – System architecture ... 53
Figure 21 - Database model ... 55
Figure 22 – Entity “Product” ... 56
Figure 23 – Entity “Recipe” ... 57
Figure 24 – Entity “Special offer” ... 58
Figure 25 – Entity “Pharmacy” ... 58
VII
Figure 27 – Smart fridge ... 60
Figure 28 – Check-in and check-out steps ... 61
Figure 29 – User registration and web application menu ... 63
Figure 30 – NFC TAG programming ... 64
Figure 31 – Product check-in by means of the web application ... 65
Figure 32 – Algorithm for the fridge compartment suggestion during the product check-in ... 66
Figure 33 – “Product placement” feature ... 67
Figure 34 – Extract of the algorithm related to the food placement feature ... 67
Figure 35 – “Products list” feature, order by placement ... 69
Figure 36 – “Products list” feature, order by category ... 69
Figure 37 – Product detail screen ... 70
Figure 38 – Algorithm related to the product check-out ... 72
Figure 39 – Recipes filters and list ... 73
Figure 40 – Recipe details and preparation guide ... 74
Figure 41 – Recipe suggestion algorithm ... 75
Figure 42 – Recipes filter according to allergies and intolerances ... 77
Figure 43 – Daily energy requirements by meal ... 80
Figure 44 – Conformity Indicator assignment ... 81
Figure 45 – Correlation matrix between recipes ... 81
Figure 46 – Similarity Indicator assignment ... 82
Figure 47 – Similarity Indicator calculation ... 83
Figure 48 – Assignment of weights for the Priority Indicator ... 83
Figure 49 – Priority Indicator calculation ... 84
Figure 50 – Calculation of Absolute Performance and Relative Performance ... 86
Figure 51 – “Shopping list” feature ... 87
Figure 52 – Algorithm to notify when a product of the shopping list in on offer 88 Figure 53 – Algorithm to notify an offer of a periodic product ... 89
Figure 54 – “Supermarkets” feature ... 90
Figure 55 – “Pharmacies” feature ... 91
Figure 56 – Recipe filter according to the food allergies ... 95
Figure 57 – Conformity Indicator assignment for the User 1 ... 97
Figure 58 - Conformity Indicator assignment for the User 2 ... 98
Figure 59 – Compilation of the correlation matrix ... 99
VIII
Figure 61 - Similarity Indicator assignment for the User 2 ... 100
Figure 62 - Priority Indicator assignment for the User 1 ... 101
Figure 63 - Priority Indicator assignment for the User 2 ... 102
Figure 64 – Recipes suggested to the User 1 ... 103
Figure 65 – Recipes suggested to the User 2 ... 104
Figure 66 – Users’ characteristics ... 106
Figure 67 – Usability evaluation protocol ... 108
Figure 68 – Tasks success ... 108
Figure 69 – Easy of execution of tasks and users’ satisfaction ... 109
Figure 70 – System evaluation by the users sample ... 110
Figure 71 – Food Supply Chain ... 112
Figure 72 – LCA analysis flow chart ... 114
Figure 73 – Ecoindicator 99 (H) impact categories ... 119
Figure 74 – Environmental impact of Scenario 1 by lifecycle phase ... 121
Figure 75 – Detail of the food production environmental impact ... 122
Figure 76 – Comparison of the environmental impact between Scenario 1 and Scenario 2... 122
Figure 77 – Fridge “as is” vs Fridge Dialogic, comparison of lifecycle environmental impacts ... 123
Figure 78 – Fridge “as is” vs Fridge Dialogic, comparison of manufacturing environmental impacts ... 123
Figure 79 – Fridge “as is” vs Fridge Dialogic, comparison of use phase environmental impacts ... 124
Figure 80 – Fridge “as is” vs Fridge Dialogic, comparison of end of life environmental impacts ... 124
Figure 81 – The approach ... 131
Figure 82 – The information model schema ... 132
Figure 83 – Simplified representation of the database model ... 134
Figure 84 – The case study data model ... 136
Figure 85 – Data model of the location “Restaurant” ... 137
Figure 86 – Data model of the location “Home” ... 138
Figure 87 – General location analysis for the User 60 ... 140
Figure 88 – Hot spots identification for the User 60 related to the location “Restaurant” ... 141
IX
Figure 90 – Does the User 60 send a SMS or have a call before and/or after
dinning? ... 142
Figure 91 – Does the User 60 have a conversation during dinning? ... 142
Figure 92 – Which is the mood and the level of stress of User 60? ... 143
Figure 93 – Is there a correlation between the user calls and dinning? ... 144
Figure 94 – Correspondence between users’ personality and the choice of the restaurant... 144
X
List of tables
Table 1 – Literature review about food waste impacts assessment... 10
Table 2 – Estimated costs of food wastage [20] ... 12
Table 3 – Causes of food waste by phase and by region of the food supply chain ... 16
Table 4 – International food waste awareness campaigns ... 25
Table 5 – International organizations and initiatives aimed to the food redistribution ... 27
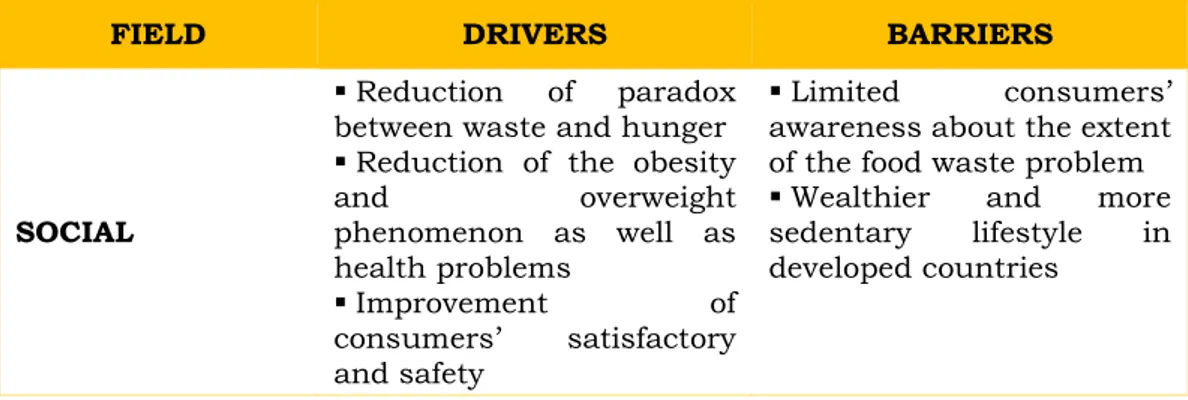
Table 6 – Drivers and barriers toward the household food waste reduction ... 33
Table 7 - Family/housing unit characteristics ... 37
Table 8 – Physical Activity Level ... 78
Table 9 – Assignment rules of the RIzj indicator ... 84
Table 10 – Users’ characteristics ... 93
Table 11 – Users’ Energy Requirement (ER) ... 96
Table 12 – PAL assignment according to the activity tracker data ... 96
Table 13 – Meals consumed in the three days before Day 10 ... 99
Table 14 – Tasks to execute during the usability test ... 107
Table 15 – Hypothesis of foods quantities and relative percentages of consumption and waste ... 115
Table 16 – Hypothetical reduction of the percentage of avoidable food waste by category ... 116
Table 17 – Resources consumption by the household appliances ... 117
Table 18 – Detail of “Assembly freezer door” ... 117
Table 19 – Differences between the fridge “as is” and the fridge “dialogic” ... 118
Table 20 – Results of the LCA analysis referred to the Scenario 1 ... 120
Table 21 – Results of the LCA analysis referred to the Scenario 2 ... 120
Table 22 – Results of the LCA analysis related to the fridge “as is” ... 120
Table 23 - Results of the LCA analysis related to the fridge Dialogic ... 121
Table 24 – Food products cost ... 126
Table 25 – Costs related to the use of household appliances ... 127
Table 26 – Weekly cost related to the food consumed and wasted by a four-members family ... 127
XI
Table 27 – Weekly cost related to the food consumed and wasted by a four-members family that use the smart fridge and exploits the proposed services 128
1
Introduction
In the last years, international efforts and studies are dedicated to the sustainability issue in order to understand the hottest spots, identify common drivers and define approaches and methodologies to increase the global wellbeing from an environmental, economic and social point of view. The residential sector and its dwellers are some of actors involved in this challenge.
They are called to face the energy consumptions reduction, but also the food waste issue. Indeed, the total quantity of food waste is continuously increasing and it is often generate by households. For this aim, the consumers’ behaviour has been investigated by researchers in order to understand everyday practices around food and waste. The results of such studies prove that the main causes of the household food waste are related to the preparation of abundant portions, the incorrect planning of purchases, and the exceeding of the products expiration date.
Despite these evidences, the most of the attempts of the scientific world focuses on the reuse of food waste coming from food industries and the development of more efficient waste management systems, neglecting the importance of the role of consumers. Therefore, methods and tools oriented to the prevention of food waste that help consumers in overcoming their careless attitude towards this theme are not sufficiently deepened. On the other hand, their development is often entrusted to the industrial sector, which is often technology-oriented and loses sight of the users’ needs, habits and expectations. In particular, new systems have to make people aware of the economic and environmental impact of waste and support them in the food management. Indeed, the development of strategies to prevent the food waste remains the first step to achieve ambitious goals in terms of sustainability, rather than focusing on waste itself.
In addition, the developed countries are also dealing with the overeating phenomenon, which is responsible of the overweight and obesity problems and the relative risks to health. Indeed, it consists in an excessive consumption of food that exceed the energy requirements of the organism. Based on these evidences, the new initiatives and solutions related to the food care are called to address both
2
the attitude to waste food and the diffusion of bad eating habits. However, the current technologies usually face the two issues separately.
In this context, the present research work focuses on the development of a smart system that aims to improve the consumers’ eating habits and reduce the food waste overcoming the current state of the art. From a technical and functional point of view, it is based on two important pillars such as the expiration date traceability and the proper information management. Indeed, the combination of these two aspects allows designing new services able to support users in improving their lifestyle in a non-intrusive way. In particular, the collaboration with the Indesit Company, which is an Italian company that produces household appliances, allowed developing a smart fridge able to track the entry/exit of products in terms of typology, quantity and characteristic dates (i.e., purchase, opening, and expiration). On the other hand, the study of the information flow, the creation of a proper information model and the definition of specific algorithms allowed the development of a web application that interacts with the fridge and supports users in the food purchase, storage and preparation. In particular, the proposed system aims to reach the following main objectives:
To reduce the impact of the inadequate storage conditions by suggesting to the user the most proper fridge compartment according to the products typology;
To avoid the purchase of an excessive amount of food by supporting the creation of the shopping list according to the stocks and analysing the historical data to provide efficacious warnings to the user. For this reason, the suggestion of the supermarkets special offers could encourage users to adopt this tool by allowing them to save money;
To help consumers in selecting the most appropriate recipes according to the ingredients available at home or close to expire, the daily energy requirements and the last meals consumed as well as the possible food allergies.
The latter objective is an ambitious goal also from a scientific perspective. Indeed, it aims to find the right trade-off between different aspects such as helping the user in maintain a balanced diet, limiting to throw away edible food and avoiding that food exceeds its expiration date.
3
Furthermore, to encourage the researchers to invest their efforts in the study and development of new technologies able to address the food care issue and the actors of the Food Supply Chain (FSC) to collaborate in order to reach a common goal, the potentialities of the proposed system has been assessed from several points of view. In particular, the benefits in terms of environmental impact and costs has been preliminarily esteemed by taking into account the weekly eating habits of a typical Italian family. In addition, the interoperability of the system has been evaluated by proposing its integration in a wider smart ecosystem, which is the subject of an European project that aims to help people in changing their behaviours and improving their health conditions and wellbeing. For this reason, an information model that efficiently integrates the system has been created and a methodology that ensures a proper high–level information management to identify the most proper Dos messages (i.e., actions to do) to send to the user according to his/her lifestyle has been developed.
Henceforward an overview of the thesis is given. As anticipated, the thesis topic is the study and development of an ICT tool able to support consumers to address the food waste challenge and follow daily food-related best-practices. In particular, Chapter 1 illustrates the context by introducing the concept of food waste, providing an estimation of its extent and impacts, analysing the main causes at different level of the FSC and proposing possible solutions, describing the correlation with the obesity phenomenon and the relative concerns worldwide and, finally, treating the relevance of the consumer role. Chapter 2 investigates the literature and the Internet of Things (IoT) market to provide an overview of the existing initiatives and ICT solutions. It also summarizes the driving forces and barriers related to the success of the current methods and tools. Chapter 3 presents the methodology adopted to design and develop the system. It highlights the importance to analyse the user needs for the definition of system requirements and to create an accurate information model for the design of an efficient system architecture and satisfactory services. Chapter 4 describes the system architecture and the relative functionalities. In particular, the structure of the database, the smart fridge operation and the features of the web application are presented in detail. Chapter 5 evaluates the system from several perspectives. Indeed, it describes the performances of the system by means of the validation of the algorithm that suggests the most proper recipe to the user and the results of the usability analysis that has been carried out by involving a sample of 10 users.
4
Furthermore, it illustrates the results of the Life Cycle Assessment (LCA) and Life Cycle Costing (LCC) analysis that allowed evaluating the benefits of the system respectively from an environmental and economic point of view. Chapter 6 aims to demonstrate the system interoperability by describing the creation of a data model that integrates the proposed system in wider smart environment. Furthermore, it presents the approach adopted to elaborate the data, to identify the users profile and to define how intervening to help users to improve their behaviours. The implementation of such approach is an ongoing activity, however, some preliminary results of its first steps are presented.
Finally, the last section summarizes the outcomes of the thesis, highlights its strengths and weaknesses and introduces the future works that have to be undertaken.
5
Chapter 1
The food waste
The food care, at each step of the supply chain, is assuming a worldwide relevance both at research and industrial level since it is one of the most important pillars of the sustainable and healthy society. However, this theme is a huge challenge that involves a lot of stakeholders. Several aspects have to be taken into account to guarantee and improve people well-being preserving the environment and limiting costs.
For example, the first steps of the supply chain (e.g., agriculture, livestock, etc.) should work in harmony with the natural environment instead of not to give to the land the proper rest, to use chemicals fertilizers and other pollutants, to concentrate an unnatural number of animals in one place, etc. Therefore, all actors involved in these stages are called to reduce the environmental impact and to guarantee the food genuineness. However, the food supply chains, especially upstream, mainly consist of small and medium-sized enterprises that not always succeed to face huge investments to improve environmental care and quantify the related financial effects.
From another point of view, to support decision making and influence buying behaviour, stakeholders and consumers need to be informed about sustainability of the companies, products, and processes. Therefore, food supply chains need to be transparent. In particular, the transparency of a supply chain is defined as “the degree of shared understanding of and access to product-related information as requested by a supply chain’s stakeholders without loss, noise, delay, or distortion” [1]. However, in the majority of cases, the environmental information provision mainly focuses on the single business unit even if the impacts are caused by the supply chain. This is due to the fact that to create transparency is perceived by businesses as costly in the short run since in many cases its benefits will only occur in the long run. It is a barrier to the implementation of systems that reduce the environmental impact. Another problem is the tacit character of producing in a sustainable way; it implicates that the compensation of sustainability efforts in pricing is problematic.
6
Another aspect that plays a key-role in the food care issue is the food traceability, which becomes mandatory to guarantee the food safety and satisfy the consumers’ expectation. It can be defined as “the part of logistics management that capture, store, and transmit adequate information about a food, feed, food-producing is correct animal or substance at all stages in the food supply chain so that the product can be checked for safety and quality control, traced upward, and tracked downward at any time required” [2]. For this reason, the main efforts focus on the development of technologies able to ensure an accurate information flow through the supply chain without an excessive increase in costs [3].
However, in this context, a more critical scenario is emerging: the paradox between food waste and hunger [4] [5]. According to the estimations of international organizations, there are 795 million undernourished people in the world today [6]. It means that one in nine people do not get enough food to be healthy and lead an active life. In particular, 6.3 million children under the age of five died in 2013 and about 45% of all deaths are linked to malnutrition [7]. Therefore, more than half of these early child deaths are due to conditions that could be prevented or treated with access to simple, affordable interventions. And yet, food availability is enough to feed the population of the world. This highlights the global economies imbalance and pushes the industrialised countries to deal with the high amount of food wasted every day as well as the growing relevance of the obesity problem. For this reason, in order to identify the causes and, consequently, propose valid solutions, it is essential, first of all, to define the food waste concept. There is not a standard definition in literature, therefore, the international organizations and several research studies tried to provide one.
The first definition of food waste was given by the Food and Agriculture Organization (FAO): “wholesome edible material intended for human consumption, arising at any point in the FSC that is instead discarded, lost, degraded or consumed by pests” [8]. During the years, it has been reviewed and integrated and, in a recent study of FAO, a new distinction between food loss, food waste and food wastage has been introduced [9]:
Food loss – a decrease in mass (dry matter) or nutritional value (quality) of food that was originally intended for human consumption. These losses are mainly caused by inefficiencies in the food supply chains, such as poor infrastructure and logistics, lack of technology, insufficient skills,
7
knowledge and management capacity of supply chain actors, and lack of access to markets. In addition, natural disasters play a role.
Food waste – food appropriate for human consumption being discarded, whether or not after it is kept beyond its expiry date or left to spoil. Often this is because food has spoiled but it can be for other reasons such as oversupply due to markets, or individual consumer shopping/eating habits.
Food wastage – any food lost by deterioration or waste. Thus, the term “wastage” encompasses both food loss and food waste.
Furthermore, the food wastage can be both edible and inedible according to the following definitions [10]:
Avoidable – food and drink thrown away that was, at some point prior to disposal, edible (e.g., slice of bread, apples, meat).
Possibly avoidable – food and drink that some people eat and others do not (e.g., bread crusts), or that can be eaten when a food is prepared in one way but not in another (e.g., potato skins).
Unavoidable – waste arising from food or drink preparation that is not, and has not been, edible under normal circumstances (e.g., meat bones, egg shells, pineapple skin, tea bags).
1.1 How much food is lost or wasted?
To provide an accurate global estimation of food waste is not a simple issue. It is hindered by the limited availability and heterogeneity of data, however, several attempts has been carried out adopting different approaches and methods. A review of them has been carried out within the European project FUSIONS (Food Use for Social Innovation by Optimising Waste Prevention Strategies) [11]. In particular, some studies focus on quantitative and qualitative data coming from literature, statistics and questionnaires as well as assumptions. Other ones exploit standard approaches on quantitative techniques to estimate the level of wasted food [12].
Taking into account the studies carried out by the Swedish Institute for Food and Biotechnology (SIK) on request from the FAO, approximately one-third of all food produced globally for human consumption is lost or wasted, around 1.3 billion tonnes per year [13]. Food is wasted at different stages of the FSC, both in
8
medium- and high-income countries and in low-income countries. As shown in Figure 1, food loss and waste in industrialised countries are as high as in developing countries, but different waste-generation patterns exist around the world:
In developing countries, it mostly occurs upstream of the food supply chain (i.e., agriculture, postharvest, animal production, processing, distribution, etc.);
In industrialised countries, it mostly takes place at retail and consumer stage.
Therefore, the main difference between developed and developing countries is the amount of waste at the end of the food supply chain. In Europe and North America, this waste amounts to 95-115 kg per capita per year, while in Southeast Asia and Sub-Saharan Africa, only 6-11 kg per person of food is wasted by consumers [13].
Figure 1 – Per capita food losses and waste, at consumption and pre-consumptions stages, in different regions [13]
Going into more detail, the left chart of Figure 2 illustrates the amounts of food wastage by phase along the food supply chain and highlights a high responsibility of the consumption phase (22%) as well as upstream stages of the FSC (54%) [9].
An in-depth analysis of the food supply chain phases by regions (right chart of Figure 2) confirms that upstream losses occurring at agricultural
9
production phase appear homogenous across regions and downstream wastage occurring at consumption level is much more variable. Indeed, the latter is about 31–39 percent of total wastage in middle and high-income regions and 4–16 percent in low-income region [9].
Figure 2 – Food wastage, at world level, by phase and by region of the food supply chain [9]
Focusing on the European Union, the total quantity of food waste has been estimated over 100 million tonnes per year [14]. About 40% of waste is thrown out by households, of which 60% would be avoidable. Without additional prevention policy or activities, food waste is expected to rise to over 120 million tonnes by 2020.
Looking only at household waste and using various national data sources, the Barilla Center for Food & Nutrition (BCFN) found that the amount wasted per person per year is: 110 kg in Great Britain, 109 in the United States, 108 in Italy, 99 in France, 82 in Germany and 72 in Sweden [15].
In Italy, according to the study of Prof. Segrè and his research group, nearly 12 billion of euros of food – which could feed 636000 people – are thrown away annually, 20 millions of tonnes of edible food is wasted every year and 250 kilograms of food is thrown away by supermarkets every day [16].
1.2 Environmental, economic and social impact of
food waste
Everyone knows that food waste is one of the challenges that the world have to deal with, but few really knows the extent of the problem and its impacts. It is often seen as an injustice or a moral obligation because of the paradox with the hunger that involves low-income countries. Sometimes, people realize that
10
reduce household waste allow them to save money. However, in few cases it is associated to the environmental damage.
Therefore, it is worth to highlight that wasting food has a threefold impact: environmental, economic and social.
Several studies have been carried out to estimate the food waste impact even if they usually focus on one of the three perspectives. In Table 1 the main relevant works and the respective topics are indicated.
Table 1 – Literature review about food waste impacts assessment
AUTHORS ENVIRONMENTAL IMPACT ECONOMIC IMPACT IMPACT SOCIAL
S. Salhofer, 2008 [17] x L. Ventour, 2008 [18] x M. Kummu et al., 2012 [19] x BFCN, 2012 [15] x x x FAO, 2013 [9] x FAO, 2014 [20] x
A. Bernstad Saraiva Schott
and A. Cánovas, 2015 [21] x
According to the results described in a review paper of eight previous publications [21], the climate impact from prevention of end-consumer food waste has been estimated to between −0.8 and −4.4 kg CO2/kg prevented waste. In
general, the review shows that benefits related to end-consumer food waste prevention are largely explained by avoided food production and related services, rather than reduced waste management.
M. Kummu et al. said that 23–24% of total use of water, cropland and fertilisers are used to produce losses, half of which could be prevented with a more efficient supply chain and could fed one billion extra people [19].
A FAO study [9] investigated the magnitude of food wastage impacts on the environment and relative sources along the food supply chain. It is based on a life cycle approach and focuses on impacts on climate, water, land, and biodiversity. The results show that the carbon footprint of food wastage – without accounting for GHG emissions from land use change – is 3.3 Gtonnes of CO2 equivalent: as
11
such, it ranks as the third top emitter after USA and China. In particular, Europe, North America & Oceania and Industrialized Asia have the highest per capita carbon footprint of food wastage (approximately 700 to 900 kg CO2 eq. per capita and per year). Analysing the contribution of each phase of the FSC (Figure 3), it emerges that the consumption phase is the most critical one despite the food wastage volume at this level is lower than that at upstream stages.
Figure 3 – Contribution of each phase of the food supply chain to food wastage and carbon footprint [9]
As far as the global blue water footprint (i.e., the consumption of surface and groundwater resources) of food wastage is concerned, it has been esteemed to about 250 km3[9]. Furthermore, it is worth to highlight that it is higher than
that of any country.
In addition, to produce uneaten food vainly occupies almost 1.4 billion hectares of land, which represents about the 30 percent of the world’s agricultural land area [9].
Despite numerous approaches and contributions related to the environmental impacts assessment, a clear guidance on how to evaluate the benefits associated to the implementation of food waste prevention initiatives or systems is still missing.
The social impact of waste can partly be tackled recalling the food security concept that describes the state in which “all people, at all times, have physical, social, and economic access to sufficient, safe, and nutritious food to meet their
12
dietary needs and food preferences for a healthy and active life”, according to the definition provided by the World Food Summit in 1996 [22]. Therefore, from a social point of view, the food availability should be able to satisfy the energy requirements of the global population and guarantee an equilibrate diet with the proper nutrient content. However, the malnutrition continues to be one of the major public health problems, especially in the poorest areas of the world.
From the other side, in societies where availability is abundant and access to food is guaranteed, food waste from overeating is becoming a serious problem to deal with as well as the obesity phenomenon. For this reason, it is worth to highlight that the quantity of food that ends up in the garbage in industrialized countries (222 million tons) is nearly equal to the available food production in Sub-Saharan Africa (230 million tons) [15].
To estimate the economic impact of food waste is an arduous challenge because of numerous aspects that must be considered and the relative hidden costs. For this reason, the FAO introduced a methodological approach for the full-cost accounting (FCA) of the food wastage footprint. According to the FAO study, the total cost of global food wastage amounts to USD 2.6 trillion annually, roughly equivalent to the GDP of France, or approximately twice total annual food expenditure in the USA [20]. As shown in Table 2, such amount comprehends:
Economic costs related to the wasted food and subsidies;
Environmental costs related to the environmental impacts to the atmosphere, water, land and biodiversity that must be paid by society and future generations;
Social costs affecting people’s well-being and livelihood, which are related to the environmental degradation, the increasing scarcity of natural resources and the health damage.
Table 2 – Estimated costs of food wastage [20]
COST CATEGORIES (billion USD) COSTS
Environmental costs 696
Social costs 882
Economic costs 1055
13
Quantifying the full costs of food wastage allows increasing the global awareness about the impact of food system inefficiencies, encouraging concrete actions to address the supply chain weaknesses and better evaluating the associated benefit-cost ratio (BCR).
1.3 The reasons behind food waste
The reduction of the described impacts is a global challenge that governments, industries and consumers are called to face. The first step to reach such goal is the analysis of the food supply chain and the identification of weaknesses and hot spots to really understand the causes of food waste. For this reason, several studies have been conducted, some of them focusing on single country [23] [24], others facing the problem from a global perspective.
Food is lost or wasted along the whole food supply chain, from initial agricultural production down to final household consumption. However, the first evidence is the strong dependence of causes from FSC phases and regions’ characteristics. For this reason, the same distribution of food waste, shown in Figure 2, can confirm this statement.
In low-income countries food is mostly lost during the production-to-processing stages of the FSC and the major causes are [13] [15]:
Limited technical, financial, and managerial resources;
Premature harvests due to urgent need for food or to obtain income; Inefficient and obsolete practices, harvesting methods, technologies, and
infrastructure;
Storage facilities and logistical management that do not ensure proper conservation conditions and which promote deterioration or insect infestation.
On the other hand, the highest-income countries can take advantage of more efficient techniques, advanced technologies, systems and infrastructures and agronomic expertise that allows them to reduce the food waste. Indeed, in these regions, it occurs because of overproduction, the lack of demand for certain products at certain times of the year, high levels of perfection in appearance and freshness required by consumers and qualitative standards for human consumptions imposed by national and international laws [13] [15].
14
At the processing phase, technical inefficiencies and malfunctions play a key-role in all regions. However, in low income countries, they are more frequent and have a higher impacts. In the industrialized regions, they lead to defects in terms of weight, shape, appearance or packaging and, consequently, to dispose the final products, although their safety, taste and nutritional value have not been affected [13] [15].
At retail level, the large quantities to get beneficial prices and a wide range of food types and brands, offered to satisfy the consumer expectations, lead to food waste in industrialized countries. Indeed, a lot of products reach their “sell-by” date before being sold or are ignored by consumers because too close to their expiration. Instead, in developing countries wholesales and supermarkets are often small, overcrowded, unsanitary and lacking cooling equipment. Too few facilities satisfy the storage and sales conditions requirements [13].
In the developing countries the food wastage at household level is particularly low. To the contrary, the increase in average income and availability and variety of food has progressively led developed countries to greater tolerance to food waste. Indeed, several studies prove that the main causes of the household food waste are related to the preparation of abundant portions, the incorrect planning of purchases, and the confusion about the product expiration dates. Furthermore, food too often is not consumed in time and it is thrown away because deteriorated [15].
In particular, consumers’ tend to buy more food than needed. Such a behaviours is influenced by several factors, for example:
Incorrect planning of purchase often related to the lacking awareness about the food stocks available at home [25];
Retailers’ pricing strategy for foods (e.g., price promotions, 2x1 special offer, lower price per unit for bigger package sizes, etc.) [15] [25];
Stock of items bought for a special recipe or occasion that has never occurred or has been partly consumed and never reused. At some point, these items are thrown out [26].
As far as the food preparation and consumption are concerned, several studies stated that portions too much abundant are served and, consequently, too much food remain on the plate [15]. According to the WRAP study, nearly a third
15
by weight and three tenths by cost of edible food was thrown away in UK (1,2 million tonnes annually) because it was left over on the plate [18].
In relation to the date labels, the results of dedicated studies highlight that the majority of people is not able to correctly distinguish between “best before”, “use by” and “display until” dates. In particular, from a study carried out by WRAP it emerged that only two fifths of the interview participants were able to give a full and correct definition of the labelling system [27].
Consequently, all the dates are often treated in the same manner because consumers do not know the existence of the difference between them. In other cases, they are aware of this distinction and want differentiate their behaviour according to the specific information, but they do not know the exact meaning of it. For example, a Belgium survey demonstrated that 30,4% of respondents not to know the difference of meaning between date labels [28]. Moreover, someone is reluctant about the data reliability and accuracy. All these misunderstandings lead to throw away edible foods.
Another factor that should not be underestimated is the lack of knowledge or carelessness about the proper storage conditions of the products. In general, people do not check the fridge temperature to verify that it is adequate or do not know which is the most appropriate placement of foods in the fridge. This behaviours reduces the shelf-life of products. For example, 76% of participants in one telephone survey stated that they would have clear instructions on how food should be stored to prolong its shelf-life and some participants stated that they would prefer specific instructions about where to store products, rather than just a generic “store in a cool dry place” [27].
It is worth to specify that also packaging and its functions play a significant role for the amount of food waste in households. For this reason, a Swedish study demonstrated that 20-25% of the food waste was related to the packaging design attributes [29].
Underlying all these aspects, there are other causes of household food waste that can be addressed through consumer-targeted policies: lack of awareness about the extent of food waste issue; lack of knowledge about prevention measures; low attention in food purchasing because of the abundant availability and a generally low price level of food; consumers’ preferences and attitudes and socio-economic factors [30]. In order to overcome these difficulties,
16
new methods and tools able to lead users in the food preparation and consumption are required.
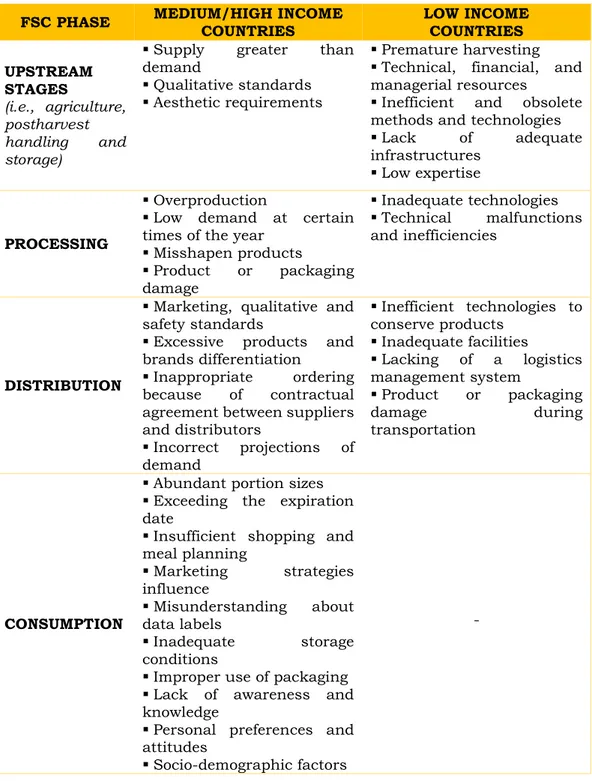
Table 3 summarizes all possible causes of food waste distinguishing them by region and by FSC phase.
Table 3 – Causes of food waste by phase and by region of the food supply chain
FSC PHASE MEDIUM/HIGH INCOME COUNTRIES LOW INCOME COUNTRIES
UPSTREAM STAGES (i.e., agriculture, postharvest handling and storage)
Supply greater than demand
Qualitative standards Aesthetic requirements
Premature harvesting Technical, financial, and managerial resources Inefficient and obsolete methods and technologies Lack of adequate infrastructures
Low expertise
PROCESSING
Overproduction
Low demand at certain times of the year
Misshapen products Product or packaging damage Inadequate technologies Technical malfunctions and inefficiencies DISTRIBUTION
Marketing, qualitative and safety standards
Excessive products and brands differentiation
Inappropriate ordering because of contractual agreement between suppliers and distributors Incorrect projections of demand Inefficient technologies to conserve products Inadequate facilities Lacking of a logistics management system Product or packaging damage during transportation CONSUMPTION
Abundant portion sizes Exceeding the expiration date
Insufficient shopping and meal planning Marketing strategies influence Misunderstanding about data labels Inadequate storage conditions
Improper use of packaging Lack of awareness and knowledge
Personal preferences and attitudes
Socio-demographic factors
17
1.4 How to reduce food waste
One of the first initiatives against food waste was the conference “Transforming food waste into a resource” (October 2010), organized by the Last Minute market at the European Parliament in Brussels. In that occasion, the “Joint Declaration Against Food Waste” was presented according to which governments are called to develop strategies and resolutions aimed to halve food waste by 2025. Nowadays, several EU legal instruments address the issue of treatment of bio-waste as, for example, the Waste Framework Directive (WFD) [31] that laid down two important waste management requirements: the environmental and human health protection during waste treatment and the priority for waste recycling. However, the development of strategies to prevent the food waste remains the first step to achieve ambitious goals in terms of sustainability, rather than focusing on waste itself.
It is worth to remember that synergic strategies and differentiated, focused actions according to the specific consumers’ target group are some of the most important pillars of a successful intervention. For this reason, the standardization of definitions, metrics and assessment methods and the data sharing could be the first step to better understand the extent of the food waste phenomenon, the relative causes and the possible intervention areas.
First of all, strategies should be finalize to minimize the inefficiencies that lead to losses and waste, rather than focusing only on recovery initiatives. When waste cannot be eliminated, the priority should be to take action to recover and redistribute it to struggling sections of society. When waste cannot be redistributed, it should be designated for reuse for other purposes, such as animal feed or bioenergy production [15].
Cooperation and agreements between several actors of FSC (i.e., farmers, producers, and distributors) could reduce the risk of overproduction by ensuring a more appropriate planning of food supply according to the demand trends and projections. Furthermore, in each stage of the FSC, it is essential to train operators in order to improve their skills and knowledge, to ensure the food production, handling and storage according to food safety standards and to encourage the adoption of good agricultural and hygienic practices [30].
In this context, governments are called to improve the date labelling system, to tax food waste and potential changes that alter the economic feasibility
18
and to ensure that the adoption of standards does not introduce unjustified losses and waste along the food supply chain.
On the other hand, increasing the efficiency, reducing the reputational damage, and enhancing the brand image and value are the main drivers behind retailers’ activities. Therefore, these latter should lead to relax quality standards related to aesthetic factors, also towards suppliers and importers, innovate packaging in order to increase the shelf-life of foods and develop markets for suboptimal products [25].
As far as consumers are concerned, creating awareness about the food waste issue as a whole and the individual daily food related practices is a prerequisite for a successful action. Most experts suggest that the education is the starting point to change people’s attitudes towards the current massive food waste. Indeed, it is important to teach consumers how to purchase, preserve, prepare, and ultimately dispose of food in a more sustainable way [15]. For example, to help users to better use the domestic refrigerator (e.g., by setting the most proper temperatures) could be a first simple step to increase the storage lives of food and reduce waste [32]. Also the correct interpretation of the expiry date as well as the assessment of foods by looking, smelling and tasting play a significant role. Information initiatives need to be promoted via various sources and undergoing crucial life moments, which are known to entail changes in perceptions and habits.
Furthermore, other campaigns to promote the use of “doggy bag” at restaurants or to encourage the diffusion of leftover cookbooks in bookstores could be carried out to address the food waste problem [25].
1.5 The overeating phenomenon
In addition to the food waste problem, the growing availability and differentiation of foods in developed countries are leading an excessive consumptions that exceed the energy requirements of the organism. The overeating phenomenon is one the most relevant causes of overweight and obesity as well as other health problems. For this reason, the overeating and food waste are often linked and new food care initiatives and solutions are called to deal with both aspects.
19
In particular, obesity-related health problems has more than doubled since 1980. In 2014, 39% of adults (more than 1,9 billion) were overweight (BMI ≥ 25 kg/m2) and 13% of adults (over 600 million) were obese (BMI ≥ 30 kg/m2),
according to Global Health Observatory (GHO) data. The prevalence of overweight in high income countries was more than double that of low and middle income countries. For obesity, the overall prevalence is over four times higher in high income countries compared to low income countries. As shown in the following charts, Americas and Europe have the highest concentration of overweight and obese people that amounts respectively to 61% and 51% for overweight (Figure 4) and to 27% and 23% for obesity (Figure 5) [33].
Figure 4 – Overweight adults worldwide in 2014 (source: GHO)
Figure 5 – Obese adults worldwide in 2014 (source: GHO)
It is indicative of a worsening trend of poor diets and low physical activity levels that has to be inverted to preserve the population health. The majority of
20
developed countries are called to face this problem by means of concrete initiatives able to improve consumers’ food habits. Indeed, a regular food intake is required for the basic physiological functions of everyday life, such as blood circulation, respiratory activities and cell turnover.
For this reason, universal dietary recommendations has been defined by health authorities and institutes and many governments policies are pushing for their divulgation in order to reach the population nutritional goals. These recommendations are based on prevention of nutritional deficiencies on one hand, but also aim at reducing chronic diseases and obesity on the other hand.
In order to encourage a change in the consumption and production practices, oriented to the adoption of a heathy diet with a lower environmental impact, all actors of the FSC have to be involved. For this aim, several approaches, instruments, measures, and actions could be adopted at different stages of the supply chain, as suggested by the European Commission (EC) and international research institutes [34] [35].
In particular, actions of food producers should be finalized to avoid an unsustainable and unhealthy competition. This is possible by setting minimum standards, promoting certified/labelled food, making the healthy option available and affordable and advertising best practices as well as the development of novel products according to social, environmental and health issues and societal expectations.
Government can influence the food market and consumption patterns by means of:
Scientific information and education campaigns to raise awareness of the health problems related to poor nutrition, overweight and obesity;
Structures, programs and projects for direct public feedbacks and physical activities promotion;
Sustainable food procurement for school, public offices, etc.;
Concession of incentives or healthcare insurance based on people lifestyle healthiness;
Direct restrictions on sales and advertising of less healthy food to protect consumers’ health;
Promoting transparency on the environmental, social and health aspects of specific food products (e.g., via voluntary or obligatory labelling rules);
21
Limiting possible cartels block that obstacle the healthier foods consumption;
Fostering innovation policies that support the development of healthy and sustainable food products.
Consumers themselves play a key-role in changing consumption patterns and are the most important driver for a sustainable food production and innovation. In particular, they should be exercising more sustainable and healthier choices, organising local healthy food clubs or associations and putting pressure on industry to respect sustainable and healthy values.
1.6 The role of the consumer
A key-role for the success of the proposed strategies is played by consumers. Therefore, it is worth to focus the attention at this stage of the FSC in order to make people aware of the impact of household waste and the importance of their contribution in reducing it. For this aim, the consumers’ behaviour has been investigated by many researchers in order to understand everyday practices around food and waste from the household perspective. For this reason, the Theory of Planned Behavior (TPB) [36] is often used as a starting point to predict household decisions to minimize or recycle waste.
The food demand is not only related to the survival and satiety issue but it is influenced by other factors such as enjoyment, preference, culture, prestige, etc. People have different economic, social, and demographic characteristics and, consequently, different behaviours and attitudes to the food consumption and waste. For this reason, Gracia and Albisu [37] analysed the main determinants of differences between European countries in terms of food-related behaviour as well as common patterns. It emerged that the macro-economic factors influenced the expenditure allocated to food; countries’ culture and history continue to characterize the diet patterns and the people age is responsible of many differences related to meals patterns (e.g., ready-to-eat meals vs traditional meals, home cooked meal vs eating out, etc.). However, a general and common trend emerged: consumers are becoming more interested, knowledgeable and critical towards food, therefore, they requires a more added value, safety and diversified products that allow them to follow an adequate and varied diet to maintain good health and prevent diet-related disease.
22
In addition to these evidences, L. Secondi et al. [38] stated that older people, women, individuals with a lower level of education and people living in rural areas are less likely to generate waste respectively compared with youths, men, individuals with a higher level of education and people living in urban areas. Looking at Italian consumers, Cersosimo et al. [39] discussed in a deepened way about the evolution and trends of food consumptions of Italian families as well as the behaviours that they have adopted in response to the crisis and its social and economic impacts. The authors stated that the crisis has made Italian consumers less compulsive than in the past. Indeed, they pay more attention to reduce waste rather than give up essential goods.
However, several studies shows that few consumers are aware of the amount of food they waste and the related impacts, especially the environmental one [40] [41] [42]. On the other hand, the most important pillar for the success of any strategies is the general people aversion to waste [43]. In order to enhance such aversion, it is important to increase the consumers’ perception of economic and environmental implications of food waste. However, awareness campaign alone could be ineffective. Indeed, it is necessary to identify consumers’ segments according to the food-related practices in order to adopt tailored policies and actions as well as the definition of drivers and barriers that characterize each target group. Only in this way several approaches and tools can be developed.
For this aim, Verain et al. [44] identified three consumer segments that differ in the relative importance and perceptions associated with healthiness and sustainability as compared to price and taste: proselves, average consumers and sustainable conscious consumers. De Carvalho et al. [45] developed a Consumer Sustainable Consciousness Construct that identifies five main dimensions lied behind the sustainable consumers’ behaviours: sense of retribution, access to information, labelling and peer pressure, health, and crisis scenario.
Several researches sated that cost is one of the key triggers that could encourage the waste reduction [40] [41].
K. Parizeau et al. [46] observed that multiple factors (i.e., social, cultural, economic, and institutional) influence household food waste practices, therefore, many policy levers should be adopted. They also confirm the importance of the collaboration between several actors of FSC in encouraging consumers to waste less.
23
Aschemann-Witzel et al. [25] carried out a literature review and expert interviews to identify cause and potential of actions related to the household waste and observed that socio-demographics factors are less relevant than the psychographics ones. Indeed, the latter predispose consumers’ concerns, perception and behaviours in the store, as well as in their households. The same results has been obtained by E. Ganglbauer et al. [47], exploiting the “theory of practice” lens. In particular, they suggest the development of strategies and technologies that support consumers’ intentions about the waste reduction by improving their everyday practices. In the same way, the of study Stancu et al. [48] suggests that food-related routines are the main drivers of food waste in addition to perceived behavioural control. Among the routines, the leftovers reuse and shopping ones are the most important.
In conclusion, several actors of the FSC should collaborate to undertake initiatives aimed to increase the consumers’ awareness and influence their behaviour. Each strategy should be tailored to the target users’ group and exploits different means. In particular, they should highlight the environmental impact of waste, exploit the financial issue as a driver, suggest the best-practices that consumers’ have to follow (i.e., reuse leftover, check the stock and their expiration date, reduce the portions size, preserve food correctly, etc.) and help users to understand the benefits for the whole society that could arise from their actions.
24
Chapter 2
Literature review and commercial
solutions
In literature, a lot of papers focus on the reuse of food waste coming from food industries [49], the systems to engage people in behaviours of recycling [50] and the assessment of waste management systems [51]. However, methods and tools oriented to the prevention of food waste that help consumers in overcoming their careless attitude towards this theme are not sufficiently deepened. For this reason, in the following paragraphs a review of existing initiatives, intelligent household appliances and smart technologies that aim to reduce the food waste at household level is presented.
It is worth to highlight that also the Waste Framework Directive indicates that the highest priority of the waste legislation and policy of the EU Member States has to be paid to the food waste prevention, as shown by hierarchy of Figure 6.
Figure 6 - Waste management hierarchy (source: WFD)
2.1 Action initiatives
There are many organizations and action initiatives in the world aimed at the food waste reduction. Awareness campaigns, online platforms, websites and applications, training programs, regulatory instruments, call for research projects, and “zero impact” initiatives are the main instruments adopted for this aim [15] [30].
25 Food waste awareness campaigns
The majority of awareness campaigns are addressed to consumers, but sometimes also schools and restaurants are the target as well as industries.
Some of them (e.g., Think.Eat.Save, Every Crumb Counts, Food Surplus Entrepreneurs Network, etc.) aim to galvanize widespread global actions and catalyse different sectors and actors to share ideas and know-how and undertake projects in order to face the food waste problem. Other movements (e.g., Stop Wasting Food, Stop Food Waste, Slow Food, DoSomething’s FoodWise, Réduisons nos déchets, etc.) seek to increase the public awareness by mobilizing the press and media and encouraging discussion, debate and events. Other initiatives focus on training programmes or student education (e.g., Edible Schoolyard Project, Waste No Food, Appetite for Action, etc.). Furthermore, a lot of information tools such as internet websites, guides and handbooks have been created and several documentary films on food waste have been shot (e.g., Dive! in USA, Just Eat It in Canada, Taste the waste in Germany, etc.).
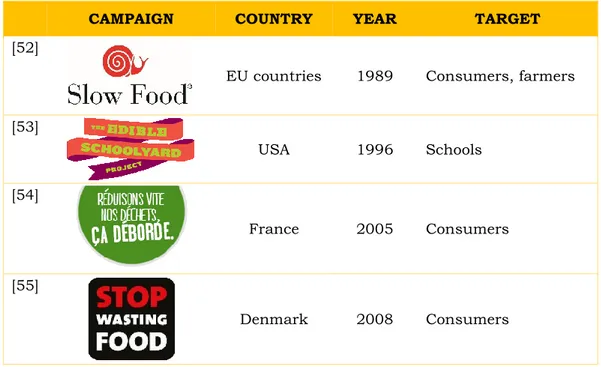
Table 4 summarized the most famous campaigns worldwide aimed to increase people awareness on food waste problem.
Table 4 – International food waste awareness campaigns
CAMPAIGN COUNTRY YEAR TARGET
[52]
EU countries 1989 Consumers, farmers
[53] USA 1996 Schools [54] France 2005 Consumers [55] Denmark 2008 Consumers
26
CAMPAIGN COUNTRY YEAR TARGET
[56]
United
Kingdom 2008 Consumers
[57]
Ireland 2009 Consumers, schools
[58] United Kingdom 2009 Schools [59] USA 2009 Consumers [60] Waste No Food
Hong Kong 2010 Schools
[61]
Australia 2010 Consumers [62]
USA 2012 Consumers
[63]
Global 2013 Consumers, retailers, hospitality
[64]
EU countries 2013 Institutions and FSC partners
[65]
Belgium 2014 Social innovators
[66]
27 Food redistribution initiatives
Quantities of edible food waste at the retailers’ level are very large. For this reason, several initiatives and projects have been launched in order to collect still edible and unsold food products, which would be destroyed or thrown away, and donate them to charities, homeless poor and other people in need (e.g., City Harvest, Feeding America, Banco Alimentare, Buon fine, etc.). The recovered products are donated from industry, restaurants, and food services as they do not respect the aesthetic standards or are close to their expiration. Sometimes, intact and unused foods are recovered from public events, catering services and concerts (e.g., Rock and Wrap It Up!). In other cases, associations recover and prepare food in community kitchens and then serve it in cafeterias, at charity dinners or during collective events (e.g., Dinner Exchange). Other initiatives are finalized to promote the food sharing between consumers (e.g., foodsharing.de, I food share). Other organizations (for-profit) collect unsellable food from retailers and resell it in secondary markets at discounted prices (e.g., Approved Food).
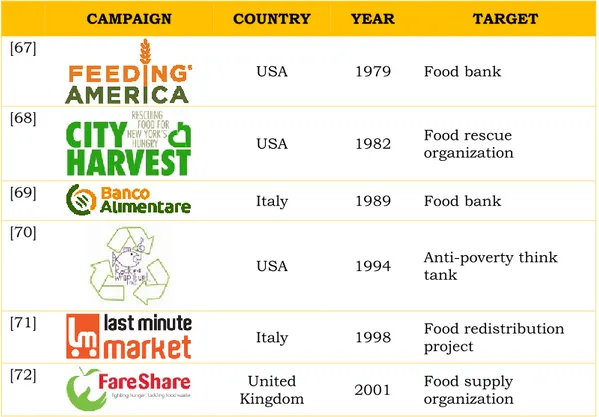
Table 5 summarized the most famous organizations or initiatives worldwide oriented to divert food from trash to charities.
Table 5 – International organizations and initiatives aimed to the food redistribution
CAMPAIGN COUNTRY YEAR TARGET
[67]
USA 1979 Food bank
[68]
USA 1982 Food rescue organization
[69] Italy 1989 Food bank
[70]
USA 1994 Anti-poverty think tank
[71]
Italy 1998 Food redistribution project
[72] United
Kingdom 2001
Food supply organization
28
CAMPAIGN COUNTRY YEAR TARGET
[73]
Italy 2003 Food redistribution project
[74]
United
Kingdom 2009 Charity
[75]
United
Kingdom 2009 Online retailer [76] United Kingdom (Germany) 2009 (2011) Social enterprise [77]
Germany 2013 Food-sharing online platforms
[78] Italy 2013 Food-sharing online
platforms
Regulatory measures and governments’ programmes and policies
Regulatory measures and initiatives promoted by local governments should be the starting point to reduce, reuse, and recycle food. However, they are not enough widespread. The most important are:
Commission Regulation (EC) No 1221/2008 of 5 December 2008 that reduces the aesthetic requirements for many fruits and vegetables; “Good samaritan food donation act” and the Italian Good Samaritan Law
(No 155/2003) created to encourage food donation to non-profit organizations by minimizing liability;
The French law that bans supermarkets from destroying unsold food and obliges them to give it to charity;
The Waste Prevention Programme for England that set out the roles and actions for government and others to reduce the amount of waste produced in England;
![Figure 1 – Per capita food losses and waste, at consumption and pre-consumptions stages, in different regions [13]](https://thumb-eu.123doks.com/thumbv2/123dokorg/2969780.27197/21.892.167.772.571.850/figure-capita-losses-consumption-consumptions-stages-different-regions.webp)
![Figure 2 – Food wastage, at world level, by phase and by region of the food supply chain [9]](https://thumb-eu.123doks.com/thumbv2/123dokorg/2969780.27197/22.892.172.762.302.471/figure-food-wastage-world-level-phase-region-supply.webp)
![Figure 3 – Contribution of each phase of the food supply chain to food wastage and carbon footprint [9]](https://thumb-eu.123doks.com/thumbv2/123dokorg/2969780.27197/24.892.169.766.351.657/figure-contribution-phase-supply-chain-wastage-carbon-footprint.webp)