OLIVE OIL ADULTERATION SENSING
BY FTIR AND RAMAN SPECTROSCOPY
G. GIUBILEO, A. PUIU, S. BOTTI
ENEA – Unità Sviluppo di Applicazioni delle Radiazioni Centro Ricerche Frascati, Roma
G. TARQUINI, S. NUNZIANTE CESARO Dipartimento di Chimica, Università di Roma "Sapienza"
Piazzale Aldo Moro 5, Roma
AGENZIA NAZIONALE PER LE NUOVE TECNOLOGIE, LʼENERGIA E LO SVILUPPO ECONOMICO SOSTENIBILE
OLIVE OIL ADULTERATION SENSING
BY FTIR AND RAMAN SPECTROSCOPY
G. GIUBILEO, A. PUIU, S. BOTTI
ENEA – Unità Sviluppo di Applicazioni delle Radiazioni Centro Ricerche Frascati, Roma
G. TARQUINI, S. NUNZIANTE CESARO Dipartimento di Chimica, Università di Roma "Sapienza"
Piazzale Aldo Moro 5, Roma
I contenuti tecnico-scientifici dei rapporti tecnici dell'ENEA rispecchiano l'opinione degli autori e non necessariamente quella dell'Agenzia.
The technical and scientific contents of these reports express the opinion of the authors but not necessarily the opinion of ENEA.
I Rapporti tecnici sono scaricabili in formato pdf dal sito web ENEA alla pagina http://www.enea.it/it/produzione-scientifica/rapporti-tecnici
OLIVE OIL ADULTERATION SENSING BY FTIR AND RAMAN SPECTROSCOPY
G. GIUBILEO, A. PUIU, S. BOTTI, G. TARQUINI, S. NUNZIANTE CESARO
Sommario
L'adulterazione di olio extra vergine di oliva con oli meno costosi è un grave problema nel mercato dell'olio d'oliva. Nel presente lavoro, esperimenti di determinazione del contenuto di oli vegetali a basso costo in olio extra vergine di oliva (EVOO) sono stati eseguiti con tecniche di spettroscopia FTIR e spettroscopia Raman. A tal fine, un insieme di campioni di oli puri e di miscele di oli extra vergine e oli vegetali diversi è stato utilizzato come materiale sperimentale nello studio riportato. E' stato inoltre studiato con spettroscopia FTIR il processo di invecchiamento dell'olio EVO. Gli spettri di riferimento sono stati raccolti nei laboratori ENEA e CNR. E' stato effettuato un trattamento dei risultati spettroscopici per permettere un confronto agevole e veloce dei campioni. La classificazione delle differenti miscele è stata basata sul rapporto di intensità tra bande selezionate.
Parole chiave: analisi di alimenti; olio d'oliva; adulterazione; invecchiamento; Raman; IR
Abstract
The adulteration of extra virgin olive oil with cheaper oils is a major problem in the olive oil market. In the present work, experimental determinations of low cost vegetable oils content in extra virgin olive oils (EVOO) were performed by Fourier Transform Infrared (FTIR) spectrometry and Raman spectrometry. To this purpose, a set of pure oils and mixtures of extra-virgin oils and different vegetable oils was arranged and used as experimental material in the reported study. Moreover the EVOO ageing process was studied by FTIR spectrometry. The reference spectra were collected in the ENEA Research Laboratories as well as CNR Laboratories. A data treatment of the spectral results was performed to allow an easy and fast comparison of the samples. The classification of the different mixtures was based on the intensity ratio between selected bands.
5
INDICE
1. Introduction ... 7
2. Materials and Methods ... 9
3. FTIR results ... 12
4. RAMAN results ... 17
Conclusions ... 20
Acknowledgements... 20
7
1. Introduction
The extra virgin olive oil (EVOO) shows high level nutritional properties as well as a very special good taste and it is obtained through a process called “cold press”, which is different from those used for the production of other edible oils. Consequently, the EVOO is the most valuable one in the world market and its high commercial value has prompted some vendors to adulterate the olive oil with lower price oils obtained from different plants. The authentication of olive oil and the detection of its eventual adulteration with lower priced oils is a serious problem in the oil market, also for its health implications.
Many efficient analytical methods have been developed for identifying adulterated olive oils; such as mass spectrometry, gas chromatography, chemical analysis, nuclear magnetic resonance [1-4]. While such consolidated techniques are powerful tools, they are not practical options for the food industry since they require time consuming processes which must be performed in dedicated laboratories by highly-skilled personnel and are inconvenient for online process control. There is an increasing demand for the development of rapid and sensitive methods to be applicable “on the field”, that means to be portable, easy to use, non destructive and accurate. The InfraRed (IR) and Raman spectroscopy possess these properties: they do not require chemical reagent, are easy to use, after the initial method development, and do not destroy the sample, therefore these methods could be successfully adopted as screening tools in the EVOO industry. In any case, it has to be underlined that while an optical technique is suitable to give a fast alert about the adulteration of a product, the official confirmation of a fraud needs to be certified by the chemical analysis.
In this work, the IR and Raman spectroscopy were applied to quantify the adulteration induced in the EVOO following the addition of sunflower oil (SFO). Moreover, IR Spectroscopy was applied to EVOO aging assessment. Both techniques are based on vibrational transitions occurring in the ground state of a molecule when it is excited from the electromagnetic wave of a laser. However, there are important differences between them: IR transitions require a change in the intrinsic dipole moment of molecule during the vibration, whereas the Raman scattering is due to the changes of molecule polarization. Therefore, IR and Raman spectroscopy give complementary information on the molecular structure. As an example, in the case of lipid molecules of vegetable oils, the IR spectroscopy is more sensitive to the polar bonds, whereas the Raman spectroscopy to the non polar bonds [5-11].
8
As adulterant, we choose the sunflower oil due to its higher chemical similarity with olive oil in comparison with other vegetable oils [4, 12]. Samples of different commercial EVOO were diluted with different amounts of sunflower oil, and the spectroscopy analysis were performed on each of them. Analysis of the spectra were performed to extract numerical data, suitable to quantify the adulteration. The results were taken as basis in constructing the calibration curves discussed in the following.
In order to investigate the oxidation and degradation process of pure olive oil, a few EVOO samples were artificially weathered and the changes of the spectroscopic behavior were carefully examined.
9
2. Materials and Methods
1. FTIR spectrometry. A commercial Alpha FT-IR Spectrometer (Bruker Optics, Ettingen,
Germany) (Figure 1) was used to collect the FTIR spectra with a resolution of 4 cm-1 in a single scan. To study the contamination of EVOO by SFO, a small amount (2 µL) of the sample was deposited on one side of a NaCl window and then covered with the second NaCl window; the coupled NaCl windows constitute the absorbing cell. Each IR spectrum was realized by collecting data in the 4000-600 cm-1 spectral range. NaCl window was cleaned with chloroform in between two sample runs. The background spectrum was collected at the beginning of each experimental session in which the selected samples were analyzed in sequence. To study the olive oil ageing process, the samples were uniformly spread on CsI window and studied in absorbance.
10
2. Weatherometer. To perform the oil ageing study, olive oil specimens were artificially aged using
a weatherometer QUV Accelerated Weathering Tester (Q-Lab, Cleveland, OH, USA). This apparatus was employed in order to induce in a shorter time alteration processes similar to the real ones. Particularly, the weatherometer uses ultraviolet light, specifically in the radiating spectrum of UVB, also making it possible controlling other parameters such as humidity and temperature [13]. The operating conditions of the weatherometer are listed in the following:
• temperature: 45 ° C; • relative humidity: 58%; • irradiance: 0.67% W/m2
/mm; • wavelength: 310 nm.
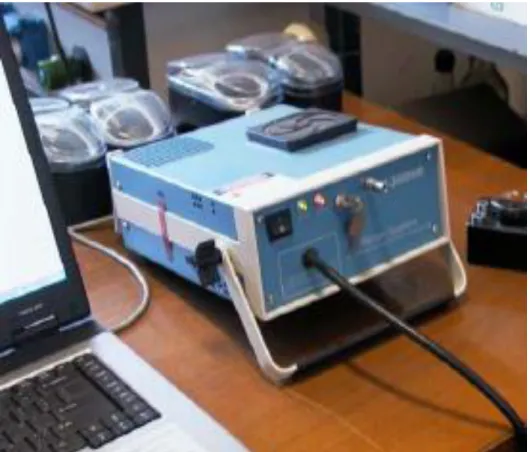
3. Raman spectrometry. The Raman spectra were acquired with an integrated Raman system (Ocean
Optics HR-3000, shown in Figure 2) with a 500 mW solid state laser operating at 785 nm as excitation light source. Raman spectra were acquired by placing the glass vial containing the oil mixture in the prefixed sample holder such that the laser was focused inside. The spectra were collected with a CCD system in the wavelength range 797-996 nm corresponding to Raman shifts of 200-2700 cm-1. The scan resolution was better than 4 cm-1. Teflon was used to calibrate the
Raman system in wavenumber position. The data acquisition time was set at 50 s, to achieve optimal Raman peak intensity. Each sample was analysed in quadruplicate.
4. Samples. The olive and sunflower oils were purchased from a local supermarket. Artificially
adulterated blends of EVOO were prepared for the spectroscopic analysis by adding known amounts of adulterating oil (sunflower) to 10 mL of EVOO and mixing accurately. The SFO was transferred through a 1mLx0.01 pipette in 0.1mL steps. The amount of sunflower oil ranged from 0.1 to 3 mL. All the prepared samples were classified by evaluating their FTIR and Raman spectra.
11
12
3. FTIR results
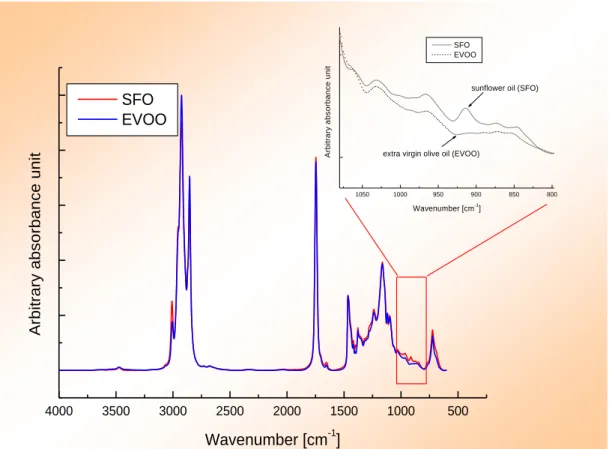
The FTIR spectra obtained for the extra virgin olive oil EVOO and for the sunflower oil SFO are shown in Figure 3. All of them are characterized by the same well evident peaks at 2800-3100 cm-1, at 1700-1800 cm-1 and at 900-1400 cm-1. The spectral structure of the edible oils is mainly due to lipid molecules containing fatty acids. This determines the presence of characteristic absorption bands in the mid infrared region of electromagnetic spectrum. The specific frequency of a given vibration mode depends on the specific arrangement of the carbonyl groups and of the lipid hydrocarbon backbone, while the intensity of the specific vibration mode depends on the relative concentration of the related functional group. Because the fatty acids composition of a given edible oil is closely related to the vegetable variety from which the oil is obtained, this allows the spectral characterization of the oil’s vegetable variety [14].
4000 3500 3000 2500 2000 1500 1000 500
1050 1000 950 900 850 800 extra virgin olive oil (EVOO)
sunflower oil (SFO)
A rb it ra ry a b s o rb a n c e u n it Wavenumber [cm-1 ] SFO EVOO Ar b itr a ry a b so rb a n ce u n it Wavenumber [cm-1] SFO EVOO
13
The similarity of the spectra reflects the similarity in the chemical composition of the oils. Nevertheless, minor differences appear at a more detailed analysis in term of small band shifts and of small changes in the relative intensity. At a closer inspection of the infrared spectra, some differences between oils located around 900, 1100 and 1400 cm-1 become clear, as put in evidence in the Figure 4 and in the magnification shown in the Figure 3.
1500 1400 1300 1200 1100 1000 900 800 931 914 1099 1119 1408 1398 Ar b itr a ry a b s o rb a n c e u n it Wavenumber /cm-1 SFO EVOO
Figure 4. FTIR spectra of EVOO and SFO in the 1500-800 cm-1 range.
From the literature [14-16] it can be evinced that: the band at 1400 cm-1 is due to the bending vibration of the =C-H group; the bands occurring in the region between 1300 and 1000 cm
-1
are due to stretching vibrations of the C-O bonds present in triglycerides molecule; the band at 914 cm-1 are related to the bending vibration of -HC=CH- groups. In the Table 1 a summary of the infrared band assignment was reported for the considered edible oils.
14
Table 1. Infrared band assignment.
Wavenumber (cm-1) functional group assignment
1400 =C-H C-H
bending
1100 -C-O C-O
stretching
914 -HC=CH- HC=CH
bending out of plane
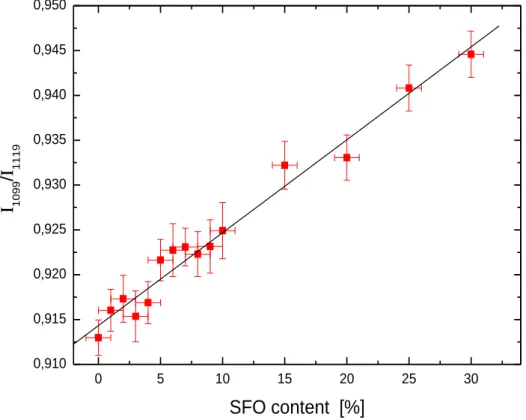
To classify the oil IR spectra and to quantify the discrepancy among the EVOO and SFO spectra, the method of intensity ratio was adopted. This avoid the occurrence of mistakes depending on the use of absolute values. Each spectrum was evaluated on the base of the following ratios between signal values: I1099/I1119 and I914/I931. A set of blends containing EVOO and SFO were
analyzed by FTIR spectroscopy, and an example of the results was given in the Figure 5 where the ratios of I1099 to I1119 and of I914 to I931 were graphed for a given EVOO versus the adulterant
sunflower content in the oil blend. The spectral parameter I1099/I1119 resulted to be linearly
correlated to the percentage content of adulterant oil in all the examined binary blends. The same happened for the I914/I931 ratio.
0 5 10 15 20 25 30 0,910 0,915 0,920 0,925 0,930 0,935 0,940 0,945 0,950 I 1099 /I 1119 SFO content [%]
15
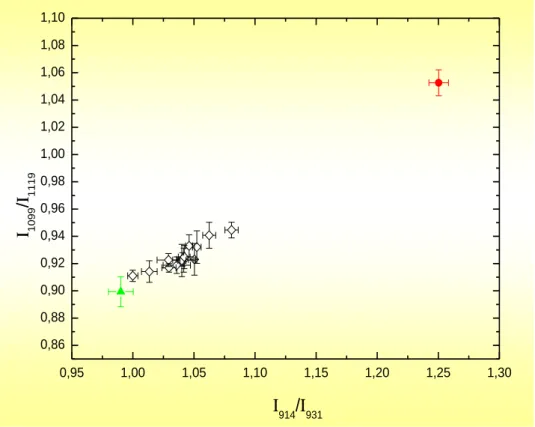
The obtained results were applied in realizing a distribution chart in which each dot corresponds to a couple of the spectral parameters. In the distribution chart shown in the in the Figure 6 the value of the I1099/I1119 ratio was reported on the y-axis, while the value of the I914/I931
ratio was reported on the x-axis. Each oil blend is represented by a dot. Each dot represents the average of 3 samples. 0,95 1,00 1,05 1,10 1,15 1,20 1,25 1,30 0,86 0,88 0,90 0,92 0,94 0,96 0,98 1,00 1,02 1,04 1,06 1,08 1,10 I 914/I931 I 1099 / I 1119
Figure 6. FTIR distribution chart of EVOO (green solid triangle), SFO (red solid circle) and
EVOO blended with SFO in different volume percentages: 1%, 2%, 3%, 4%, 5%, 6%, 7%, 8%, 9%, 10%, 15%, 20%, 25%, 30% (open diamond) .
From these data it is well evident that the adopted spectral parameters are dependent on the sunflower oil content in the oil blend. The pure EVOO and the pure SFO are located in well separated regions of the distribution chart, while the binary mixtures of the two oils occupy intermediate positions depending on the percentage content of the adulterant oil in the EVOO. Samples with smaller SFO content are represented by dots located nearby the pure EVOO location. The distance from the pure EVOO increase with the SFO content. In particular the EVOO is identified by x coordinate lower than 1.01; SFO is identified by x coordinate higher than 1.24; finally the oil blends with 2-30% SFO show x coordinates falling in the 1.02-1.09 interval, the value
16
increasing with the SFO percentage content. This allows the discrimination between EVOO and SFO, and to give an estimation of the EVOO adulteration with SFO.
Additional experiments were made in order to study the ageing effect on olive oil. In the Figure 7 the transmission spectrum of olive oil in the spectral range 4000 – 375 cm-1 is reported and compared with the one of specimens subjected to artificial and accelerated weathering for 60 days. As the vibrational behavior of the untreated oil sample shows an excellent agreement with data previously reported by María D. Guillén and Nerea Cabo, in the following we will refer to the assignment reported in their paper [17]. Few spectral changes are observed after weathering due to the induced degradation process. The most intense absorption band at 1746 cm-1, assigned to ester Carbon-oxygen bond, presents a slight broadening towards lower wavenumber side attributed to the increase of free fatty acids. A broadening of bands assigned to C-H stretching is also observed. A broad weak band observed around 3500 cm-1 indicates the formation of hydroperoxides [18].
Figure 7. FTIR absorbance spectra of olive oil
17
4. RAMAN results
The main feature of unsaturated fatty acids is their content of double bonds, to this respect Raman scattering is of great value because non polar groups as C=C give intense Raman scattered bands. Although the near-IR excitation eliminates most of sources of sample fluorescence, in the Raman signal of each oil sample the contribution of fluorescence is still present. The fluorescence signal was approximated with a polynomial which was subtracted to the raw data resulting in a flat baseline spectrum. All the spectra were normalised to the highest peak which for olive and vegetable oils is at 1440 cm-1.
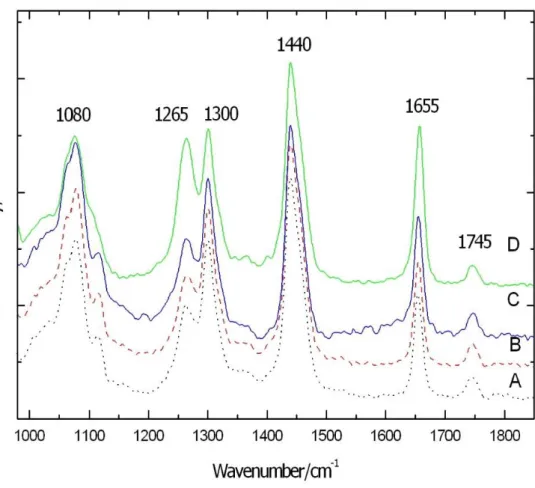
Figure 8 shows the normalised Raman spectra of olive and sunflower oil. Each spectrum is the average of four scans, data smoothing was not necessary.
18
The observed bands and their corresponding vibration modes, in according to literature data [4], are mainly due to vibrations of chemical bonds of triglycerides: 1080 cm-1 ( C-C stretching in the –(CH2)n– group), 1265 cm-1 (=C-H bending in cis RHC=CHR group), 1300 cm-1 (C-H twisting
in –CH2 group), 1440 cm-1 (C-H scissoring in –CH2 group), 1655 cm-1 (C=C stretching in cis
RHC=CHR group) and 1745 cm-1 (C=O stretching in RC=OOR group). At a first look, the Raman spectra are similar, this finding reflects the chemical similarity of sunflower to olive oil. For this reason, as already discussed, we selected sunflower oil as adulterant of olive oil. However, the Raman bands at 1265 cm-1 and 1655 cm-1 due to cis =C-H and cis -C=C vibrations, respectively, have weaker intensities in olive oils to respect to sunflower oils.
Olive oil mainly consists of monounsaturated oleic acid (i.e. with only one C=C double bond), whereas the other vegetable oils show a high content of linoleic acid, which has the same chain length of oleic acid, but contains one more C=C double bond. Consequently, the Raman intensity of the vibration at 1265 cm-1 and 1655 cm-1, which are correlated with the double carbon bonds, increase as the degree of unsaturation (i.e. the number of C=C bonds) decreases. This finding can be used for the discrimination between olive and the other edible oils. For each blend we performed four Raman scans and for each scan we calculate the ratio of I1265 to I1300 and ofI1655
to I1440. In Figure 9, the averages of the different measurements are reported as a function of
sunflower content in the blend. As expected, the I1265/ I1300 and the I1655/ I1440 ratios increase
linearly as the sunflower oil content increases.
Figure 9. I1655/I1440 and I1265/I1300 ratios of Raman signals
19
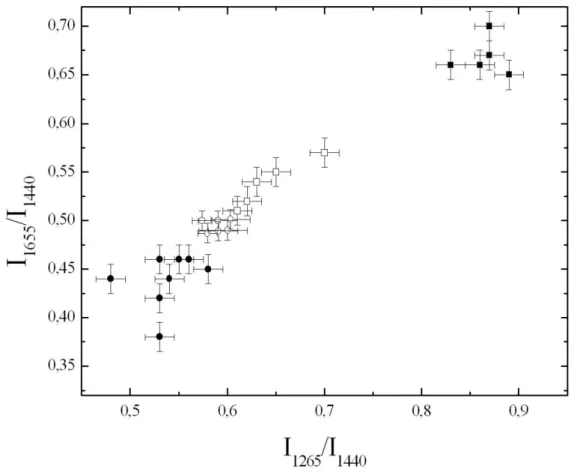
The distribution chart of olive and sunflower oil is shown in Figure 10. As horizontal coordinate was used the ratio I1265/I1300, and as vertical coordinate the ratio I1655/I1440, in this way,
each Raman measurement is represented by a dot with a unique x, y coordinate.
All olive oil samples are represented by dots with vertical coordinate below 0.46 ± 0.02, most of them locate at the left side of chart and are well separated by the sunflower oil dots which have vertical coordinates higher than 0.65 ± 0.02 and are located at the right side of the chart. Therefore, the olive oil can be easily distinguished from sunflower oil by the different distribution region in this chart. The olive oil sample mixed with sunflower oil are represented by dots with horizontal and vertical coordinates which increase with the content of unsaturated fatty acid in the mixture, moving toward the top of the right side of the chart. Samples with sunflower content smaller than 4% are represented by dots near the edge of olive oil region, however they can be distinguished from olive oil dots, also considering the error bars.
Figure 10. Raman Distribution chart of EVOO (solid circle), SFO (solid rectangle) and EVOO
blended with SFO in different volume percentages: 1%, 2%, 4%, 5%, 5%, 7%, 9% (open circle), 10%, 15%, 20%, 25%, 30%, 40%, 50% (open diamond) .
20
Conclusions
Infrared absorption spectra and Raman spectra of extra-virgin olive oil, sunflower oil and their binary mixtures were obtained with a commercial FTIR spectrometer and a portable Raman spectrometer. Spectra with high S/N ratio were obtained with acquisition time smaller than one minute. By distribution charts based on the intensity ratio of principal Raman vibration bands or of spectral IR signals at significant wavelengths, olive oil samples blended with sunflower oil can be distinguished from pure oil samples.
Blends of olive oil and sunflower oil were easily distinguished by their position on the distribution charts parameterized by intensity ratio of spectral signal at significant wavelengths in both spectroscopic techniques: FT-IR and Raman. The classification of oils by the distribution chart based on the method of intensity ratio adopted in the present paper offers a convenient way for a fast identification of suspect oil product in real time, suitable for supporting the on-line quality control and real time characterization of the extra virgin olive oil adulteration. The combination of two optical techniques with data treatment is promising for an improved diagnostics of EVO oil adulteration. The future next step will be the development of an integrated apparatus based on both the techniques to increase the specificity of the alerting system.
Moreover the cis/trans isomerization of unsaturated fatty acids occurring in the oil during the oxidation process has been successfully monitored by FTIR spectroscopy, in order to distinguish among aged oil and fresh oil.
Acknowledgements
The financial support of Italian Ministry for Economy Development in the frame of the National Project MI01_00182_SAL@CQO is gratefully acknowledged.
21
References
[1]. I.M. Lorenzo, J.L.P. Pavon, M.E.F. Laespada, C.G. Pinto and B.M. Cordero, J. Chromatogr. A 945, 221 (2002)
[2]. R. Aparicio and R. Aparicio-Ruiz, J. Chromatogr. A 881, 93 (2000)
[3]. N. Ogrinc, I.J. Kosir, J.E. Spangenberg, J. Kidric, Anal Bioanal Chem 376, 424 (2003) [4]. J.L. Harwood and R. Aparicio, Handbook of olive oil: analysis and properties (Aspen
publishers, USA, 2000) and references therein
[5]. A. Tay, R.K. Singh, S.S. Krishnan and J.P. Gore, Lebensm.-Wiss. u.-Technol. 35, 99 (2002)
[6]. N. Dupuy, L. Duponchel, J.P. Huvenne, B. Sombret, P. Legrand 57, 245 (1995) [7]. Y.W. Lai, E.K. Kemsley and R.H. Wilson, J. Agric. Food Chem. 42, 1154 (1994) [8]. M.Q. Zou, X.F. Zhang, X.H. Qi, H.L. Ma, Y. Dong, C.W. Liu, X. Guo, and H. Wang, J.
Agric. Food Chem. 57, 6001 (2009)
[9]. V. Baeten and R. Aparicio, Biotechnol. Agron. Soc. Environ. 4, 196 (2000)
[10]. E. C. Lopez-Diez, G. Bianchi and R. Goodacre, J. Agric. Food. Chem. 51, 6145 (2003) [11]. R. M. El-Abassy, P. Donfack and A. Materny, J.Am. Oil. Chem. Soc. 86, 507 (2009) [12]. R. M. El-Abassy, P. Donfack and A. Materny, J. Raman. Spectrosc. 40, 1284 (2008) [13]. F. Marini, M. Tomassetti, S. Vecchio, Chemistry Central Journal 6 (2), S7 (2012)
[14]. N. Vlachos, Y. Skopelitis, M. Psaroudaki, V. Konstantinidou, A. Chatzilazarou, E. Tegou, Anal. Chim. Acta 573, 459 (2006)
[15]. M.J. Lerma-Garcia, G. Ramis-Ramos, J.M. Herrero-Martinez, E.F. Simo-Alfonso, Food Chemistry 118, 78 (2010)
[16]. M.D. Guillen and N. Cabo, J. Sci. Food Agric. 45, 1 (1997) [17]. M.D. Guillen and N. Cabo, J. Sci. Food Agric. 47, 709-712 (1999) [18]. M.D. Guillen and N. Cabo, J. Sci. Food Agric. 80, 2028-2036 (2000)
Edito dall’
Servizio Comunicazione
Lungotevere Thaon di Revel, 76 - 00196 Roma www.enea.it
Stampa: Tecnografico ENEA - CR Frascati Pervenuto il 31.3.2015