S
UMMARYThe present report is a contribution to the “Numerical analysis of operational scenarios and incidental” activity. It consists in developing, applying and validating an approach and numerical models for the safety analysis of liquid metal Gen. IV reactors.
The activity benefits of the International Coordinated Research Project (CRP) on EBR-II Shutdown Heat Removal tests promoted by IAEA. It is multi-physics and multi-scale and it will require the synergistic effort of different technical skills. The work is based on the availability of experimental tests carried out in EBR-II reactor. These tests are: protected 17) ed unprotected (SHRT-45r) loss of flow.
The documents presents the EBR-II and describes the SHRT-17 and the experimental data available. Then, the 3D thermal-hydraulic model of EBR-II by RELAP5-3D© system code is presented, together with the nodalization qualification carried out by means of the post-test analysis.
Considering the highly detailed measurements of temperatures in the SA XX09, a CFD model with ANSYS CFX code was set up and employed for complex 3D simulations of the temperature filed and coolant flow paths. Steady state simulations (at starting of transient) and transient simulation of SHRT17 were also performed starting from the boundary conditions provided by the system code results.
Finally, a methodology was also set-up to carry out neutronic core analysis based on 3D codes. Starting from the SHRT-45r test specifications, including the fuel composition data, an MCNP6 model of the overall core was developed. Every single pin was modeled, including the stainless steel of the reflector, according with the original geometry. The keff value was calculated as well as the power distribution, which can be used as reference for the 3D nodal model at reduced number of energy groups. Homogenized cross sections were calculated for 33 groups by means of SCALE code. Different 2D models were generated for the fuels, the CR and the reflector. These were used to derive a cross section library for all core, excluding the blanket zone. Then, this library was implemented in the core 3D neutron kinetic code model, PHISICS, which will be used for the coupled calculation of the unprotected transient.
L
IST OF CONTENTSS
UMMARY... 3
L
IST OF FIGURES... 7
L
IST OF TABLES... 11
L
IST OF ABBREVIATIONS... 13
INTRODUCTORY
REMARKS ... 15
1
Framework... 15 1.1 Objective of the activity ... 151.2
EBR-II
ANDSHRT-17 ... 17
2
Introduction ... 172.1 EBR-II plant overview ... 17
2.2 DESCRIPTION OF THE SHRT-17 EXPERIMENT ... 23
2.3 Objectives of SHRT-17 ... 23
2.3.1 Configuration of the facility, boundary and initial conditions of SHRT-17 ... 23
2.3.2 Description of SHRT-17 ... 23 2.3.3
RELAP5-3D
© NODALIZATION... 33
3
RELAP5-3D©v4.0.3 code... 33 3.1 EBR-II nodalization ... 33 3.2 Nodalization features ... 33 3.3 Modeling changes for open calculation ... 343.4
Q
UALIFICATION OFEBR-II
NODALIZATION AGAINSTSHRT-17
TEST... 39
4
CFD
SIMULATIONS OFLM
COOLED WIRE-
SPACEDF
UELA
SSEMBLYXX-09 .... 59
5
CFD: Model and methods ... 595.1 CFD model of XX09 fuel assembly ... 59
5.1.1 Description of the model ... 59
5.1.2 Steady state simulation. ... 62
5.2 Boundary Conditions ... 62 5.2.1 Results ... 62 5.2.2 Transient simulation. ... 65 5.3 Boundary Conditions and computation details ... 65
5.3.1 Results ... 65
5.3.2 Conclusive remarks ... 68 5.3.3
MCNP
N
EUTRONICM
ODELLING... 69
6
Model Description ... 69 6.1 Materials modelling ... 74 6.2 Calculation parameters ... 74 6.3 Criticality calculations ... 74 6.4PHISICS
N
EUTRONICM
ODELLING... 76
7
Neutronic codes description ... 76 7.1
EBR II broad-group nodal XSec library generation ... 76 7.2
PHISCS model description ... 80 7.3
PHISICS model preliminary results ... 80 7.4
Conclusive remarks and follow up ... 83 7.5
C
ONCLUSIVE REMARKS AND FOLLOW UP... 85
8
L
IST OF FIGURESFig. 1 – Chain of codes proposed for supporting for supporting the design and the safety
analysis of Gen. IV liquid metal fast reactors. ... 16
Fig. 2 – EBR-II Primary Tank Sodium Flow Paths. ... 20
Fig. 3 – EBR-II Core Layout. ... 20
Fig. 4 – EBR-II Primary Tank Layout. ... 21
Fig. 5 – EBR-II Primary Tank Vessel. ... 21
Fig. 6 – EBR-II High - and Low - Pressure Inlet Plena. ... 22
Fig. 7 – EBR-II Intermediate Heat Exchanger. ... 22
Fig. 8 – EBR-II, SHRT-17: Primary Pump Speeds. ... 29
Fig. 9 – EBR-II, SHRT-17: Normalized Fission Power. ... 29
Fig. 10 – EBR-II, SHRT-17: Total, Fission and Decay Heat Power. ... 30
Fig. 11 – EBR-II, SHRT-17: IHX Intermediate Side Inlet Sodium Mass Flow Rate. ... 30
Fig. 12 – EBR-II, SHRT-17: IHX Intermediate Inlet Sodium Temperature. ... 31
Fig. 13 – EBR-II SHRT-17, RELAP5-3D©: schematization of 3D components. ... 35
Fig. 14 – EBR-II SHRT-17, RELAP5-3D©: plant scheme. ... 35
Fig. 15 – EBR-II SHRT-17, RELAP5-3D©: scheme of pumps, high and low pressure flow lines. .... 36
Fig. 16 – EBR-II SHRT-17, RELAP5-3D©: scheme of Z-PIPE, IHX primary and secondary side. ... 36
Fig. 17 – EBR-II SHRT-17, RELAP5-3D©: MARK-II AI fuel assembly ... 37
Fig. 18 – EBR-II SHRT-17, RELAP5-3D©: plane view of reactor core subdivision. ... 37
Fig. 19 – EBR-II SHRT-17, RELAP5-3D©: envelop of fuel centerline temperatures, PCT, and coolant temperatures in the core . ... 43
Fig. 20 – EBR-II SHRT-17, RELAP5-3D©: averaged coolant outlet temperature and Z-pipe inlet coolant temperature . ... 43
Fig. 21 – EBR-II SHRT-17, RELAP5-3D©: FA XX09 coolant temperature at flowmeter (0.25 and 0.4m below BAF). ... 44
Fig. 22 – EBR-II SHRT-17, RELAP5-3D©: FA XX09 cladding temperatures at middle of active core. ... 44
Fig. 23 – EBR-II SHRT-17, RELAP5-3D©: FA XX09 cladding temperatures at top of active core. ... 45
Fig. 24 – EBR-II SHRT-17, RELAP5-3D©: FA XX09 cladding temperatures at top of wire wrapped fuel bundle. ... 45
Fig. 25 – EBR-II SHRT-17, RELAP5-3D©: FA XX09 coolant temperatures at outlet. ... 46
Fig. 26 – EBR-II SHRT-17, RELAP5-3D©: FA XX09 coolant temperatures at outlet of thimble channel. ... 46
Fig. 27 – EBR-II SHRT-17, RELAP5-3D©: FA XX10 coolant temperature at flowmeter (0.25
and 0.4m below BAF). ... 47
Fig. 28 – EBR-II SHRT-17, RELAP5-3D©: FA XX10 cladding temperatures at middle of active core. ... 47
Fig. 29 – EBR-II SHRT-17, RELAP5-3D©: FA XX10 cladding temperatures at top of active core. ... 48
Fig. 30 – EBR-II SHRT-17, RELAP5-3D©: FA XX10 cladding temperatures at top of wire wrapped fuel bundle. ... 48
Fig. 31 – EBR-II SHRT-17, RELAP5-3D©: FA XX10 coolant temperatures at outlet. ... 49
Fig. 32 – EBR-II SHRT-17, RELAP5-3D©: FA XX10 coolant temperatures at outlet of thimble channel. ... 49
Fig. 33 – EBR-II SHRT-17, RELAP5-3D©: selected SA, ring 1 and 2 coolant outlet T. ... 50
Fig. 34 – EBR-II SHRT-17, RELAP5-3D©: selected SA, ring 3 coolant outlet T. ... 50
Fig. 35 – EBR-II SHRT-17, RELAP5-3D©: selected SA, ring 4 coolant outlet T. ... 51
Fig. 36 – EBR-II SHRT-17, RELAP5-3D©: selected SA, ring 5 and 6 coolant outlet T. ... 51
Fig. 37 – EBR-II SHRT-17, RELAP5-3D©: selected SA, ring 7 coolant outlet T. ... 52
Fig. 38 – EBR-II SHRT-17, RELAP5-3D©: selected SA, ring 9, 12, 16 coolant outlet T. ... 52
Fig. 39 – EBR-II SHRT-17, RELAP5-3D©: upper plenum coolant temperatures. ... 53
Fig. 40 – EBR-II SHRT-17, RELAP5-3D©: IHX primary side coolant outlet tempeartures. ... 53
Fig. 41 – EBR-II SHRT-17, RELAP5-3D©: high and low pressure inlet lower plenum coolant temperatures. ... 54
Fig. 42 – EBR-II SHRT-17, RELAP5-3D©: primary pump mass flow rate (overall transient). ... 54
Fig. 43 – EBR-II SHRT-17, RELAP5-3D©: primary pump mass flow rate (zoom 1). ... 55
Fig. 44 – EBR-II SHRT-17, RELAP5-3D©: primary pump mass flow rate (zoom 2). ... 55
Fig. 45 – EBR-II SHRT-17, RELAP5-3D©: high and low pressure lines #2 mass flow rate. ... 56
Fig. 46 – EBR-II SHRT-17, RELAP5-3D©: primary pump mass flow rate (zoom 1). ... 56
Fig. 47 – EBR-II SHRT-17, RELAP5-3D©: FA XX09 mass flow rate. ... 57
Fig. 48 – EBR-II SHRT-17, RELAP5-3D©: FA XX09 mass flow rate (zoom1). ... 57
Fig. 49 – Layout of the CFD model. ... 60
Fig. 50 – Detailed view of the computational mesh. ... 61
Fig. 51 – Thermocouples position in XX09 Fuel Assembly. ... 63
Fig. 52 – Layout of the post-processing of the CFD steady-state simulation. ... 63
Fig. 53 – Comparison of the CFD results with SHRT-17 experimental values. ... 64
Fig. 54 – Comparison of CFD and experimental results for the mid-core plane MTC. ... 66
Fig. 56 – Comparison of CFD and experimental results for the top-core plane TTC (all the
thermocouples). ... 67
Fig. 57 – Comparison of CFD and experimental results for the out-of-core plane 14TC. ... 68
Fig. 58 – MCNP SFR Core Neutronic Modelling. ... 70
Fig. 59 – Core Neutronic Modelling. ... 70
Fig. 60 – MCNP6 S/A Modelling. ... 71
Fig. 61 – Core – Radial View (x-y plane). ... 72
Fig. 62 – Detail of core modelling – Driver / SS reflector interface. ... 72
Fig. 63 – Top Reflector Modelling – S/A Steel Plugs. ... 73
Fig. 64 – Bottom Reflector Modelling – S/A Steel Plugs. ... 73
Fig. 65 – Bottom Reflector Modelling for CR – S/A Steel Plugs. ... 74
Fig. 66 – EBR-II SHRT45 full Core subassemblies map. ... 77
Fig. 67 – SCALE Driver Fuel SA & half worth Driver SA neutronic SCALE models ... 78
Fig. 68 – SCALE MARK-IIS and CR non-active section models ... 78
Fig. 69 – SCALE Dummy SA model. ... 79
Fig. 70 – SCALE Top & Bottom (top part) and Radial Reflector (bottom part) models. ... 79
Fig. 71 – EBR- II PHISICS 3D neutronic model radial view. ... 80
Fig. 72 – PHISICS 3D model: first (fast) group flux. ... 81
Fig. 73 – PHISICS 3D model: last (therma)l group flux. ... 81
Fig. 74 – PHISICS 3D model: total flux. ... 82
L
IST OF TABLESTab. 1 – EBR-II, SHRT-17 Test Description. ... 25
Tab. 2 – EBR-II, SHRT-17 Initial Conditions. ... 25
Tab. 3 – EBR-II primary pump parameters. ... 25
Tab. 4 – EBR-II, SHRT-17: Primary Pump Speeds. ... 26
Tab. 5 – EBR-II, SHRT-17: Total, Fission and Decay Heat Power. ... 26
Tab. 6 – EBR-II, SHRT-17: Intermediate IHX Inlet Sodium Flow rate. ... 27
Tab. 7 – EBR-II, SHRT-17: Intermediate IHX Inlet Sodium Temperature. ... 27
Tab. 8 – EBR-II, SHRT-17: Facility configuration. ... 27
Tab. 9 – EBR-II, SHRT-17: imposed sequence of main events. ... 28
Tab. 10 – EBR-II, SHRT-17: resulting sequence of main events. ... 28
Tab. 11 – EBR-II nodalization:adopted code resources. ... 38
Tab. 12 – EBR-II SHRT-17, RELAP5-3D©: pump parameter. ... 38
Tab. 13 – EBR-II SHRT-17, RELAP5-3D©: steady-state comparison. ... 58
Tab. 14 – EBR-II SHRT-17, RELAP5-3D©: imposed and resulting sequence of main events. ... 58
Tab. 15 – The sodium properties implemented in the CFD simulation. ... 61
Tab. 16 – Main properties of AISI 304. ... 61
Tab. 17 – MCNP6 criticality calculations ... 75
Tab. 18 – ERANOS 33 energy group structure [55]... 77
L
IST OF ABBREVIATIONS3D Three Dimensional
ANL Argonne National Laboratory
ATC Annulus Thimble Thermocouple
BAF Bottom of Active Fuel
BOP Balance of Plant
CEA Commissariat à l’énergie atomique et aux énergies alternatives
CFD Computational Fluid Dynamics
CIAE China Institute of Atomic Energy
CRP Coordinated Research Project
DAS Data Acquisition System
EBR-II Experimental Breeder Reactor II
EC European Commission
EU European Union
FA Fuel Assembly
FR Fast Reactor
GEN IV Generation IV
GFR Gas-Cooled Fast Reactor
GIF Generation IV International Forum
GPM United Sates gallon per minute
HFD High-Flow Driver
HWCR High Worth Control Rod
IAEA International Atomic Energy Agency
IB Inner Blanket
IFR Integral Fast Reactor
IHX Intermediate Heat Exchanger
INCOT In-Core Instrument Test facility
INL Idaho National Laboratory
INSAT Instrumented Subassembly
IPPE Institute of Physics and Power Engineering
JAEA Japan Atomic Energy Agency
KAERI Korea Atomic Energy Research Institute
KINS Korean Institute for Nuclear Safety
LFR Lead-Cooled Fast Reactor
LWR Light Water Reactor
LMR Liquid Metal Reactor
MCP Main Coolant Pump
M-G Motor-Generator set
NK Neutron Kinetics
OB Outer Blanket
ORNL Oak Ridge national Laboratory
OTC Outlet-Coolant Thermocouple
PPS Plant Protection System
PS Primary Side
R&D Research and Development
SA Sub-Assembly
SCWR Supercritical Water Reactor
SDC Safety Design Criteria
SFR Sodium Fast Reactor
SHRT Shutdown Heat Removal Test
SS Secondary Side
SSC Structures, Systems and Components
TAF Top of Active Fuel
TH Thermal-Hydraulic
SYS System
TTC Top-of-core Thermocouple
ULOF Unprotected Loss-of-Flow
INTRODUCTORY
REMARKS1
Framework 1.1
The activity is developed and set-up in synergy of IAEA Coordinated Research Project (CRP) on
EBR-II Shutdown Heat Removal Tests (SHRT) [1].
The CRP aims at improving design and simulation capabilities in fast reactor neutronics, thermal hydraulics, plant dynamics and safety analyses through benchmark analyses of a protected and an unprotected loss-of flow test from the EBR-II SHRT program. Activities include core physics and thermal-hydraulics/safety assessments. Investigations of thermal hydraulics characteristics and plant behavior focus on predicting natural convection cooling accurately by evaluating the reactor core flow and temperatures in comparison to experimental data.
The activity has been established to support validation of simulation tools and models for the safety analysis of liquid metal fast reactors. Validated tools and models are needed both to evaluate liquid metal fast reactors passive safety phenomena and to assess reactor designs incorporating passive features into the system response to accident initiators.
Passive safety response in liquid metal fast reactors is the result of reactor design features that shut down the reactor, remove residual heat, and keep the core cooled during accidents. In addition to the Doppler effect, negative reactivity feedback mechanisms can be used to passively shut down the fission process. Negative reactivity feedback mechanisms are based on thermal expansion and contraction of structural materials, which affects neutron leakage in the fast spectrum core. Radial and axial core expansion, subassembly bowing, and control rod driveline expansion are examples of these passive reactivity feedbacks. Coolant density changes in sodium are utilized in the design to produce natural circulation flow, thus to keep the core cooled when forced circulation is lost. Passive heat removal is accomplished through use of natural convection, conduction and vessel wall radiation.
The potential for a liquid metal cooled fast reactor to survive severe accident initiators with no core damage has been extensively demonstrated during landmark shutdown heat removal tests in Experimental Breeder Reactor-II (EBR-II). Two of these tests, i.e. SHRT-17 and SHRT-45r, have been chosen because of the availability of extensive thermocouples and flow rate data at various elevations in two instrumented subassemblies, placed in row 5 of the core (one representing a fuel subassembly and the other a blanket subassembly), plus the range of conditions encountered in both tests. They simulated a loss of pumping power (normal and emergency) to the plant operating at full power and flow.
The objectives are to validate state-of-the-art computer software, to improve participants’ analytical and numerical capabilities in fast reactor design and analysis through comparison of numerical predictions with test data from the EBR-II SHRT-17 protected loss of flow and SHRT-45R unprotected loss of flow tests.
Objective of the activity 1.2
To compare best-estimate thermal-hydraulic system code calculations to experimental data,
thus to validate RELAP5-3D© system code in simulating sodium fast reactors designs.
To identify and, as far as possible, to quantify the RELAP5-3D© code limitations and the
source of uncertainties in simulating postulated accidents occurring in liquid metal FR designs.
To improve the understanding of the thermal-hydraulics processes and phenomena observed
in EBR-II tests.
To compare the performances of TH system codes in the domain of interest.
To develop reliable approaches for the application of TH-SYS codes in safety analysis of
new generation FR systems (i.e. LFR), including the coupling with CFD and NK.
The multi-physics approach proposed [2] is based on existing nuclear codes, interacting as depicted in Fig. 1: (ERANOS 2.1 [3]) and MCNP6 [4] codes for (static) deterministic and stochastic neutron transport calculations, SCALE [5] package for cross section generation; PHYSICS [6] neutron kinetic package for 3D core power distribution calculations in steady state and in transient, coupled
with RELAP5-3D©[7]; RELAP5-3D© for system analysis; computation fluid dynamic code ANSYS
CFX 13 [8] for 3D local simulations; and TRANSURANUS [9] code for fuel pin performance simulations (not employed in the benchmark activities).
Neutron physics codes will be applied for simulating the test SHRT-45r, which is an unprotected
transient, where the neutronic feedbacks have a crucial role. The RELAP5-3D© notalization,
qualified against the test, here discussed, is used for the thermal-hydraulic calculation of the transient. On the opposite, ANSYS CFX-13 is used to perform a detailed simulation of the experimental sub-assemblies XX09 and XX10 for the tests SHRT-17 and SHRT-45r. The three dimensional simulation provides a detailed description of flow paths and temperature distribution inside the fuel assembly and in the subassembly thimble.
Fig. 1 – Chain of codes proposed for supporting for supporting the design and the safety analysis of Gen. IV liquid metal fast reactors.
SCALE
Neutron XSec Database System TH
Neutronic Parameters
PHISICS
Deterministic 3D NKcore simulation
3D fluid dynamics
Fuel pin simulation
ENDF-B/VII Libraries
EBR-II
AND SHRT-172
Introduction 2.1
EBR-II [10] [11] [12][13] was operated initially to demonstrate the feasibility of a closed fuel cycle that required the addition only of uranium-238 to the fuel breeding process allowing for sustained operation. To achieve the intended fuel utilization, the initial EBR-II operating period was closely tied to research into pyrometallurgical reprocessing for irradiated nuclear fuel. This period lasted five years. Following the fuel cycle demonstration phase, the focus of EBR-II shifted for much of the next ten years towards irradiation experiments of advanced binary and ternary metal fuels and also advanced oxide fuels. From 1983 and 1994, EBR-II was used for experiments designed to demonstrate the importance of passive safety in liquid metal reactors (LMR).
The Shutdown Heat Removal Test (SHRT) program [11][12] was carried out in EBR-II between 1984 and 1986. The objectives of this program were to support U.S. LMR plant design, provide test data for validation of computer codes for design, licensing and operation of LMRs, and demonstrate passive reactor shutdown and decay heat removal in response to protected and unprotected transients. The protected and unprotected transients tested included loss of flow in the primary and/or intermediate sodium loops as well as a loss of heat sink from balance of plant. Additional tests were performed to examine the response of the system to balance of plant changes and others were performed to characterize reactivity feedbacks.
Passive safety response in sodium fast reactors is the result of reactor design futures that will shut down the reactor, remove residual heat, and keep the core cooled during accidents. In addition to Doppler effect, negative reactivity feedback mechanisms based on thermal expansion and contraction of structural materials, which affect neutron leakage in the fast spectrum core, can be used to passively shut down the fission process. Radial and axial core expansion, subassembly bending, and control rod driveline expansion are examples of these passive reactivity feedbacks. To keep the core cooled when forced circulation is lost, coolant density changes in sodium can be utilized in the design to produce natural circulation flow. Passive heat removal can be accomplished through use of natural convection, conduction and vessel wall radiation.
EBR-II plant overview 2.2
The EBR-II plant is a sodium cooled reactor located in Idaho, it was designed and operated by Argonne National Laboratory for the US Department of Energy [13]. Operation began in 1964 and
continued until 1994. EBR-II was rated for a thermal power of 62.5 MWt with an electric output of
approximately 20MWe [11][12]. Mass flow rates in three cooling loops were rated as [10][11]:
Primary sodium: 485 kg/s
Intermediate sodium: 315 kg/s
Secondary steam: 32 kg/s
All primary system components were submerged in the primary tank, which contained
approximately 340 m3 of liquid sodium at 371°C. An argon cover gas was maintained over the
sodium. Fig. 2 shows the primary tank and the other components The primary cooling system consisted of two mechanical centrifugal pumps operated in parallel and pumping a total of 485 kg/s of sodium. The two pumps drew sodium from this pool and provided sodium to the two inlet plena for the core. Subassemblies in the inner core and the extended core regions received sodium from the high-pressure inlet plenum, accounting for approximately 85% of the total primary flow. The blanket and the reflector subassemblies in the outer blanket region received sodium from the low-pressure inlet plenum.
Hot sodium left the subassemblies into a common upper plenum where it mixed before passing through the outlet pipe into the intermediate heat exchanger (IHX). The pipe feeding sodium to the IHX is referred to as “Z-pipe”. Sodium then exited the IHX back into the primary sodium tank before entering the primary sodium pumps again.
Sodium in the intermediate loop traveled from the IHX to the steam generator where its heat was transferred to the balance-of plant (BOP). The steam generator consisted of two parallel superheaters and seven parallel evaporators.
EBR-II was heavily instrumented to measure mass flow rates, temperatures and pressures throughout the system [10][11].
The EBR-II reactor core [1][11][33] vessel grid-plenum assembly accommodated 637 hexagonal subassemblies, which were installed in one of three regions: central core, inner blanket (IB) or outer blanket (OB). Each subassembly position was identified by a unique combination of three parameters: row, sector and position within the sector.
Fig. 3 illustrates the subassemblies arrangement of the reactor and the subassembly identification convention. Subassembly row identification begins at Row 1 for the subassembly in the core-center and moves outward to Row 16.
Two positions in Row 5 contained the in-core instrument subassemblies (INSAT) XX09 and XX10, and one position in Row 5 contained the in-core instrument test facility (INCOT) XY16. The remaining central core subassemblies were either driver-fuel or experimental-irradiation subassemblies of varying types. For SHRT-17 test only the MARK-II A I type driver subassembly was used.
The expanded core region was composed of Rows 6 and 7. This region is also named inner blanket region because originally housed blanket subassemblies. In SHRT-17 test, no blanket subassembly was loaded in this region. Instead, Row 6 contained the driver-fuel and irradiation subassemblies and Row 7 contained reflector subassemblies. The outer blanket region comprised the 545 subassemblies in Rows 8-16, which were either blanket or reflector subassemblies.
Each type of subassembly is discussed in Ref. [11], together with a detailed description of the geometry.
The EBR-II coolant systems model [10][11][12] for the SHRT-17 test included the major components in the primary sodium circuit and the intermediate side of the intermediate heat exchanger. Starting from the outlet of the reactor core, the primary sodium circuit included the upper plenum, reactor outlet piping, auxiliary EM sodium pumps, reactor inlet piping and high- and low-pressure inlet plena.
Fig. 4 illustrates the major components of the EBR-II primary sodium circuit. The two primary sodium pumps took suction from the primary sodium tank and provided sodium to the reactor inlet piping. Both sets of inlet piping provided sodium to the high-pressure and low-pressure inlet plena (Fig. 6). The high pressure inlet plenum provided sodium to the subassemblies in the first 7 rows; while the low-pressure inlet plenum provided sodium to Rows 8-16. Sodium discharged from the right side of the reactor vessel into the reactor outlet piping, known as the ‘Z-Pipe’. The shape of this pipe accommodated thermal expansion. The top of the Z-Pipe contained the auxiliary EM pump, which rated to provide up the 0.5% of the nominal pump head. Sodium exited the Z-Pipe and entered the shell side of the intermediate heat exchanger (Fig. 7). Cold sodium was finally discharged into the primary sodium tank. Fig. 4 shows the two primary sodium pumps and their inlet piping.
Simplified geometry was given for the major components of the primary sodium circuit in the benchmark model [11].
The primary tank (Fig. 5) was the outer boundary of the primary sodium circuit and was a vertically cylinder. It encompassed all of the major primary sodium components. The reactor vessel, intermediate exchanger and two primary sodium pumps were modeled as vertically oriented cylinders.
Fig. 2 – EBR-II Primary Tank Sodium Flow Paths.
Fig. 3 – EBR-II Core Layout.
LEGEND xSy x row in sector 1,...16 S sector A, B, C, D, E, F y position in row1,...13 Reflector 215 Uranium Blanket 330 High Flow Driver 18 Driver 32 Partial Diver 10 Control 8 Safety 2 Steel 6 Experimental 13 XX09 1 XX10 1 XY-16 1 Dummy 14 C 1 15 B 11 15 B 12 15 B 13 14 B 1 14 B 2 14 B 3 14 B 4 14 B 5 14 B 6 14 B 7 14 B 8 1 B 9 14 B 10 14 B 11 14 B 12 14 B 13 16 B 7 16 B 8 16 B 9 16 B 10 15 B 3 15 B 4 15 B 5 15 B 6 15 B 7 15 B 8 15 B 9 15 B 10 16 E 10 16 E 9 16 E 8 16 E 7 14 E 5 14 E 4 14 E 3 14 E 2 14 E 1 15 E 4 15 E 3 15 E 13 15 E 12 15 E 11 15 E 10 15 E 9 15 E 8 15 E 7 15 E 6 15 E 5 13 E 1 14 D 13 15 D 13 13 E 6 13 E 5 14 F 1 13 F 1 14 E 12 14 E 11 14 E 10 14 E 9 14 E 8 14 E 7 14 E 6 13 E 4 13 E 3 13 E 2 15 F 4 14 F 3 13 F 2 5 F 1 12 E 11 12 E 10 12 E 9 12 E 8 12 E 7 15 F 3 14 F 2 13 F 2 13 E 12 13 E 11 13 E 10 13 E 9 13 E 8 13 E 7 15 F 5 14 F 4 13 F 3 12 F 2 11 F 1 11 E 10 11 E 9 11 E 8 11 E 7 10 E 7 10 E 6 10 E 5 10 E 4 10 E 3 10 E 2 10 E 1 11 D 9 12 D 10 16 F 7 15 F 6 14 F 5 13 F 4 12 F 3 11 F 2 10 F 1 10 E 9 10 E 8 15 F 7 14 F 6 13 F 5 12 F 4 11 F 3 10 F 2 9 F 1 9 E 8 16 F 9 15 F 8 14 F 7 13 F 6 12 F 5 11 F 4 10 F 3 9 F 2 8 F 1 8 E 7 16 F 8 14 D 6 15 D 6 16 F 10 15 F 9 14 F 8 13 F 7 12 F 6 11 F 5 10 F 4 9 F 3 8 F 2 7 F 1 7 E 6 7 E 5 7 E 4 7 E 3 7 E 2 7 E 1 11 D 712 D 713 D 7 14 D 7 14 D 515 D 5 15 F 10 14 F 9 13 F 8 12 F 7 11 F 6 10 F 5 9 F 4 8 F 3 7 F 2 6 F 1 6 E 5 6 E 4 6 E 3 6 E 2 6 E 1 7 D 6 8 D 6 9 D 6 10 D 611 D 6 12 D 613 D 6 15 D 4 15 F 11 14 F 10 13 F 9 12 F 8 11 F 7 10 F 6 9 F 5 8 F 4 7 F 3 6 F 2 5 F 1 5 E 4 5 E 3 5 E 2 5 E 1 6 D 5 7 D 5 8 D 5 9 D 5 10 D 511 D 512 D 5 13 D 5 6 F 3 5 F 2 4 F 1 4 E 3 4 E 2 4 E 1 5 D 4 6 D 4 7 D 4 15 F 12 14 F 11 13 F 10 12 F 9 11 F 8 10 F 7 9 F 6 8 F 5 7 F 4 6 F 4 5 F 3 4 F 2 3 F 1 3 E 2 3 E 1 4 D 3 5 D 3 6 D 3 15 F 13 14 F 12 13 F 11 12 F 10 11 F 9 10 F 8 9 F 7 8 F 6 7 F 5 5 F 4 4 F 3 3 F 2 2 F 1 2 E 1 3 D 2 4 D 2 5 D 2 6 D 2 14 F 13 13 F 12 12 F 11 11 F 10 10 F 9 9 F 8 8 F 7 7 F 6 6 F 5 5 A 1 4 A 1 3 A 1 2 A 1 1 2 D 1 3 D 1 4 D 1 5 D 1 14 A 1 13 A 112A 1 11 A 1 10 A 1 9 A 1 8 A 1 7 A 1 6 A 1 5 A 2 4 A 2 3 A 2 2 B 1 2 C 1 3 C 2 4 C 3 5 C 4 6 C 5 14 A 213 A 2 12 A 211 A 210 A 2 9 A 2 8 A 2 7 A 2 6 A 2 15 C 12 15 A 3 14 A 313 A 312 A 3 11 A 310 A 3 9 A 3 8 A 3 7 A 3 6 A 3 5 A 3 4 A 3 3 B 1 3 B 2 3 C 1 4 C 2 6 A 4 5 A 4 4 B 1 4 B 2 4 B 3 4 C 1 5 C 2 6 C 3 7 C 4 15 A 414 A 4 13 A 412 A 411 A 4 10 A 4 9 A 4 8 A 4 7 A 4 6 A 5 5 B 1 5 B 2 5 B 3 5 B 4 5 C 1 6 C 2 7 C 3 8 C 4 15 A 514 A 513 A 5 12 A 511 A 510 A 5 9 A 5 8 A 5 7 A 5 6 B 1 6 B 2 6 B 3 6 B 4 6 B 5 6 C 1 7 C 2 8 C 3 16 A 7 15 A 6 14 A 613 A 612 A 6 11 A 610 A 6 9 A 6 8 A 6 7 A 6 15 A 714 A 7 13 A 712 A 711 A 7 10 A 7 9 A 7 8 A 7 16 A 8 15 A 814 A 813 A 8 12 A 811 A 810 A 8 9 A 8 8 B 1 16 A 915 A 9 14 A 913 A 912 A 9 11 A 910 A 9 9 B 1 9 B 2 9 B 3 9 B 4 5 B 9 6 B 9 7 B 9 8 B 9 9 C 1 10 C 2 11 C 3 8 B 2 8 B 3 8 B 4 8 B 5 8 B 6 8 B 7 8 C 1 9 C 2 7 B 1 7 B 2 7 B 3 7 B 4 7 B 5 7 B 6 7 C 1 8 C 2 9 C 3 11 D 8 15 D 9 11 E 3 11 E 2 11 E 1 12 D 11 13 D 11 14 D 11 10 D 811 D 712 D 8 13 D 8 12 D 913 D 914 D 9 15 D 11 14 D 815 D 8 9 D 16 13 D 10 14 D 10 15 D 10 10 D 16 8 D 16 15 D 12 12 E 6 12 E 5 12 E 4 12 E 3 12 E 2 12 E 1 13 D 12 14 D 12 8 E 6 8 E 5 8 E 4 8 E 3 8 E 2 8 E 1 9 D 8 9 E 7 9 E 6 9 E 5 9 E 4 9 E 3 9 E 2 9 E 1 10 D 9 11 E 6 11 E 5 11 E 4 10 D 7 8 D 7 9 D 7 15 D 77 D 16 11 D 212 D 2 13 D 114 D 2 9 D 2 10 D 2 7 D 3 8 D 3 9 D 3 10 D 311 D 3 12 D 313 D 214 D 3 15 D 3 8 D 4 9 D 4 10 D 4 11 D 4 5 C 3 6 C 4 11 C 9 12 C 10 13 C 11 14 C 12 14 C 13 6 D 1 7 D 1 8 D 1 9 D 1 10 D 1 11 D 112 D 113 D 1 14 D 1 7 D 2 8 D 2 12 D 413 D 4 14 D 4 15 C 13 7 C 5 8 C 6 9 C 7 10 C 8 7 C 6 8 C 7 9 C 8 10 C 9 11 C 10 12 C 11 13 C 12 13 C 2 14 C 3 15 C 4 8 C 16 10 C 3 8 C 5 9 C 6 10 C 7 11 C 8 12 C 9 13 C 10 14 C 11 9 C 4 12 B 7 12 B 8 12 B 9 12 B 10 15 C 10 14 C 10 10 C 4 11 C 5 12 C 6 13 C 7 14 C 8 15 C 9 10 C 16 9 C 5 10 C 6 11 C 7 12 C 8 13 C 9 10 C 5 11 C 6 12 C 7 11 B 9 12 B 11 12 C 1 15 A 214 A 3 13 B 1 13 B 2 13 B 3 13 B 4 13 B 5 13 B 6 13 B 7 13 B 8 13 B 9 13 B 10 13 B 11 13 B 11 13 C 1 14 C 2 15 C 3 15 A 2 14 A 12 13 A 12 15 A 11 14 A 11 13 A 11 12 A 11 11 B 1 11 B 2 12 B 3 11 B 3 12 B 1 12 B 2 12 B 4 16 A 10 15 A 10 14 A 10 13 A 10 12 A 10 11 A 10 11 B 10 11 C 112 C 2 10 B 7 10 B 8 10 B 9 10 C 1 10 B 1 10 B 2 10 B 3 10 B 4 10 B 5 10 B 6 11 B 4 11 B 5 11 B 6 11 B 7 11 B 8 12 B 5 12 B 6 13 C 4 14 C 5 15 C 6 7 C 16 11 C 2 12 C 3 15 C 11 13 C 3 14 C 4 15 C 5 11 C 4 12 C 5 13 C 6 14 C 7 15 C 8 9 C 16 13 C 8 14 C 9 12 C 4 13 C 5 14 C 6 15 C 7
Fig. 4 – EBR-II Primary Tank Layout.
Fig. 6 – EBR-II High - and Low - Pressure Inlet Plena.
DESCRIPTION OF THE SHRT-17 EXPERIMENT 2.3
Objectives of SHRT-17 2.3.1
The main objectives of SHRT-17 [1][11][12] are:
To support U.S. LMR plant design and to provide test data for validation of computer
codes for design, licensing and operation of LMRs.
To demonstrate effectiveness of natural circulation and natural phenomena (thermal
expansion of the sodium coolant and thermal inertia of the primary pool sodium) in protecting the reactor against potentially adverse consequences from protected loss-of-flow and loss-of-heat-sink accidents.
Configuration of the facility, boundary and initial conditions of SHRT-17 2.3.2
To initiate the SHRT-17 test, both primary coolant pumps and the intermediate-loop pump were tripped to simulate a protected loss-of-flow accident beginning from full power and flow conditions. In addition, the primary system auxiliary coolant pump that normally had an emergency battery power supply was turned off. The reduction in coolant flow rate caused reactor temperatures to rise temporarily to high, but acceptable levels as the reactor safely cooled itself down at decay heat levels by natural circulation.
Initial Conditions
Primary sodium heat balance calculations are not available for the SHRT-17 test. According to post run-reports for Run 129-C (ANL-EBR-132), the initial power for the SHRT-17 test was 57.3 MW [11].
Tab. 1 and Tab. 2 summarize the initial conditions and transient initiators for the SHRT-17 test.
Transient Boundary Conditions
The pump speeds of the two primary sodium pumps are treated as boundary conditions in the primary sodium circuit. In the intermediate sodium loop, the boundary conditions are the flow rate and temperature of the sodium at the inlet of the IHX. Data is provided for each of the boundary conditions for the 15-minute duration of the test.
Primary sodium pump speeds are illustrated in Fig. 8. Tab. 3 gives the pump parameters to be used for the EBR_II primary side simulation. While EBR-II has two “identical primary pumps, pump #2 has higher frictional torque losses and stops sooner during the coastdown.
The normalized measured fission power for the first twenty seconds of SHRT-17 is illustrated in Fig. 9. No measurements were taken to effectively collect either the total reactor power or the decay heat power during the transient. The resulting decay heat power is plotted with the scaled fission power in Fig. 10 along with the sum of the two for the total reactor transient power.
The boundary conditions for the intermediate sodium loop for the SHRT-17 benchmark are the sodium flow rate and temperature at the inlet to the IHX. The IHX inlet sodium flow rate on the intermediate side during SHRT-17 is depicted in Fig. 12. The corresponding IHX inlet sodium temperature is shown in Fig. 12.
Description of SHRT-17 2.3.3
SHRT-17 was a loss of flow test used to support LMR plant design and to demonstrate effectiveness of natural circulation cooling characteristics. Tab. 8, Tab. 9, Tab. 10 reports the
facility configuration, the imposed sequence of main events and the resulting sequence of main events.
The experimental test started with EBR-II in nominal steady state conditions, thus at full power and flow. The initiating events were the trip of the primary coolant pumps and of the intermediate-loop pump. The reactor was instantaneously scrammed. The primary pump trip mode was a breaker trip, thus the flow coast-down was governed by the kinetic energy stored in the inertia of motor-generator set. Intrinsic differences between the two pump drive units caused a difference in stop times. The auxiliary electromagnetic pump in the primary loop was turned off and did not receive power from battery backups as would occur during a total station blackout. The reduction in coolant flow rate caused reactor temperatures to rise temporarily to high, but acceptable levels, as the reactor safely cooled itself down at decay heat levels by natural circulation. The test stopped after 15 minutes without any operator action any system intervention.
Four phases and related phenomena are identified in the transient, as discussed in section 4. They are:
Phase 1 – effective core cooling by MCP coast-down (0 – 10s): from initiating events to
fuel cladding starts to rise;
Phase 2 – primary system energy increases and temperatures rise (10 – 100s): from end of
Phase 1 up to maximum fuel temperature in the core;
Phase 3 – buoyancy forces effective in removing energy from the core, long term cooling in
TEST DESCRIPTION
Initial Power 57.3 [MW]
Initial Primary Coolant Flow Through Core (at 700 K) 456 [kg/s] Initial Intermediate Coolant Flow (at 579 K) 311.43 [kg/s]
Initial Core Inlet Temperature 624.7 [K]
Primary and Intermediate Pump Coastdown Conditions Power to motor-generator sets removed
Control Rods Full insertion at test initiation
Auxiliary EM Pump Conditions Power to Auxiliary EM Pump removed
Tab. 1 – EBR-II, SHRT-17 Test Description.
INITIAL CONDITIONS
Core sodium mass flow rate (at 700 K) 456 [kg/s]
Average core inlet temperature 625 [K]
Pressure at discharge of primary sodium pump #1 295785 [Pa]
Pressure at discharge of primary sodium pump #2 288890 [Pa]
Upper plenum pressure 43850 [Pa]
Intermediate sodium mass flow rate (at 579 K) 311.43[kg/s]
EBR-II operated at full power for less than two hours prior to test Calculated initial decay heat
Resulting initial fission power
3.36 [MW] 53.93 [MW]
Tab. 2 – EBR-II, SHRT-17 Initial Conditions.
PARAMETER RATED
CONDITION
NR (rated speed) 870 [rpm] HR (rated head) 43 [m] QR (rated flow) 0.2946 [m3/s] NS (specific speed) 31.01/1602 [SI/gp]
IP (inertia) 16.0 [kg m2] TR (rated torque) 1300.0 [N m] Tf,R (friction torque) 0.0286 TR (37.2) [N m]
TIME [s] PUMP#1 [rpm] PUMP#2 [rpm] 0 799.0 764.9 2 727.7 695.4 4 566.7 532.6 6.5 407.5 376.6 9 323.2 301.5 12.5 244.1 230.1 17.5 172.5 167.3 24.5 109.2 113.9 33 56.5 74.62 42 0.69 46.54 51 0.76 2.29 90 0.76 2.44 120 0.61 2.44 180 0.76 2.44 240 0.84 2.59 300 0.61 2.44 360 0.61 2.44 420 0.61 2.44 480 0.61 2.44 540 0.76 2.44 600 0.76 2.75 660 0.69 2.44 720 0.69 2.44 780 0.76 2.59 840 0.76 2.44 900 0.92 2.44
Tab. 4 – EBR-II, SHRT-17: Primary Pump Speeds.
TIME [s] FISSION [MW] DECAY HEAT [MW] TOTAL POWER [MW]
0 53.93 3.36 57.29 1 8.24 3.12 11.36 2 6.86 2.95 9.81 3.5 5.61 2.77 8.38 5 4.76 2.63 7.39 7.5 3.82 2.46 6.29 10 3.23 2.33 5.56 15 2.47 2.15 4.62 22.5 1.85 1.95 3.8 30 1.46 1.82 3.28 40 1.1 1.7 2.79 50 0.84 1.6 2.44 60 0.66 1.52 2.19 90 0.38 1.35 1.73 120 0.25 1.24 1.49 180 0.13 1.09 1.22 240 0.1 1 1.1 300 0.1 0.93 1.02 360 0.08 0.88 0.96 420 0.08 0.83 0.92 480 0.08 0.8 0.88 540 0.08 0.77 0.84 600 0.08 0.74 0.82 660 0.08 0.71 0.79 720 0.07 0.69 0.76 780 0.08 0.67 0.75
TIME [s] IHX MASS FLOW RATE [kg/s] 0 311.7 1 234.1 2.5 157.1 6 88.41 16.5 42.16 30 28.34 60 21.29 120 18.20 180 18.29 240 19.03 300 20.58 360 21.74 420 22.03 480 22.37 540 22.08 600 23.56 660 22.17 720 20.47 780 19.82 840 18.88 900 17.24
Tab. 6 – EBR-II, SHRT-17: Intermediate IHX Inlet Sodium Flow rate.
TIME [s] IHX INLET TEMPERATURE [K]
0 574.3 60 574.2 120 574.0 180 574.1 240 573.9 300 573.5 360 573.2 420 572.9 480 572.6 540 572.5 600 572.1 660 571.3 720 570.0 780 568.5 840 566.7 900 565.3
Tab. 7 – EBR-II, SHRT-17: Intermediate IHX Inlet Sodium Temperature.
SYSTEMS CHARACTERISTICS STATUS
Primary and Intermediate Pump Loop #1 Loop #2
Power to motor-generator sets removed
Control Rods 8 Rods Full insertion at test
initiation
Safety Rods 2 Rods Full insertion at test
initiation
Throttle Valve Loop #1
Loop #2 Active
Auxiliary EM Pump Conditions -- Power to Auxiliary EM
Pump removed
IMPOSED EVENT DESCRIPTION SYSTEM SIGNAL (TIME OR
SET POINT) REMARKS
Trip of the MCP and coastdown MCP 0 s Coast-down in Fig. 8
Scram Control and
Safety Rods 0 s Total power in Fig. 10
End of transient -- 900 s --
Tab. 9 – EBR-II, SHRT-17: imposed sequence of main events.
Ph. W. DESCRIPTION & PHENOMENA/PROCESSES EVENT Exp [s] Phase I (0 – 10 s)
Pressure drop at discontinuities Wall to fluid friction
Heat transfer in covered core
Heat transfer in passive structures and heat losses; Pool thermal hydraulics in the tank
Multidimensional coolant temperatures and flow distributions
Heat transfer in IHX primary (i.e. bundle zone) and secondary (non-bundle) sides and between IHX primary coolant and passive structures Thermal mixing in reactor upper plenum Forced circulation
Pump behavior
Stop MCP [Imposed] 0
Initiating event: loss of IHX flow rate [Imposed] 0
SCRAM [Imposed] 0
Min. cladding T in XX09 @ TAF 4.5
Min. cladding T in XX10 @ core TAF 10
Min. coolant T in UP 12
Phase II
(10 – 100s)
Pressure drop at discontinuities Wall to fluid friction
Heat transfer in covered core
Heat transfer in passive structures and heat losses; Pool thermal hydraulics in the tank
Multidimensional coolant temperatures and flow distributions
Conduction in fluid and structures
Heat transfer in IHX primary (i.e. bundle zone) and secondary (non-bundle) sides and between IHX primary coolant and passive structures Thermal mixing in reactor upper plenum Transition from forced to natural circulation Pump behavior (i.e. coastdown)
Max. cladding T in XX09 @ TAF 73.5
Max. cladding T in XX10 @ core TAF 96.5
Max. coolant T in UP 138.5
MCP 2 coastdown end [minimum of mass flow rate] 76
Phase III
(74 – 900s)
Pressure drop at discontinuities Wall to fluid friction
Heat transfer in covered core
Heat transfer in passive structures and heat losses; Pool thermal hydraulics in the tank
Multidimensional coolant temperatures and flow distributions
Conduction in fluid and structures
Heat transfer in IHX between primary coolant and passive structures
1 Φ natural circulation; and Stratification in upper plenum
End of transient [Imposed]
(Cladding T XX09 @ TAF)
(Cladding T XX10 @ core TAF)
900
691-705K 672-675K
Fig. 8 – EBR-II, SHRT-17: Primary Pump Speeds.
Fig. 10 – EBR-II, SHRT-17: Total, Fission and Decay Heat Power.
RELAP5-3D
© NODALIZATION3
RELAP5-3D©v4.0.3 code 3.1
The RELAP5 [27] series of code has been developed at the Idaho National Laboratory (INL) under sponsorship of the U.S. Department of Energy, the U.S. Nuclear Regulatory Commission, members of the International Code Assessment and Applications Program (ICAP), members of the Code Applications and Maintenance Program (CAMP), and members of the International RELAP5 Users Group (IRUG). Specific applications of the code have included simulations of transients in light water reactor (LWR) systems such as loss of coolant, anticipated transients without scram (ATWS), and operational transients such as loss of feedwater, loss of offsite power, station blackout, and
turbine trip. RELAP5-3D© [28], the latest in the series of RELAP5 codes, is a highly generic code
that, in addition to calculating the behavior of a reactor coolant system during a transient, can be used for simulation of a wide variety of hydraulic and thermal transients in both nuclear and non-nuclear systems involving mixtures of vapor, liquid, non-condensable gases, and nonvolatile solute [7][29][30].
The RELAP5-3D© version contains several important enhancements over previous versions of the
code. The most prominent attribute that distinguishes the RELAP5-3D© code from the previous
versions the fully integrated, multi-dimensional thermal hydraulic and kinetic modeling capability. This removes any restrictions on the applicability of the code to the full range of postulated reactor accidents. Enhancements include a new matrix solver for 3D problems, new thermodynamic properties for water, and improved time advancement for greater robustness. Enhancements also include all features and models previously available in the ATHENA configuration version of the code, which are as follows: addition of new working fluids (e.g. ammonia, blood, carbon dioxide, DowThermA, glycerol, helium, helium-xenon, hydrogen, lead-bismuth, lithium, lithium-lead,
molten salts, nitrogen, potassium, R134a (SUVA®), sodium, sodium-potassium, and xenon) and a
magneto-hydrodynamic model [28].
EBR-II nodalization 3.2
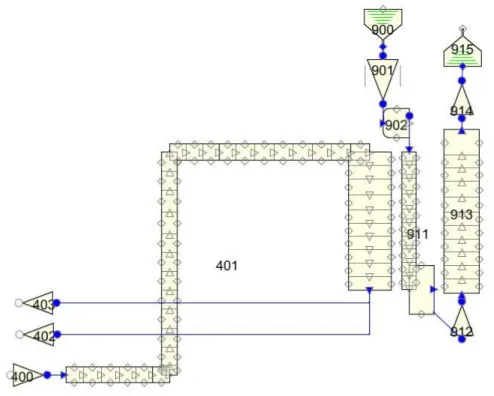
A description of the RELAP5-3D© nodalization [2] is summarized below, distinguishing:
The coolant system, that includes: the pool region, the lower and the top part of the pool; the
major components in the primary sodium circuit: pumps, high and low pressure flow lines, throttle valve; the Z-Pipe and the intermediate heat exchanger, primary and secondary side.
The reactor region, that includes the reactor vessel, including the lower plenum, the upper
plenum and the core bypass; the core subassemblies, divided in the central core region (driver subassemblies) and outer blanket region (reflector and blanket subassemblies). The EBR-II nodalization is shown from Fig. 13 to Fig. 17. The entire input deck consists of 3985 hydraulic volumes, 6428 hydraulic junctions and 5248 thermal structures. More details regarding the adopted code resources have been reported in Tab. 11. Detailed description of the nodalization is available in Ref. [2].
Nodalization features 3.3
Recommended common rules involving characteristic dimensions, flow path area, elevations, heat structures and capacities have been taken into account from the EBR-II benchmark data [11].
Bypass is modeled according to geometric specifications, when available, and mass flow
data in steady state.
Comparisons between EBR-II pump specifications and code modelling characteristics are in
Tab. 12
A sliced approach is applied at all systems (i.e. coolant system, reactor core).
The elevations of the different parts of the plant are maintained in the nodalization.
Dimension of nodes is set-up according with the expected spatial temperature gradients,
relevant geometrical features of the systems and measurement points constraints.
The node to node ratio is kept uniform, as much as possible, with reference maximum ratio
of 1.2 between adjacent sub-volumes.
The roughness is set 3.2e-5 m with the exception of the core region, where is set 1.0e-6 m as
consequence of the nodalization qualification, as reported in Ref. [2].
The standard RELAP5 wall friction correlations (i.e. laminar and turbulent regions) are
modified with Cheng and Todreas formulations to represent wire wrapped rod bundle with optionally form loss coefficient with a Reynolds dependence [17][34].
K-loss coefficients in junctions have been evaluated or estimated on the basis of geometries,
when available.
Standard RELAP5 liquid metals correlations are used for convective heat transfer for
non-bundle and non-bundle zones, described in Refs. [34] and [26].
Modeling changes for open calculation 3.4
Blind simulation results of test SHRT-17 is reported in Ref. [2].
The open simulation of test SHRT-17 is carried out with few modifications:
The pressure drops of the primary system are set-up according with the experimental results
of the test. Dependence of energy loss coefficients from Re number is taken into account to improve the prediction of the mass flow rate in the subassembly.
The orientation of the core with respect to the high and low pressure line connections is
corrected as in the real configuration, thanks to up-dated information delivered by the benchmark coordinators.
a) Scheme of the pool region b) Scheme of the reactor vessel
Fig. 13 – EBR-II SHRT-17, RELAP5-3D©: schematization of 3D components.
a) Pump#1,
[1] High and Low pressure flow lines#1
b) Pump#2,
[2] High and Low pressure flow lines#2
Fig. 15 – EBR-II SHRT-17, RELAP5-3D©: scheme of pumps, high and low pressure flow lines.
Fig. 17 – EBR-II SHRT-17, RELAP5-3D©: MARK-II AI fuel assembly
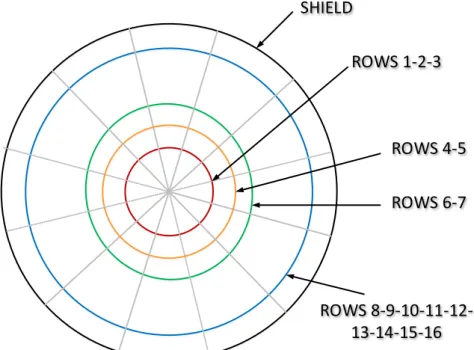
Fig. 18 – EBR-II SHRT-17, RELAP5-3D©: plane view of reactor core subdivision.
SHIELD ROWS 1-2-3 ROWS 4-5 ROWS 6-7 ROWS 8-9-10-11-12-13-14-15-16
# QUANTITY Value
1 Tot. No. of HYDRAULIC volume 3985
2 Tot. No. of HYDRAULIC junction 6428
3 Tot. No. of HYDRAULIC volume in the core 2460
4 Tot. No. of heat structures 5248
5 Tot. No. of mesh points in the heat structures 31236 6 Tot. No. of core active structures (radial x axial) 8 x 5
Tab. 11 – EBR-II nodalization:adopted code resources.
PARAMETER UNIT RATED CONDITION RELAP5-3D
Speed [rad/s] 91.10 91.10
Head [kPa] 358.530 328.5
Flow [kg/s] 250.2 251.40 / 251.34
Torque [Nm] 1300.0 1204.1
Q
UALIFICATION OF EBR-II NODALIZATION AGAINST SHRT-17 TEST4
Results of RELAP5-3D© simulations are presented: the blind calculation (Ref. [2]), performed on
the basis of initial and boundary conditions delivered to the benchmark participants, and the open calculation, after the availability of the experimental data trends.
The mass flow rate distribution in the core sub-assemblies (i.e. core, extended core and blanket/reflector zones) has been set up using steady state data in isothermal conditions released to benchmark participants. These data provide mass flow rates in core sub-assemblies at rated pump operation. Detailed subassembly power distribution was also provided to benchmark participants with the reactor core at full power. Then, total core fission and decay heat powers versus time were given in benchmark specifications. The other boundary conditions used to set up the code simulations of SHRT-17 test were: MCP speed versus time; IHX secondary side mass flow rate and temperature versus time.
The initial conditions of the experiment at the end of steady state calculation are compared in Tab. 13. Steady state and initial conditions are achieved accordingly with the specifications for blind and open simulations. Few minor deviations are observed among the code results and the experimental data.
The comparison of the resulting sequences of main events is reported in Tab. 14. Selected experimental and calculated parameter trends are reported below and discussed (see also Ref. [35]). Three phases and related phenomena are identified in the transient (see section 2.3.3).
Phase 1 – effective core cooling by MCP coast-down (0 – 10s): from initiating events to fuel
cladding starts to rise.
Phase 2 – primary system energy increases and temperatures rise (10 – 100s): from end of
Phase 1 up to maximum fuel temperature in the core.
Phase 3 – buoyancy forces effective in removing energy from the core, long term cooling in
natural circulation (100 – 900s): from end of Phase 2 up to end of transient.
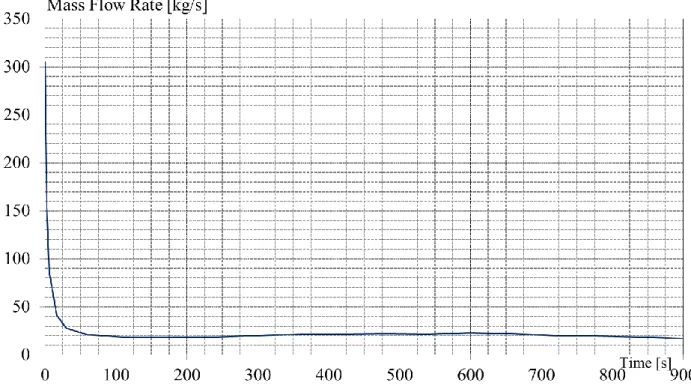
The initiating events of the test are the primary pumps and the intermediate pump trips (Phase 1). The reactor SCRAM occurs and the transient evolves without any system intervention or any operator/external action, thus such as a station blackout. The core temperatures (cladding and coolant, see Fig. 19) decrease for about 10 s (9 seconds considering the cladding temperatures at TAF of subassembly XX09, Fig. 23), due to sharp decrease of nuclear fission power, and mass flow rate, with the pump coasting-down, is still above 30% of initial value (see Fig. 42, Fig. 43, Fig. 44, Fig. 45 and Fig. 46).
Correct prediction of this phase is mainly connected with the energy distribution in the core structures, the thermal inertia and, then, the evaluation of the pressure drop in the system (i.e. dominated by the subassembly inlet orifices and friction losses in wire wrapped fuel bundle) and the pump coast-down. The main parameters trends of blind (Ref. [2]) and open simulations are satisfactory during this phase, because the convective heat transfer between the core structures and
the coolant is correctly calculated by the code, the flow distribution in core subassemblies is still proportional to the initial distribution and the conduction in the fluid is still negligible.
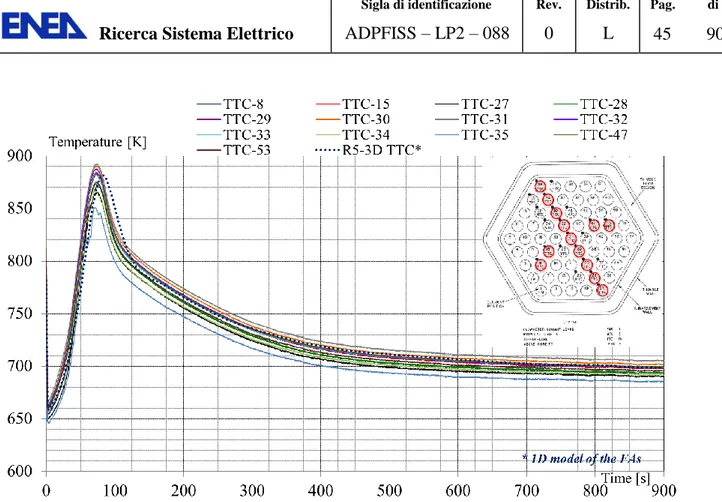
When the coolant pump flow rate decreases below 30% of nominal mass flow rate, the unbalance between total core power (fission and decay heat) and energy removed by the primary coolant flow causes a sharp increase of cladding and coolant temperatures in the subassemblies (phase 2). The maximum cladding temperatures experienced by the experimental subassemblies XX09 and XX10 at top of active core are observed at 73 s and 96 s, respectively (see Fig. 23 and Fig. 29). Code predictions are driven by the pump inertia, the pressure drops calculated in the subassemblies inlet orifices and in the wire wrapped fuel bundles.
The latest is based on Cheng and Todreas formula specified in the input deck. This means that the code follows this formula in laminar and turbulent regions. Larger errors are in the transition region, because Cheng and Todreas formulation has the transition region function of P/D, whereas in RELAP5-3D is a constant range 2200 < Re < 3000 [34].
The energy loss coefficients at subassemblies inlet orifices are set up on the basis of the experimental data trends of mass flow rates at nominal steady state. However, it is expected that
RELAP5-3D© has the capability to model the Reynolds dependent energy loss coefficients of these
geometries, with some limitations in the laminar region, as discussed in Ref. [34].
Timing and rates of coolant and cladding temperature increases in the core are qualitatively and quantitatively well predicted in code simulation (see XX09 from Fig. 22 to Fig. 26; XX10 from Fig. 28 to Fig. 32). The blind simulation was affected by an underestimation, see Ref. [2]. This was connected with the faster increase of mass flow rate, following the pumps coast-down end, and with the flow stabilization to an higher value.
The open calculation evidenced an excellent simulation of the mass flow rates measured in high and low pressure lines (Fig. 45 and Fig. 46), as well as of the mass flow rates in available experimental subassemblies XX09 and XX10 (Fig. 47 and Fig. 48). Experimental cladding and coolant temperatures are simulated with satisfactory accuracy, in particular when the safety relevant parameters are considered (see Fig. 21 to Fig. 25 and Fig. 27 to Fig. 31). Nevertheless, some quantitative differences are observed and hereafter discussed.
Considering that the mass flow rates are correctly predicted, the coolant flows from high and low pressure feeding pipes towards the corresponding lower plena, delivering the sodium towards the different sub-assemblies. In this zone, complex three dimensional coolant flow distribution is
roughly simulated by the coarse MULTID component of RELAP5-3D©. Then, once the natural
circulation is the prevailing driving force of primary flow, the thermal conductivity in the core thermal structures and in the fluid becomes relevant.
The reference blind and open calculations do not account for axial thermal conduction in heat structures (i.e. only radial conduction is calculated by the code). However, the code has the capability to calculate the axial conduction in the heat structure, but it does not have the same capability for the conduction in the fluid. This would result in a conservative prediction of the code simulations with respect to temperatures of heat structure. Indeed, sensitivity analyses were carried
out to evaluate the effect of the axial conduction model implemented in RELAP5-3D© (see
Moreover, considering the conduction in the coolant, it will affect the temperature distribution of subassemblies in radial and axial directions (see Fig. 33, Fig. 34, Fig. 35, Fig. 36, Fig. 37 and Fig. 38). This level of detail is beyond the objectives of the present simulation and the capabilities of
RELAP5-3D© nodalization. The conduction in the coolant affects the temperature distribution
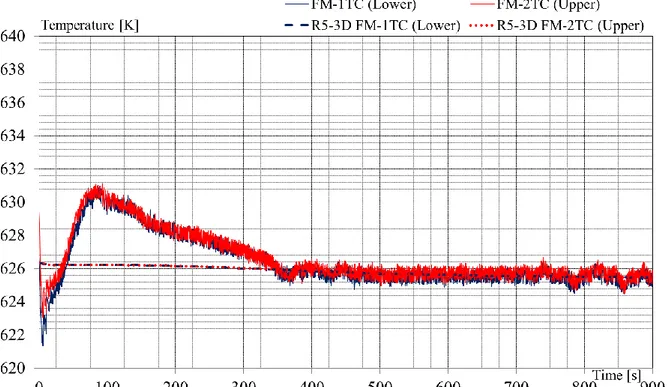
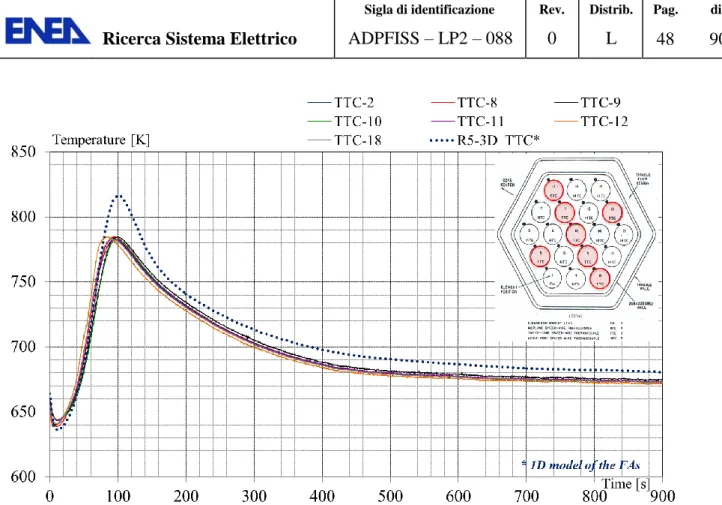
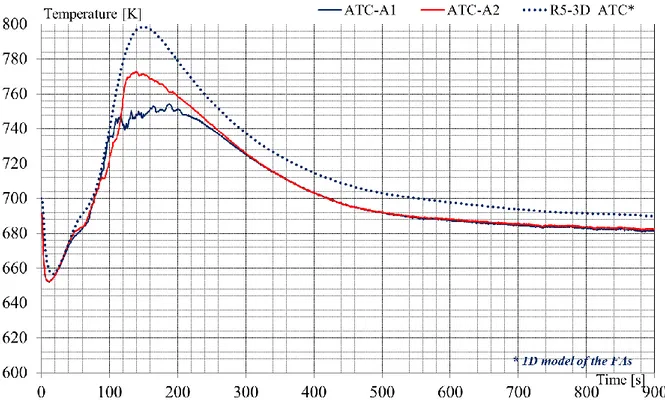
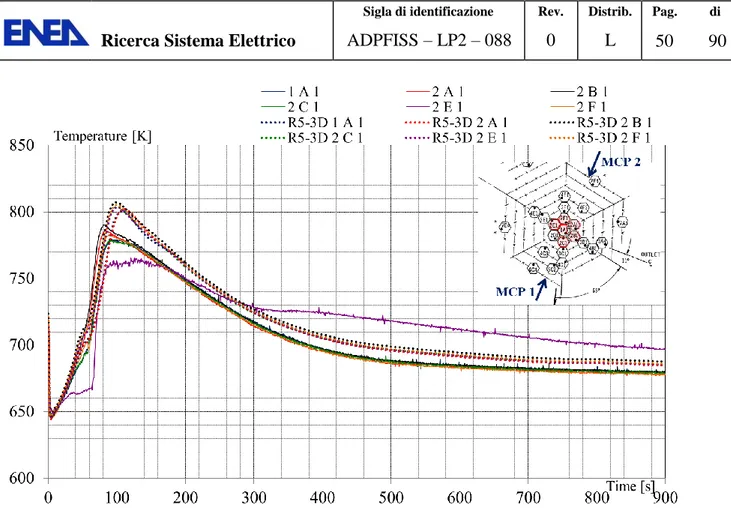
upstream, downstream the active fuel and of core bypass region. This effect is highlighted by the coolant temperature change from the high pressure line, upstream the reactor zone (Fig. 41) and the coolant temperatures in XX09 and XX10 at flow meter (see Fig. 21 and Fig. 27). Looking at Fig. 21 and Fig. 27, it is evident that the coolant temperature is higher than in the code results, but the experimental thermocouples in XX09 (two at about 15-20 cm of distance) measure the same temperature, on the opposite in XX10 a coolant temperature difference is observed. For sake of clarity, it is highlighted that conduction of fluid is treated as infinite, when a computational volume is concerned, and zero, when adjacent computational volumes are considered. Considering the experimental subassemblies XX09 and XX10, they are both placed in the fifth ring of the reactor core. According with the MULTID discretization, 3 subassemblies of fourth ring and 4 of the fifth exchange energy with the corresponding radial and azimuthal bypass stack of hydraulic volumes. This means that only one temperature is assumed (infinite fluid conduction) for the hydraulic volume and no exchange of energy is possible between adjacent bypass volumes without transport of mass (no fluid conduction). This explain why, the XX09 cladding and coolant temperatures are accurate in the active zones and less accurate downstream, whereas in XX10, the temperature at mid core is overestimated and excellent prediction of the experimental temperatures otherwise. The thimble coolant temperatures at top of sub-assemblies are overestimated in both XX09 and XX10 as well.
Considering the upper plenum of the reactor zone, the measured temperature trends are connected with the mixing, induced by the forced circulation during the phase 1 of the test, the onset of thermal stratification is in phase 2, which, then, becomes the prevailing process after 100 seconds from the starting of transient. The correct prediction of coolant thermal mixing and stratification
phenomena cannot be accurately predicted by RELAP5-3D© code. It is influenced by the
nodalization scheme, and thus by the user effect. Improved prediction of thermal stratification can be achieved increasing the number of axial meshes in the upper plenum, and improving the knowledge of the flow paths occurring in this zone. Performances of open simulation is reported in Fig. 39.
Phase 2 ends after about 100s, when total core power (i.e. mainly decay heat) is efficiently removed in all subassemblies by natural circulation flow.
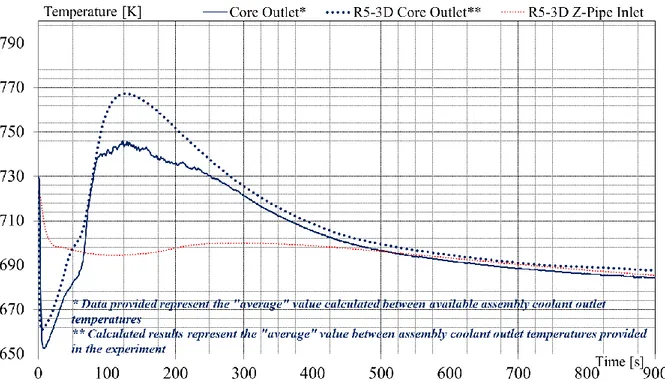
The coolant from reactor core is transported towards the Z-pipe (Fig. 20) at the IHX inlet and outlet (Fig. 40). During phase 3, the natural circulation is stabilized. Coolant temperature at core outlet and thermal structures in the core zone are cooled down. The results of the simulation predict correctly these trends. Improved quantitative accuracy is observed in open calculation, thanks to a better simulation of natural circulation flow.
The experiment is stopped after 900s, with the maximum coolant temperatures at subassemblies XX09 and XX10 equal to 691-705K and 672-675K, respectively. The blind (open) simulation predicts these temperatures 674K (700K) and 665K (676K).
In summary, the simulation demonstrate that RELAP5-3D© has the capability to predict the main
phenomena and processes relevant to safety of the test. The trends of primary mass flow rate are well predicted (open calculation). Analogous consideration is applicable to coolant and cladding
temperatures of primary system. Improvements might be possible if knowledge of EBR-II features/characteristics is improved too (e.g. inlet sub-assemblies geometry details and characterization, better understanding and quantification of the cooling induced by the IHX structures close to the Z-pipe inlet).
Fig. 19 – EBR-II SHRT-17, RELAP5-3D©: envelop of fuel centerline temperatures, PCT, and coolant temperatures in the core .
Fig. 20 – EBR-II SHRT-17, RELAP5-3D©: averaged coolant outlet temperature and Z-pipe inlet coolant temperature .
Fig. 21 – EBR-II SHRT-17, RELAP5-3D©: FA XX09 coolant temperature at flowmeter (0.25 and 0.4m below BAF).
Fig. 22 – EBR-II SHRT-17, RELAP5-3D©: FA XX09 cladding temperatures at middle of active core.
Fig. 23 – EBR-II SHRT-17, RELAP5-3D©: FA XX09 cladding temperatures at top of active core.
Fig. 24 – EBR-II SHRT-17, RELAP5-3D©: FA XX09 cladding temperatures at top of wire wrapped fuel bundle.
Fig. 25 – EBR-II SHRT-17, RELAP5-3D©: FA XX09 coolant temperatures at outlet.
Fig. 26 – EBR-II SHRT-17, RELAP5-3D©: FA XX09 coolant temperatures at outlet of thimble channel.
Fig. 27 – EBR-II SHRT-17, RELAP5-3D©: FA XX10 coolant temperature at flowmeter (0.25 and 0.4m below BAF).
Fig. 28 – EBR-II SHRT-17, RELAP5-3D©: FA XX10 cladding temperatures at middle of active core.
Fig. 29 – EBR-II SHRT-17, RELAP5-3D©: FA XX10 cladding temperatures at top of active core.
Fig. 30 – EBR-II SHRT-17, RELAP5-3D©: FA XX10 cladding temperatures at top of wire wrapped fuel bundle.
Fig. 31 – EBR-II SHRT-17, RELAP5-3D©: FA XX10 coolant temperatures at outlet.
Fig. 32 – EBR-II SHRT-17, RELAP5-3D©: FA XX10 coolant temperatures at outlet of thimble channel.
Fig. 33 – EBR-II SHRT-17, RELAP5-3D©: selected SA, ring 1 and 2 coolant outlet T.
Fig. 35 – EBR-II SHRT-17, RELAP5-3D©: selected SA, ring 4 coolant outlet T.
Fig. 37 – EBR-II SHRT-17, RELAP5-3D©: selected SA, ring 7 coolant outlet T.
Fig. 39 – EBR-II SHRT-17, RELAP5-3D©: upper plenum coolant temperatures.
Fig. 41 – EBR-II SHRT-17, RELAP5-3D©: high and low pressure inlet lower plenum coolant temperatures.
Fig. 43 – EBR-II SHRT-17, RELAP5-3D©: primary pump mass flow rate (zoom 1).
Fig. 45 – EBR-II SHRT-17, RELAP5-3D©: high and low pressure lines #2 mass flow rate.
Fig. 47 – EBR-II SHRT-17, RELAP5-3D©: FA XX09 mass flow rate.
# Parameter Unit Exp Blind Calc
Open Calc
1 Core Driver thermal power MWth 52.28 52.28 52.28
2 Core Blanket thermal power MWth 5.02 5.02 5.02
3 Core inlet temperature K 624.15 625.6 625.9
4 Core outlet temperature K -- 730.3 720.9
5 IHX SS inlet coolant temperature K 574.2 574.2 574.2
6 MCP1 mass flow rate kg/s 233.5 231.2 233.8
7 MCP2 mass flow rate kg/s 233.2 230.9 233.8
8 Core Driver mass flow rate kg/s 387.0 384.6 389.9
9 Core Blanket mass flow rate kg/s 65.2 66.0 65.9
10 IHX SS mass flow rate kg/s 311.4 311.4 311.4
11 Primary pressure @ MCP out kPa 441.2 452.5 473.0
12 Primary pressure @ Upper Plenum kPa 213.9 217.1 210.6
Tab. 13 – EBR-II SHRT-17, RELAP5-3D©: steady-state comparison.
Ph. W. EVENT Exp [s] Blind Calc [s] Open Calc [s] Phase I (0 – 10 s) Stop MCP [Imposed] 0 0 0
Initiating event: loss of IHX flow rate [Imposed] 0 0 0
SCRAM [Imposed] 0 0 0
Min. cladding T in XX09 @ TAF 4.5 4.0 4.0
Min. cladding T in XX10 @ core TAF 10 16 13
Min. coolant T in UP 12 6 6
Phase II
(10 – 100s)
Max. cladding T in XX09 @ TAF 73.5 67 81
Max. cladding T in XX10 @ core TAF 96.5 88 110
Max. coolant T in UP 138.5 89 131
MCP 2 coastdown end [minimum of mass flow rate] 76 62 60
Phase III
(74 – 900s)
End of transient [Imposed]
(Cladding T XX09 @ TAF)
(Cladding T XX10 @ core TAF)
900 691-705K 672-675K 900 674K 665K 900 700K 676K