Analisi del comportamento del
combustibile MOX ad elevato burnup in
condizioni di normal operation e DBA
D. Rozzia, N. Forgione, A. Ardizzone, A. Del Nevo
Report RdS/2013/024
Agenzia nazionale per le nuove tecnologie,
ANALISI DEL COMPORTAMENTO DEL COMBUSTIBILE MOX AD ELEVATO BURNUP IN CONDIZIONI DI NORMAL OPERATION E DBA
D. Rozzia, N. Forgione (UNIPI), A. Ardizzone (POLITO), A. Del Nevo (ENEA)
Settembre 2013
Report Ricerca di Sistema Elettrico
Accordo di Programma Ministero dello Sviluppo Economico -‐ ENEA Piano Annuale di Realizzazione 2012
Area: Produzione di energia elettrica e protezione dell'ambiente
Progetto: Sviluppo competenze scientifiche nel campo della sicurezza nucleare e collaborazione ai programmi internazionali per il nucleare di IV Generazione
Obiettivo: Sviluppo competenze scientifiche nel campo della sicurezza nucleare Responsabile del Progetto: Mariano Tarantino, ENEA
Il presente documento descrive le attività di ricerca svolte all’interno dell’Accordo di collaborazione “Sviluppo competenze scientifiche nel campo della sicurezza nucleare e collaborazione ai programmi internazionali per il nucleare di IV generazione” Responsabile scientifico ENEA: Mariano Tarantino
Abstract
The capability of the fuel to operate at high power without melting is of interest to FR's because reactor design limits normally require that there be a low probability of fuel melting during state operation including overpower conditions. This requirement has a direct effect on the steady-state power limit of the fuel pin and the reactor. Optimization of this power capability is important to reactor thermal efficiency and economy of operation. Due to the high temperature drop achieved in the pellet to cladding gap at beginning of life, it is necessary to check the power needed to cause fuel melting at reactor start-up even for fuels designed to operate at high burn-ups.
The HEDL-P-19 experiment was conducted during 1971 in the EBR-II reactor to investigate the effects of initial fuel-to-cladding diametric gap sizes, from 0.086 to 0.25 mm, on the linear-heat-rate needed to cause incipient fuel melting at beginning-of-life. The test included 16 FBR fresh MOX fuel rods clad with cold worked type 316 stainless.
The present document constitutes the contribution LP2.a.3_c to the task A.3 of ADP-2012. The aim of the activity is to summarize the main results obtained after the simulations of 16 FBR fuel rods included in the above mentioned database by means of TRANSURANUS code. Particular emphasis is given to the main variables which influence the prediction of the fuel temperature profile and its related phenomena during power excursion. The activity is based on the comparison between experimental data collected at the end of the test and simulated trends (i.e. axial extent of melting, columnar grain radius, central void formation, gap size). The importance of the sensitivity analysis, as tool to address the relevance selected parameters and code models on the results is also discussed. This document consists of four main sections and two attached appendixes. Section one points out the objective and the framework of the activity. The HEDL-P-19 experiment is described in section two. The section includes the procedure adopted to develop the TRANSURANUS reference input decks. Sections three constitutes the core of this report. It aims to investigate the capabilities of TRANSURANUS code in simulating HEDL-P-19 experiment. This is pursued by systematic comparison between simulated and measured trends and by extensive comparative analyses among selected models. Conclusions are finally given in section four. Appendix A and B report detailed figures in support to the comparative analyses.
CONTENTS
L
IST OF REVISION... E
RRORE.
I
L SEGNALIBRO NON È DEFINITO.
A
BSTRACT... 3
A
BBREVIATIONS... 7
L
IST OF FIGURES... 9
L
IST OF TABLES... 11
1
I
NTRODUCTION... 13
1.1
Background ... 13
1.2
Objective of the activity ... 14
2
D
ESCRIPTION OF THE EXPERIMENT AND DEVELOPMENT OF THE INPUT DECKS. 15
2.1
The HEDL-P-19 Experiment ... 15
2.1.1 Main achievements from the experiment ... 16
2.2
Development and setup of the TRANSURANUS models ... 19
2.2.1 Description of the HEDL P-19 input deck ... 19
2.2.2 Selection of the boundary conditions ... 19
3
A
SSESSMENT OFTU
CODE AGAINSTHEDL
P-19
EXPERIMENT... 21
3.1
Simulation of the gap size: cracking and relocation effects ... 21
3.2
Simulation of fuel temperature profile: fuel conductivity effects ... 25
4
C
ONCLUSIONS... 31
REFERENCES ... 33
APPENDIX
A:
C
OMPARATIVE ANALYSES ONR
ELOCATIONM
ODELS... 35
APPENDIX
B:
C
OMPARATIVE ANALYSES ON FUEL CONDUCTIVITY... 43
Abbreviations
ADS Accelerator Driven System
ADP Accordo Di Programma
ALFRED Advanced Lead cooled Fast Reactor
ASTRID Advanced Sodium Test Reactor for Industrial Demostration
BOL Beginning Of Life
CIRTEN Consorzio Interuniversitario per la Ricerca Tecnologica Nucleare
CW Cold Worked
DIMNP Dipartimento di Ingegneria Meccanica Nucleare e della Produzione EBR-II Experimental Breeder Reactor #2
ENEA Agenzia nazionale per le nuove tecnologie, l'energia e lo sviluppo economico sostenibile
FBR Fast Breeder Reactor
FP Fission Product
FR Fast Reactor
FRAPCON-3 “Steady state fuel rod performance code”
GEN-IV GENeration - IV
He Helium
HEDL Hanford Engineering Development Laboratory ITU Institute for Transuranium Elements
LFR Lead cooled Fast Reactor
LHR Linear Heat Rate
LWR Light Water Reactor
MA Minor Actinide
MHYRRA Multi-purpose HYbrid Research Reactor
MOX Mixed OXide (fuel)
NPP Nuclear Power Plant
OD Outer Diameter
O/M Oxygen to Metal ratio
PIE Post Irradiation Examination
Pu Plutonium
PWR Pressurized Water Reactor SFR Sodium cooled Fast Reactor
RTL Ramp Terminal Level
RR Ramp Rate
SS Stainless Steel
TD Theoretical Density
TU TRANSURANUS
U Uranium
UNIPI Università di Pisa
List of figures
Fig. 1 – EBR-II power history. ... 15
Fig. 2 – HEDL P-19, pin power axial profile. ... 16
Fig. 3 – HEDL P-19, rod P-19-2 average and peak axial linear power history. ... 20
Fig. 4 – HEDL P-19, rod P-19-2 average and peak axial bulk coolant temperature history. ... 20
Fig. 5 – HEDL P-19, influence of the relocation model on the final gap size, summary of the results. ... 22
Fig. 6 – HEDL P-19, influence of the relocation model on the final gap size, rods #1, 3. ... 23
Fig. 7 – HEDL P-19, influence of the relocation model on the final gap size, rods #4, 6 ... 23
Fig. 8 – HEDL P-19, influence of the relocation model on the final gap size, rods #9, 10 ... 23
Fig. 9 – HEDL P-19, influence of the relocation model on the final gap size, rods #11, 12 ... 24
Fig. 10 – HEDL P-19, influence of the relocation model on the final gap size, rods #13, 14 ... 24
Fig. 11 – HEDL P-19, influence of the relocation model on the final gap size, rods #15, 16 ... 24
Fig. 12 – HEDL P-19, influence of the relocation model on fuel melting, rods #1, 2. ... 26
Fig. 13 – HEDL P-19, influence of the relocation model on fuel melting, rods #3, 4. ... 27
Fig. 14 – HEDL P-19, influence of the relocation model on fuel melting, rods #5, 6. ... 27
Fig. 15 – HEDL P-19, influence of the relocation model on fuel melting, rods #7, 8. ... 27
Fig. 16 – HEDL P-19, influence of the relocation model on fuel melting, rods #9, 10. ... 28
Fig. 17 – HEDL P-19, influence of the relocation model on fuel melting, rods #11, 12. ... 28
Fig. 18 – HEDL P-19, influence of the relocation model on fuel melting, rods #13, 14. ... 28
Fig. 19 – HEDL P-19, influence of the relocation model on fuel melting, rods #15, 16. ... 29
Fig. A. 1 – HEDL P-19, influence of relocation on gap trend, rods #1, 2. ... 36
Fig. A. 2 – HEDL P-19, influence of relocation on gap trend, rods #3, 4. ... 36
Fig. A. 3 – HEDL P-19, influence of relocation on gap trend, rods #5, 6. ... 36
Fig. A. 4 – HEDL P-19, influence of relocation on gap trend, rods #7, 8. ... 37
Fig. A. 5 – HEDL P-19, influence of relocation on gap trend, rods #9, 10. ... 37
Fig. A. 6 – HEDL P-19, influence of relocation on gap trend, rods #11, 12. ... 37
Fig. A. 7 – HEDL P-19, influence of relocation on gap trend, rods #13, 14. ... 38
Fig. A. 8 – HEDL P-19, influence of relocation on gap trend, rods #15, 16. ... 38
Fig. A. 9 – HEDL P-19, influence of the relocation model on fuel melting, rods #1, 2. ... 39
Fig. A. 10 – HEDL P-19, influence of the relocation model on fuel melting, rods #3, 4. ... 39
Fig. A. 11 – HEDL P-19, influence of the relocation model on fuel melting, rods #5, 6. ... 39
Fig. A. 12 – HEDL P-19, influence of the relocation model on fuel melting, rods #7, 8. ... 40
Fig. A. 13 – HEDL P-19, influence of the relocation model on fuel melting, rods #9, 10. ... 40
Fig. A. 14 – HEDL P-19, influence of the relocation model on fuel melting, rods #11, 12. ... 40
Fig. A. 16 – HEDL P-19, influence of the relocation model on fuel melting, rods #15, 16. ... 41
Fig. B. 1 – HEDL 19, influence of fuel conductivity on fuel temperature in peak axial position, rod P-19-2. ... 44
Fig. B. 2 – HEDL P-19, influence of fuel conductivity on the fuel melting fraction in peak axial section, rod P-19-2. ... 44
Fig. B. 3 – HEDL 19, influence of fuel conductivity on fuel temperature in peak axial position, rod P-19-3R. ... 44
Fig. B. 4 – HEDL P-19, influence of fuel conductivity on the fuel melting fraction in peak axial section, rod P-19-3R. ... 44
Fig. B. 5 – HEDL 19, influence of fuel conductivity on fuel temperature in peak axial position, rod P-19-5. ... 44
Fig. B. 6 – HEDL P-19, influence of fuel conductivity on the fuel melting fraction in peak axial section, rod P-19-5. ... 44
Fig. B. 7 – HEDL 19, influence of fuel conductivity on fuel temperature in peak axial position, rod P-19-6. ... 45
Fig. B. 8 – HEDL P-19, influence of fuel conductivity on the fuel melting fraction in peak axial section, rod P-19-6. ... 45
Fig. B. 9 – HEDL 19, influence of fuel conductivity on fuel temperature in peak axial position, rod P-19-7R. ... 45
Fig. B. 10 – HEDL P-19, influence of fuel conductivity on the fuel melting fraction in peak axial section, rod P-19-7R. ... 45
Fig. B. 11 – HEDL 19, influence of fuel conductivity on fuel temperature in peak axial position, rod P-19-8. ... 45
Fig. B. 12 – HEDL P-19, influence of fuel conductivity on the fuel melting fraction in peak axial section, rod P-19-8. ... 45
Fig. B. 13 – HEDL P-19, influence of fuel conductivity on gap size, rods #1, 3. ... 46
Fig. B. 14 – HEDL P-19, influence of fuel conductivity on gap size, rods #4, 6. ... 46
Fig. B. 15 – HEDL P-19, influence of fuel conductivity on gap size, rods #9, 10. ... 46
Fig. B. 16 – HEDL P-19, influence of fuel conductivity on gap size, rods #11, 14. ... 47
List of tables
Tab. 1 – HEDL P-19 design data. ... 16 Tab. 2 – HEDL P-19, axial extension of fuel melting at the end of the experiment. ... 17 Tab. 3 – HEDL P-19, measurements of central void, columnar grain radius and TD at pellet centre at the
end of the experiment. ... 17 Tab. 4 – HEDL P-19, transversal measurements of central void, molten radius, columnar grain radius
and gap size at the end of the experiment. ... 18 Tab. 5 – HEDL P-19, influence of the relocation model on the final gap size, summary of the results. ... 22 Tab. 6 – HEDL P-19, influence of the fuel conductivity correlations on the axial extend of fuel melting,
1 Introduction
1.1 Background
Wherever uranium fuels are used as a source of power, the management, use and disposal of plutonium and plutonium containing fuel and wastes are intrinsic aspects of the technology. The reactor recycle strategy identifies three main temporal phases[1][2][3].
The first phase has seen a gradual introduction of the recycling of mixed oxide fuel up to an industrial scale in light water reactors in several countries, is currently well established. MOX usage in LWRs is a well understood and mature technology and MOX can be managed in a very similar way to uranium fuel. The current inventory of separated civil plutonium is safely stored and has still to be recycled. The necessary safeguards arrangements have kept pace with these developments wherever plutonium is handled, fabricated, stored, transported and irradiated.
The second phase (up to, say, 2030) is beginning at the time of writing. It is characterized by an ongoing but irregular expansion of MOX recycling in which new countries will acquire MOX technology and additional nuclear plants will be licensed for MOX fuel. It could then be expected that the stockpiles of separated plutonium (both civil and weapons surplus) will begin to diminish and move to significantly lower levels during this phase. As well as extending the number of power plants loading MOX fuel, the technology now needs to be developed for advanced reactors such as the GEN-IV Fast Reactors (i.e. LFR or SFR) or Accelerator Driven Systems (i.e. MHYRRA). Additionally, more environmentally friendly reprocessing methods with reduced emissions will be needed to prepare for the third and long term phase of plutonium recycle and management.
In this preparation for the third phase of development, emphasis must be placed on both achieving greater public acceptance for plutonium fuel technology as well as making the power producing utilities more attractive economically. These same utilities will be the ultimate source of the financing needed to establish the stable development of nuclear power based on uranium and, over the longer term, plutonium fuels. A fuel that is more expensive than others or which may limit reactor operation is unacceptable for the power producers. If the economic and performance targets cannot be reached and negative public attitudes persist, there will be no third phase of plutonium recycle. However, if such a development can be realized, the third phase should see the progressive introduction of advanced thermal reactors as well as fast reactors, alongside new technologies specifically designed for MOX fuel. The aim will be to manage the production and use of plutonium effectively to avoid major stockpiling.
In thermal reactors, it is generally accepted that MOX fuel behaves similar to UOx fuel and should therefore wind stand the same safety requirements. Compared to UOx, MOX fuel mainly differentiates by: lower conductivity, lower melting point, higher creep rate, higher FGR, lower gaseous swelling and production / release of He coming from alpha decay of heavy Minor Actinides[1][2]. In general, these differences depend on the fabrication process and upon the PuO2 content. Since the experimental
databases on MOX fuel are not so extended as for UOx, there is a growing interest in understanding the MOX fuel behavior both for the application in commercial LWR fuels with high burn-ups performance and next generation FRs. In particular, the characterization of MOX fuel for FR application is of great importance to develop advanced fuel design since FR MOX fuel has unique features: it contains larger quantities of PuO2 than LWR, it is operated at higher temperature and in
1.2 Objective of the activity
The capability of the fuel to operate at high power without melting is of interest to FR's because reactor design limits normally require that there be a low probability of fuel melting during steady-state operation including overpower conditions. This requirement has a direct effect on the steady-steady-state power limit of the fuel pin and the reactor.
In particular, due to the high temperature drop achieved in the pellet to cladding gap at beginning of life (BOL), it is necessary to check the power needed to cause fresh fuel melting even for fuels designed to operate at high burn-ups.
The aim of this report is the assessment of TRANSURANUS[4][5][6] code version 2012 in simulating FR-MOX fuel behavior with particular reference to inception of fuel melting during reactor start-up. To fulfill the objective, HEDL P-19[7][8] test has been reconstructed and modeled by means of TU code. The test was conducted in EBR-II during 1971 and investigated the melting propensity of sixteen 25% PuO2 enriched fresh fuel whose design was typical of the Fast Flux Test Facility (FFTF).
2 Description of the experiment and development of the input
decks
2.1 The HEDL-P-19 Experiment
The HEDL P-19[7][8] test was designed to provide "integral" power-to-melt data on 25% PuO2 enriched
fuel. The fuel pin fabrication parameters simulate the FFTF/FBR design conditions[9]. The test was irradiated in row 2, position 2B1 in the EBR-II during reactor run 48E[10]. The positions immediately adjacent to the test were occupied by EBR-II driver fuel assemblies. HEDL P-19 aimed to investigate the effects of initial fuel-to-cladding gap sizes, from 0.043 to 0.127 mm, on the linear-heat-rate needed to cause incipient fuel melting at beginning-of-life.
P-19 was an encapsulated 19-pin subassembly, it consisted of 8 fresh pins with cladding outside diameters 5.84 mm, and 8 fresh 6.35 mm OD pins. The fresh pins were clad with 316 stainless steel (20% cold worked). All pins were backfilled with pure helium during fabrication. The experiment consisted of:
Slow power increase up to selected conditioning level held for 1 hr
Rapid power increase up to a designed power level held for 10 minutes
Reactor scram
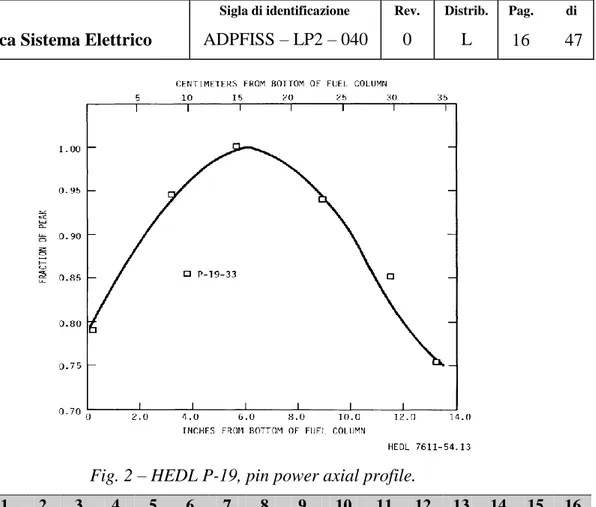
The summary of the design parameters and operating conditions is included in Tab. 1. The EBR-II power history during HEDL-P-19 is given in Fig. 1. Fig. 2 reports the axial power profile of the pins.
Fig. 2 – HEDL P-19, pin power axial profile. Rod N° 1 2 3 4 5 6 7 8 9 10 11 12 13 14 15 16 Rod Id. P 19 2 P 19 3R P 19 5 P 19 6 P 19 7R P 19 8 P 19 13 P 19 20 P 19 24R P 19 25R P 19 26R P 19 27R P 19 28 P 19 30 P 19 33 P 19 35 Gap μm 99 127 72.5 49.5 79 122 99 123 127 101.5 76 51 43 89 62.5 91.5 %TD 90.75 X X X X X X X X 92.40 X X X X X X X X Clad OD mm 5.84 6.35 X X X X X X X X X X X X X X X X Fuel 25% PUO2 - 75% UO2
Cladding 316 stainless steel (20% cold worked)
Filling gas 98% He at 1 bar
O/M 1.96
Active length 343 mm
Na inlet temp. 371 °C
Max LHR kW/m 54.5 64 56.1 56.1 66.6 53.8 54.5 54.1 64.6 66 66.9 66.9 67.9 65.6 55.1 54.1
Tab. 1 – HEDL P-19 design data.
2.1.1 Main achievements from the experiment
After irradiation, the P-19 pins were removed from EBR-II and neutron radio-graphed. This confirmed partial fuel melting in a number of pins. All 5.84 mm OD pins with fuel-to-cladding gaps equal to or less than 0.14 mm had no fuel melting. The remaining 5.84 mm OD pins and all the 6.35 mm OD pins experienced partial fuel melting[7][8].
The capsules were then returned to HEDL where detailed destructive examination was conducted. Transverse fuel ceramographic samples were used to obtain measurements of fuel restructuring zone radii, central void and residual fuel-to-cladding gaps. They were also used to obtain the radial extent of melting at the peak power locations of those pins experiencing partial fuel melting. However, power to-melt data calculated from transversal sections were considered less accurate than those obtained from longitudinal sections because of the uncertain influence of relocated molten fuel on local power. Further, the radial extent of central void formation at these locations is uncertain; melting has obliterated the central void formed by restructuring. Since most of these peak power regions operated at much higher powers than Q'm, melting is extensive even in adjacent fuel. The axial extents of
melting, as determined from longitudinal ceramographic sections, offered the best data for determining Q'm since these sections were actually located where incipient melting occurred and experienced the least power variation due to molten fuel relocation. The main data from PIE are given in Tab. 2, Tab. 3 and Tab. 4. Rod Id Peak Power [kW/m]
EXP Bottom axial Melting extent
EXP Top axial Melting extent Location [cm] Local power [kW/m] Coolant Temp [°C] Location [cm] Local power [kW/m] Coolant Temp [°C] P-19-2 54.5 72.1 51.8 386 248.4 50.5 426 P-19-3R 64.0 8.9 52.5 373 312.9 51.5 451 P-19-5 56.1 -- -- -- -- -- -- P-19-6 56.1 -- -- -- -- -- -- P-19-7R 66.6 40.9 59.1 381 286.3 56.8 448 P-19-8 53.8 63.2 50.9 384 266.2 48.6 429 P-19-13 54.5 84.6 52.8 389 339.0 51.5 424 P-19-20 54.1 98.3 52.5 392 270.3 48.6 431 P-19-24R 64.6 15.0 52.8 374 320.0 49.5 453 P-19-25R 66.0 21.1 55.1 376 305.1 52.8 452 P-19-26R 66.9 46.7 60.4 382 281.3 59.7 445 P-19-27R 66.9 59.2 61.7 386 258.6 60.7 442 P-19-28 67.9 59.7 62.0 386 271.8 59.1 446 P-19-30 65.6 28.2 56.4 378 288.3 56.1 448 P-19-33 55.1 -- -- -- -- -- -- P-19-35 54.1 82.8 52.5 388 224.5 52.5 421
Tab. 2 – HEDL P-19, axial extension of fuel melting at the end of the experiment.
Rod Id
EXP Bottom axial Melting extent
EXP Top axial Melting extent Central void radii [mm] Columnar grain radii [mm] TD at pellet centre [%] Central void radii [mm] Columnar grain radii [mm] TD at pellet centre [%] P-19-2 0.38 1.52 98.0 0.36 1.55 96.4 P-19-3R 0.41 1.85 97.2 0.41 1.85 96.9 P-19-7R 0.38 1.55 98.6 0.38 1.73 97.4 P-19-8 0.41 1.58 98.0 0.43 1.60 98.0 P-19-13 0.38 1.52 98.0 0.36 1.55 98.0 P-19-20 0.41 1.58 97.4 0.43 1.58 97.3 P-19-24R 0.20 1.70 92.9 0.20 1.70 93.1 P-19-25R 0.23 1.73 93.6 0.46 1.80 98.5 P-19-26R 0.38 1.52 98.6 0.43 1.68 98.2 P-19-27R 0.31 1.52 96.1 0.36 1.45 98.4 P-19-28 0.23 1.45 94.5 0.20 1.47 94.5 P-19-30 0.33 1.65 96.0 0.38 1.65 97.9 P-19-35 0.38 1.70 96.0 0.41 1.63 96.6
Tab. 3 – HEDL P-19, measurements of central void, columnar grain radius and TD at pellet centre at the end of the experiment.
Rod Id Id Location [cm] Central void radii [mm] Molten radii [mm] Columnar grain radii [mm] Diametric gap [mm] P-19-2 1 15.5 0.64 0.94 1.80 0.142 2 19.1 0.58 0.79 1.73 0.142 P-19-5 1 15.5 0.46 0.00 1.68 0.102 2 18.5 0.48 0.00 1.65 0.147 3 20.3 0.43 0.00 1.55 0.102 4 21.6 0.46 0.00 1.60 0.122 P-19-6 1 15.5 0.36 0.00 1.58 0.071 2 17.8 0.36 0.00 1.50 0.069 3 18.8 0.38 0.00 1.52 0.091 4 20.1 0.38 0.00 1.58 0.074 5 21.3 0.38 0.00 1.40 0.071 6 22.6 0.33 0.00 1.40 0.084 P-19-8 1 15.5 0.46 0.97 1.85 0.208 P-19-24R 1 15.5 0.18 1.14 2.11 0.107 P-19-25R 1 15.5 0.99 1.21 2.11 0.124 2 18.5 0.79 0.89 2.03 0.104 P-19-26R 1 15.5 0.64 0.71 1.91 0.102 2 18.8 0.69 1.19 2.01 0.079 3 19.8 0.76 0.91 1.93 0.104 4 20.8 0.13 0.76 1.85 0.091 P-19-27R 1 15.5 0.33 1.02 1.85 0.069 2 18.5 0.74 0.84 1.88 0.084 3 20.3 0.51 0.69 1.85 0.071 4 20.8 0.00 0.91 1.85 0.064 5 21.8 0.56 0.74 1.78 0.094 P-19-28 1 15.5 0.00 0.86 1.80 0.086 2 18.5 0.00 0.97 1.85 0.066 3 20.3 0.69 0.91 1.85 0.064 4 20.8 0.56 0.71 1.80 0.071 5 21.8 0.23 0.86 1.85 0.051 P-19-30 1 15.5 0.99 1.32 2.01 0.076 2 17.5 0.94 1.24 2.06 0.076 3 19.3 0.18 1.30 2.08 0.074 P-19-33 1 15.5 0.43 0.00 1.63 0.086 2 17.5 0.43 0.00 1.60 0.127 3 19.3 0.41 0.00 1.65 0.130 4 20.8 0.43 0.00 1.60 0.114 5 22.1 0.36 0.00 1.50 0.112 P-19-35 1 15.5 0.58 0.76 1.75 0.124 2 19.3 0.00 0.79 1.75 0.165 3 20.8 0.20 0.81 1.75 0.150
Tab. 4 – HEDL P-19, transversal measurements of central void, molten radius, columnar grain radius and gap size at the end of the experiment.
2.2 Development and setup of the TRANSURANUS models
2.2.1 Description of the HEDL P-19 input deckThe activity is performed using TRANSURANUS code, version “v1m1j12”, with the deterministic option, steady state thermal and mechanical analysis[4][5][6]. The version of the manual is “v1m1j12”. The boundary conditions are prepared using a program written in PERL language.
Suitable physical models are chosen for the simulation of MOX fuel behavior subjected to power ramp condition. The models selected are generally the ones standard for the transient to be simulated excepts fuel relocation and fuel conductivity that have been subjected to comparative analyses (see section 3). The fuel melting temperature was measured and reported in the database: 2760°C. Accordingly, the standard melting criterion (that depends on PuO2 content, O/M ratio and burn-up), is deactivated and
the exact value is introduced in the source of the code.
Only the active part of the fuel is accounted for the simulation. It has been divided into 17 axial sections that have been obtained from Fig. 2. The nominal design values are used if available (see°Tab. 1). The fuel average grain size and the gas plenum length are not reported in the database, they have been assumed, respectively, 22 μm (average grain diameter) and 300mm (close to the active length).
2.2.2
Selection of the boundary conditions
The boundary conditions implemented for the analysis are:
linear heat rate at 17 axial position,
sodium bulk temperature histories (same position of linear power),
heat transfer coefficient at cladding outer surface (two values are given in the database), and
coolant pressure (0.1 MPa).
The detailed procedure adopted to reconstruct of the power histories is not discussed in this report, for any question on this topic please contact [email protected]. The rate of power increase during the final ramp is not given, it has been fixed at 500 kW/ (m*h), according to typical power ramp tests[11]. The average and axial peak values implemented as boundary conditions for rod P-19-2 are given in Fig. 3 and Fig. 4 as sample.
Fig. 3 – HEDL P-19, rod P-19-2 average and peak axial linear power history.
Fig. 4 – HEDL P-19, rod P-19-2 average and peak axial bulk coolant temperature history.
0 5 10 15 20 25 30 35 40 45 50 55 60 0 2 4 6 8 10 12 14 16 18 20 LHR [kW/ m ] Time [hrs] Avg.LHR Peak LHR 0 50 100 150 200 250 300 350 400 450 500 0 2 4 6 8 10 12 14 16 18 20 So d iu m te m per a tu re [ C] Time [hrs] Peak Cool. T. Avg. Cool. T.
3 Assessment of TU code against HEDL P-19 experiment
The prediction of the fuel melting at beginning of life mainly depends on the correct simulation of the gap width and on the simulation of the fuel temperature radial profile. This analysis is therefore focused on the assessment of the simulation of the gap size and, once the gap is verified to be captured, on the assessment of the fuel conductivity correlations (that directly impact on the fuel temperature)[12].
3.1 Simulation of the gap size: cracking and relocation effects
In this preliminary analysis, the fuel conductivity has been selected according to the original correlation of Wiesenack[13]. Comparative assessment among the fuel conductivity correlation is presented in section 3.2. The choice of the relocation model mainly influences the gap width during the irradiation. In fact, pellet cracking and relocation promotes the movement of pellet fragments toward the cladding. Five different options are available in the code. They have been described in Ref.°[14].
REL0 deactivates the relocation.
The original KWU-LWR model (REL2) accounts for the as fabricated gap, for tangential and axial relocation and it applies also when gap is closed[6].
The GAPCON-THERMAL-3 (REL3) accounts for the tangential strain due to relocation depending on the as fabricated gap, the burn-up (exponential function that saturates at 5MWd/kgU), the linear heat rate (a simple function). It does not consider the axial strain and it applies also when gap is closed[6].
The modified KWU-LWR (REL5) accounts for the tangential and axial strain due to relocation depending only on the as fabricated gap. It applies also when gap is closed[6].
The modified FRAPCON-3 (REL8) is the standard relocation model. It accounts only for the tangential strain due to relocation depending on the as fabricated gap, the burn-up, the linear heat rate. It does not apply when gap is closed[6]
The gap size is measured at one or more axial elevations at the end of the test, the main results are summarized in Tab. 5 and Fig. 5. The table contains the maximum measured and predicted ranges while the figure highlights all the experimental data.
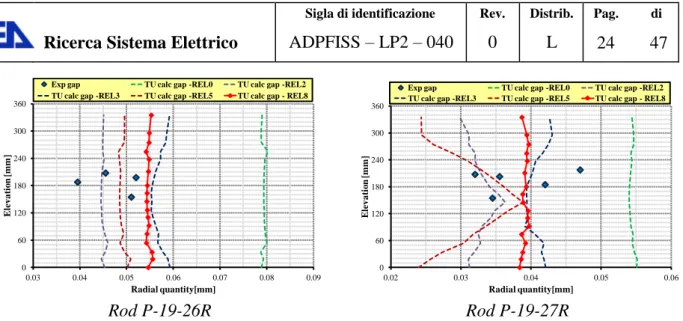
The experimental and predicted gap trends at the end of the test as function of the axial elevation are presented in detail for each rod from Fig. 6 to Fig. 11. Appendix A includes: the gap trend in the peak axial position as function of time (from Fig. A. 1 to Fig. A. 8), and the effect relocation on the axial extension of fuel melting (from Fig. A. 9 to Fig. A. 16). This last datum is not discussed with detail since it is considered in the assessment of fuel conductivity (section 3.2).
Deactivating the relocation model (REL0), due to the densification effects, the gap is overestimated and predicted to increase compared to its initial size (see Tab. 5 and Fig. A. 1 as sample). This causes high temperature drop in the gap region and, consequently, increases the melting propensity (see from Fig. A. 9 to Fig. A. 16). Opposite considerations apply to REL2 that tends to under predict the gap width excepts for rods P-19-24R, P-19-25-R and P-19-30, Fig. 5. REL3, REL5 and REL8 are, with same exceptions probably connected with relocation of melted fuel, generally in agreement with the experiment being the standard model REL8 those that fits the experimental trend in the best manner. Excepts REL0, gap closure during the test occurs in any simulation of rods P-19-27R and P-19-28
(Fig. A. 6 and Fig. A. 7). REL 2 and REL5 predict further gap closure in rods P-19-6 and P19-26R (Fig. A. 2 and Fig. A. 6). P-19-7R experiences gap closure in REL2 (Fig. A. 3).
N° Rod Id Initial gap [μm] EXP gap [μm] REL0 gap [μm] REL2 gap [μm]] REL3 gap [μm] REL5 gap [μm]] REL8 gap [μm]] 1 P-19-2 99 71 102-104 58-59 75-79 72-74 70-72 3 P-19-5 72.5 51-73 76-77 44-45 56-59 46-48 53-54 4 P-19-6 49.5 34-45 53-55 29-32 41-42 22-26 38-40 6 P-19-8 122 104 126-127 70-71 91-97 89-90 86-88 9 P-19-24R 127 54 130-131 70-72 91-98 91-92 88-90 10 P-19-25R 101.5 52-62 104-105 58-59 74-79 73-74 71-72 11 P-19-26R 76 40-52 79-80 44-46 55-59 48-50 54-55 12 P-19-27R 51 32-47 54-55 30-36 39-43 24-39 38-40 13 P-19-28 43 26-43 46-48 28-38 34-36 21-39 33-37 14 P-19-30 89 37-38 92-93 52-53 64-70 62-63 63-64 15 P-19-33 62.5 43-69 67-68 39-40 50-51 37-38 47-48 16 P-19-35 91.5 62-82 95-97 54-56 70-73 65-67 65-67
Tab. 5 – HEDL P-19, influence of the relocation model on the final gap size, summary of the results.
Fig. 5 – HEDL P-19, influence of the relocation model on the final gap size, summary of the results.
0 0.01 0.02 0.03 0.04 0.05 0.06 0.07 0.08 0.09 0.1 0.11 0.12 0.13 0.14 0 2 4 6 8 10 12 14 16 18 20 22 24 26 Ga p si ze[m m ]
EXP gap TU calc gap -REL0 TU calc gap -REL2 TU calc gap -REL3 TU calc gap -REL5 TU calc gap -REL8
P -19 -2 P -19 -5 P -19 -6 P -19 -8 P -19 -24R P -19 -25R P -19 -26R P -19 -27R P -19 -28 P -19 -30 P -19 -33 P -19 -35
Rod P-19-2 Rod P-19-5
Fig. 6 – HEDL P-19, influence of the relocation model on the final gap size, rods #1, 3.
Rod P-19-6 Rod P-19-8
Fig. 7 – HEDL P-19, influence of the relocation model on the final gap size, rods #4, 6
Rod P-19-24R Rod P-19-25R
Fig. 8 – HEDL P-19, influence of the relocation model on the final gap size, rods #9, 10
0 60 120 180 240 300 360 0.05 0.055 0.06 0.065 0.07 0.075 0.08 0.085 0.09 0.095 0.1 0.105 0.11 El ev a ti o n [m m ] Radial quantity[mm]
Exp gap TU calc gap -REL0 TU calc gap -REL2 TU calc gap -REL3 TU calc gap -REL5 TU calc gap - REL8
0 60 120 180 240 300 360 0.03 0.04 0.05 0.06 0.07 0.08 0.09 El ev a ti o n [m m ] Radial quantity[mm]
Exp gap TU calc gap -REL0 TU calc gap -REL2 TU calc gap -REL3 TU calc gap -REL5 TU calc gap - REL8
0 60 120 180 240 300 360 0.02 0.025 0.03 0.035 0.04 0.045 0.05 0.055 0.06 El ev a ti o n [m m ] Radial quantity[mm]
Exp gap TU calc gap -REL0 TU calc gap -REL2 TU calc gap -REL3 TU calc gap -REL5 TU calc gap - REL8
0 60 120 180 240 300 360 0.06 0.07 0.08 0.09 0.1 0.11 0.12 0.13 El ev a ti o n [m m ] Radial quantity[mm]
Exp gap TU calc gap -REL0 TU calc gap -REL2 TU calc gap -REL3 TU calc gap -REL5 TU calc gap - REL8
0 60 120 180 240 300 360 0.05 0.06 0.07 0.08 0.09 0.1 0.11 0.12 0.13 0.14 El ev a ti o n [m m ] Radial quantity[mm]
Exp gap TU calc gap -REL0 TU calc gap -REL2 TU calc gap -REL3 TU calc gap -REL5 TU calc gap - REL8
0 60 120 180 240 300 360 0.05 0.06 0.07 0.08 0.09 0.1 0.11 El ev a ti o n [m m ] Radial quantity[mm]
Exp gap TU calc gap -REL0 TU calc gap -REL2 TU calc gap -REL3 TU calc gap -REL5 TU calc gap - REL8
Rod P-19-26R Rod P-19-27R
Fig. 9 – HEDL P-19, influence of the relocation model on the final gap size, rods #11, 12
Rod P-19-28 Rod P-19-30
Fig. 10 – HEDL P-19, influence of the relocation model on the final gap size, rods #13, 14
Rod P-19-33 Rod P-19-35
Fig. 11 – HEDL P-19, influence of the relocation model on the final gap size, rods #15, 16
0 60 120 180 240 300 360 0.03 0.04 0.05 0.06 0.07 0.08 0.09 El ev a ti o n [m m ] Radial quantity[mm]
Exp gap TU calc gap -REL0 TU calc gap -REL2 TU calc gap -REL3 TU calc gap -REL5 TU calc gap - REL8
0 60 120 180 240 300 360 0.02 0.03 0.04 0.05 0.06 El ev a ti o n [m m ] Radial quantity[mm]
Exp gap TU calc gap -REL0 TU calc gap -REL2 TU calc gap -REL3 TU calc gap -REL5 TU calc gap - REL8
0 60 120 180 240 300 360 0.01 0.02 0.03 0.04 0.05 0.06 El ev a ti o n [m m ] Radial quantity[mm]
Exp gap TU calc gap -REL0 TU calc gap -REL2 TU calc gap -REL3 TU calc gap -REL5 TU calc gap - REL8
0 60 120 180 240 300 360 0.03 0.04 0.05 0.06 0.07 0.08 0.09 0.1 El ev a ti o n [m m ] Radial quantity[mm]
Exp gap TU calc gap -REL0 TU calc gap -REL2 TU calc gap -REL3 TU calc gap -REL5 TU calc gap - REL8
0 60 120 180 240 300 360 0.03 0.04 0.05 0.06 0.07 0.08 El ev a ti o n [m m ] Radial quantity[mm]
Exp gap TU calc gap -REL0 TU calc gap -REL2 TU calc gap -REL3 TU calc gap -REL5 TU calc gap - REL8
0 60 120 180 240 300 360 0.04 0.05 0.06 0.07 0.08 0.09 0.1 El ev a ti o n [m m ] Radial quantity[mm]
Exp gap TU calc gap -REL0 TU calc gap -REL2 TU calc gap -REL3 TU calc gap -REL5 TU calc gap - REL8
3.2 Simulation of fuel temperature profile: fuel conductivity effects
This analysis is conducted assuming the standard relocation model, REL8. Five different correlations are available in the code to treat MOX conductivity. They have been described in Ref.°[14].
CND1 is according to the correlation of Philipponneau[15]. It accounts for the local temperature, the local burn-up, the local porosity and O/M.
CND31 is the TU standard MOX correlation fitted to ITU data[16]. It accounts for the influence of the local temperature, the local burn-up, and the local porosity.
CND32 is the original MOX correlation of Carbajo et al[17]. It accounts for the local temperature, the local burn-up, the local porosity, the O/M, the dissolved and precipitated FPs and the radiation effects.
CND33 is the original MOX correlation of Lanning and Beyer[18]. It accounts for the local temperature, the local burn-up, the local porosity and the O/M.
CND34 is the original correlation of Wiesenack[13]. It is derived from the UO2 correlation
reduced by a constant factor of 0.92.
It should be mentioned that, even if these correlations are recommended for both LWR and FBR MOX, they have been mainly tested on LWR MOX fuel which is operated at lower temperature and contains less PuO2 than FBR fuel. Therefore, discrepancies are expected and may be related to
uncertainty of the correlations in the high temperature zone (particularly beyond 2200°C that is always exceeded in the experiment) or to the effect of the high PuO2 content (which is not directly considered
in any correlation).
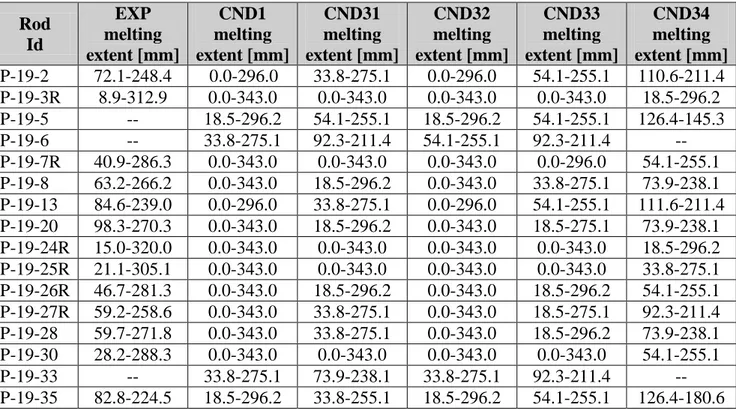
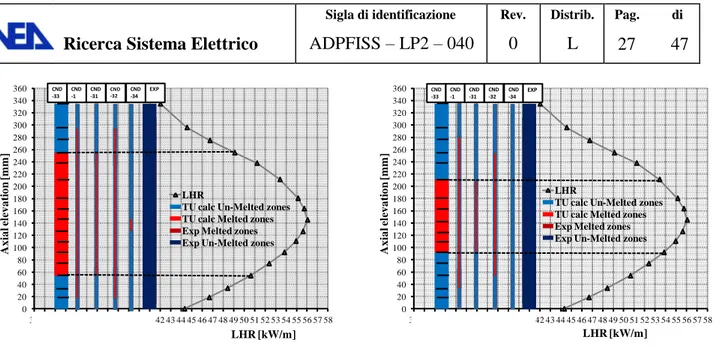
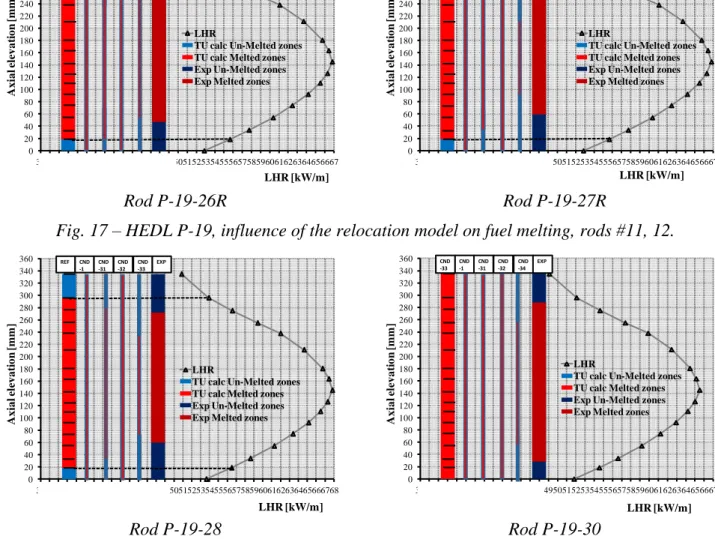
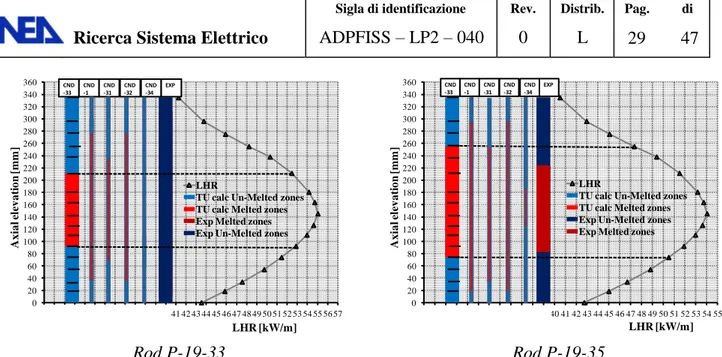
The main results are summarized in Tab. 6. The axial extension of melting is analyzed for each rod from Fig. 12 to Fig. 19. The time dependent fuel centreline temperature and the fraction of molten fuel in the peak axial section is reported for the first six rods in detail in Appendix B from Fig. B. 1 to Fig. B. 12. The influence of the conductivity correlations on the final gap size is depicted in Appendix B from Fig. B. 13 to Fig. B. 17.
Rod P-19-2 and rod P-19-6 are analyzed in Fig. 12, Fig. 13, and Fig. B. 1, Fig. B. 2, Fig. B. 7, Fig. B. 8 Fig. B. 13 and Fig. B. 14 as samples. The first rod had a fabricated gap of 99μm a pellet density of 90.75%TD and a cladding outer diameter of 5.84mm (see Tab. 1). It was ramped up to 54.5 kW/m and experienced melting at its radial centre for about 180mm along its axial elevation, Fig. 12. The correlations provide different extensions of the axial melting front. In particular, CND1, CND31, CND32 and CND33 over predict this phenomenon being CND33 more close to the experiment. CND34 (that has been obtained from a correlation developed for UO2) under-predicts the axial melting
front. These considerations generally apply to the rods that experience fuel melting in the experiment, Tab. 6.
Rod P-19-6 had a fabricated gap of 49.5μm a pellet density of 90.75%TD and a cladding outer diameter of 5.84mm (see Tab. 1). It was ramped up to 56.1 kW/m and did not experience melting, Fig. 13. Only correlation CND34 agrees with the experiment while the remaining correlation are conservative and predict fuel melting. Again, these considerations can be extended to the rods that did not melt in the experiment (P-19-5, P-19-6, P19-33), Tab. 6.
The conductivity correlation has a minor influence on the gap size at the end of the test, see Appendix B from Fig. B. 13 to Fig. B. 17 (this justify the independent assessment of the relocation models).
The fuel centreline temperature in peak axial position may exceed 3500°C depending on the correlation adopted being their difference up to few hundreds °C. Consistently, the fraction of molten fuel in the peak axial section may overpass 30% (see Appendix B from Fig. B. 1 to Fig. B. 12).
Rod Id EXP melting extent [mm] CND1 melting extent [mm] CND31 melting extent [mm] CND32 melting extent [mm] CND33 melting extent [mm] CND34 melting extent [mm] P-19-2 72.1-248.4 0.0-296.0 33.8-275.1 0.0-296.0 54.1-255.1 110.6-211.4 P-19-3R 8.9-312.9 0.0-343.0 0.0-343.0 0.0-343.0 0.0-343.0 18.5-296.2 P-19-5 -- 18.5-296.2 54.1-255.1 18.5-296.2 54.1-255.1 126.4-145.3 P-19-6 -- 33.8-275.1 92.3-211.4 54.1-255.1 92.3-211.4 -- P-19-7R 40.9-286.3 0.0-343.0 0.0-343.0 0.0-343.0 0.0-296.0 54.1-255.1 P-19-8 63.2-266.2 0.0-343.0 18.5-296.2 0.0-343.0 33.8-275.1 73.9-238.1 P-19-13 84.6-239.0 0.0-296.0 33.8-275.1 0.0-296.0 54.1-255.1 111.6-211.4 P-19-20 98.3-270.3 0.0-343.0 18.5-296.2 0.0-343.0 18.5-275.1 73.9-238.1 P-19-24R 15.0-320.0 0.0-343.0 0.0-343.0 0.0-343.0 0.0-343.0 18.5-296.2 P-19-25R 21.1-305.1 0.0-343.0 0.0-343.0 0.0-343.0 0.0-343.0 33.8-275.1 P-19-26R 46.7-281.3 0.0-343.0 18.5-296.2 0.0-343.0 18.5-296.2 54.1-255.1 P-19-27R 59.2-258.6 0.0-343.0 33.8-275.1 0.0-343.0 18.5-275.1 92.3-211.4 P-19-28 59.7-271.8 0.0-343.0 33.8-275.1 0.0-343.0 18.5-296.2 73.9-238.1 P-19-30 28.2-288.3 0.0-343.0 0.0-343.0 0.0-343.0 0.0-343.0 54.1-255.1 P-19-33 -- 33.8-275.1 73.9-238.1 33.8-275.1 92.3-211.4 -- P-19-35 82.8-224.5 18.5-296.2 33.8-255.1 18.5-296.2 54.1-255.1 126.4-180.6 Tab. 6 – HEDL P-19, influence of the fuel conductivity correlations on the axial extend of fuel melting,
summary of the results.
Rod P-19-2 Rod P-19-3R
Fig. 12 – HEDL P-19, influence of the relocation model on fuel melting, rods #1, 2.
0 20 40 60 80 100 120 140 160 180 200 220 240 260 280 300 320 340 360 28 29 30 31 32 33 34 35 36 37 38 39 40 41 42 43 44 45 46 47 48 49 50 51 52 53 54 55 A x ia l el ev a ti o n [m m ] LHR [kW/m] LHR
TU calc Un-Melted zones TU calc Melted zones Exp Un-Melted zones
CND -1 CND -31 CND -32 CND -34 EXP CND -33 0 20 40 60 80 100 120 140 160 180 200 220 240 260 280 300 320 340 360 3536373839404142434445464748495051525354555657585960616263646566 A x ia l el ev a ti o n [m m ] LHR [kW/m] LHR
TU calc Un-Melted zones TU calc Melted zones Exp Un-Melted zones Exp Melted zones
CND -33 CND -1 CND -31 CND -32 CND -34 EXP
Rod P-19-5 Rod P-19-6
Fig. 13 – HEDL P-19, influence of the relocation model on fuel melting, rods #3, 4.
Rod P-19-7R Rod P-19-8
Fig. 14 – HEDL P-19, influence of the relocation model on fuel melting, rods #5, 6.
Rod P-19-13 Rod P-19-20
Fig. 15 – HEDL P-19, influence of the relocation model on fuel melting, rods #7, 8.
0 20 40 60 80 100 120 140 160 180 200 220 240 260 280 300 320 340 360 30 31 32 33 34 35 36 37 38 39 40 41 42 43 44 45 46 47 48 49 50 51 52 53 54 55 56 57 58 A x ia l el ev a ti o n [m m ] LHR [kW/m] LHR
TU calc Un-Melted zones TU calc Melted zones Exp Melted zones Exp Un-Melted zones
CND -33 CND -1 CND -31 CND -32 CND -34 EXP 0 20 40 60 80 100 120 140 160 180 200 220 240 260 280 300 320 340 360 30 31 32 33 34 35 36 37 38 39 40 41 42 43 44 45 46 47 48 49 50 51 52 53 54 55 56 57 58 A x ia l el ev a ti o n [m m ] LHR [kW/m] LHR
TU calc Un-Melted zones TU calc Melted zones Exp Melted zones Exp Un-Melted zones
CND -33 CND -1 CND -31 CND -32 CND -34 EXP 0 20 40 60 80 100 120 140 160 180 200 220 240 260 280 300 320 340 360 353637383940414243444546474849505152535455565758596061626364656667 A x ia l el ev a ti o n [m m ] LHR [kW/m] LHR
TU calc Un-Melted zones TU calc Melted zones Exp Un-Melted zones Exp Melted zones
CND -33 CND -1 CND -31 CND -32 CND -34 EXP 0 20 40 60 80 100 120 140 160 180 200 220 240 260 280 300 320 340 360 28 29 30 31 32 33 34 35 36 37 38 39 40 41 42 43 44 45 46 47 48 49 50 51 52 53 54 55 A x ia l el ev a ti o n [m m ] LHR [kW/m] LHR
TU calc Un-Melted zones TU calc Melted zones Exp Un-Melted zones Exp Melted zones
CND -33 CND -1 CND -31 CND -32 CND -34 EXP
Rod P-19-24R Rod P-19-25R
Fig. 16 – HEDL P-19, influence of the relocation model on fuel melting, rods #9, 10.
Rod P-19-26R Rod P-19-27R
Fig. 17 – HEDL P-19, influence of the relocation model on fuel melting, rods #11, 12.
Rod P-19-28 Rod P-19-30
Fig. 18 – HEDL P-19, influence of the relocation model on fuel melting, rods #13, 14.
0 20 40 60 80 100 120 140 160 180 200 220 240 260 280 300 320 340 360 3334353637383940414243444546474849505152535455565758596061626364656667 A x ia l el ev a ti o n [m m ] LHR [kW/m] LHR
TU calc Un-Melted zones TU calc Melted zones Exp Un-Melted zones Exp Melted zones
CND -33 CND -1 CND -31 CND -32 CND -34 EXP 0 20 40 60 80 100 120 140 160 180 200 220 240 260 280 300 320 340 360 353637383940414243444546474849505152535455565758596061626364656667 A x ia l el ev a ti o n [m m ] LHR [kW/m] LHR
TU calc Un-Melted zones TU calc Melted zones Exp Un-Melted zones Exp Melted zones
CND -33 CND -1 CND -31 CND -32 CND -34 EXP 0 20 40 60 80 100 120 140 160 180 200 220 240 260 280 300 320 340 360 35363738394041424344454647484950515253545556575859606162636465666768 A x ia l el ev a ti o n [m m ] LHR [kW/m] LHR
TU calc Un-Melted zones TU calc Melted zones Exp Un-Melted zones Exp Melted zones
REF CND -1 CND -31 CND -32 CND -33 EXP 0 20 40 60 80 100 120 140 160 180 200 220 240 260 280 300 320 340 360 353637383940414243444546474849505152535455565758596061626364656667 A x ia l el ev a ti o n [m m ] LHR [kW/m] LHR
TU calc Un-Melted zones TU calc Melted zones Exp Un-Melted zones Exp Melted zones
CND -33 CND -1 CND -31 CND -32 CND -34 EXP
Rod P-19-33 Rod P-19-35
Fig. 19 – HEDL P-19, influence of the relocation model on fuel melting, rods #15, 16.
0 20 40 60 80 100 120 140 160 180 200 220 240 260 280 300 320 340 360 28 29 30 31 32 33 34 35 36 37 38 39 40 41 42 43 44 45 46 47 48 49 50 51 52 53 54 55 56 57 A x ia l el ev a ti o n [m m ] LHR [kW/m] LHR
TU calc Un-Melted zones TU calc Melted zones Exp Melted zones Exp Un-Melted zones
CND -33 CND -1 CND -31 CND -32 CND -34 EXP 0 20 40 60 80 100 120 140 160 180 200 220 240 260 280 300 320 340 360 28 29 30 31 32 33 34 35 36 37 38 39 40 41 42 43 44 45 46 47 48 49 50 51 52 53 54 55 A x ia l el ev a ti o n [m m ] LHR [kW/m] LHR
TU calc Un-Melted zones TU calc Melted zones Exp Un-Melted zones Exp Melted zones
CND -33 CND -1 CND -31 CND -32 CND -34 EXP
4 Conclusions
The capabilities of TRANSURANUS code in simulating the inception of MOX fuel melting have been assessed against HEDL P-19 experiment. It includes 16 fresh 25% PuO2 enriched FBR rods irradiated
in EBR-II to investigate the effects of initial fuel-to-cladding gap sizes, from 0.043 to 0.127 mm, on the linear-heat-rate needed to cause incipient fuel melting at beginning-of-life. The results achieved from the simulations bring to the conclusions hereafter summarized:
The correct simulation of the gap status at the end of the experiment mainly depends on the selection of the relocation model and it is crucial to assess the fuel temperature profile. Five different options have been checked: the standard relocation (modified FRAPCON-3 model) is found to fit the experimental trend generally with minor deviations.
The fuel conductivity correlations directly impact on the fuel temperature. Five options have been tested. Four correlations over predict the axial extension of fuel melting being therefore conservative. Among them, those of Lanning and Beyer is more close to the experiment. The correlation according to Wiesenack was developed from UOX fuel and generally under-predicts
the axial extension of fuel melting. However, it is the only one that simulates correctly the un-melted rods.
It should be underlined that conductivity correlations have been mainly tested on LWR MOX fuel which is operated at lower temperature and contains less PuO2 than FBR fuel. Therefore,
discrepancies may be related to uncertainty of the correlations in the high temperature zone (particularly beyond 2200°C that is always exceeded in the experiment) or to the effect of high PuO2 content (which is not directly considered in any correlation).
Future developments:
Modeling of densification and restructuring and assessment of design tolerances such as O/M ratio, gap initial size and pellet density is not considered in this report. However, they are expected to impact on the results and deserve further investigations.
Central void, density at pellet center and radial extension of restructuring were measured and should be therefore compared with the simulations.
This analysis could in principle be applied to validate models and correlations for the application to overpower transient at BOL in new generation FR whose fuel is similar to those tested in HEDL-P-19 (i.e. MHYRRA, ASTRID).
REFERENCES
[1] Carbajo J.J., et al. A review of thermo-physical properties of MOX and UO2 fuel. Oak
Ridge National Laboratory, ORNL/TM/351, 2000.
[2] Massih A.R., Models for MOX fuel behavior, a selective review. SKI Report 2006,10, January 2006.
[3] IAEA, Status and Advances in MOX Fuel Technology. technical report number 415, Vienna 2003.
[4] Lassmann K., TRANSURANUS: a fuel rod analysis code ready for use. Journal of Nuclear Material 188 (1992) 295-302.
[5] Van Uffelen P., Modeling of Nuclear Fuel Behavior, Publications Office. JRC Publications, Report EUR 22321 EN, European Commission, 2006.
[6] Lassmann K., Schubert A., Van Uffelen P., Gyory Cs., van de Laar J., Transuranus
Handbook Version “v1m1j06”. EC, JRC, ITU, July 2012.
[7] Baker R.B., Integral heat rate to incipient melting in UO2-PUO2 FR fuel. Hanford
Engineering Development Laboratory, HEDL-TME 77-23UC-79b, 1978 U.S.
[8] Baker R.B., Calibration of a fuel to cladding gap conductance model for fast reactor fuel
pins. Hanford Engineering Development Laboratory, HEDL-TME 77-86 UC-79, 1978 U.S.
[9] Ethridge J.L., et al. Fast Flux Test Facility Core System. WHC-SA—0981 DE91 004559 Annerican Nuclear Society Winter Meeting Washington, D. C. November 11-15,1990.
[10] Miller L.B., Golden G.H., Jarka R.E., Phillips K.E., Characterization of the Power in an
Experimental Irradiation Subassembly of Mixed-Oxide in EBR-II. ANL/EBR-I1-047,
Argonne National Laboratory, Argonne, IL/Idaho Falls, Idaho, September 1971.
[11] Djurle S., et al., The Super-Ramp Project, Final report of the Super-Ramp project. STIR-32, Studsvik AB Atomenergi, Studsvik, Sweden ,1984.
[12] Rozzia D., Del Nevo A., Ardizzone A., Tarantno M., Agostini P., Capabilities of
TRANSURANUS Code in Simulating Inception of Melting in FBR MOX Fuel. In Proc.
of NENE-2013, paper n° 609 Bled, Slovenia, 2013 September 9-12.
[13] Wiesenack W., Assessment of UO2 Conductivity Degradation Based on In-pile
Temperature Data. Proceedings of the 1997 International Topical Meeting on LWR Fuel
Performance, Portland, Oregon, March 2-6 (1997), p. 507.
[14] Rozzia D., Forgione N., Ardizzone A., Analysis and Validation of FGR in MOX fuel at
High Burn-ups. ADP-PAR-2012 LP2 Task A3 deliverable LP2.a.3_b, July 2013.
[15] Philipponneau Y., Thermal conductivity of (U, Pu) O2-x mixed oxide fuel. Journal of
Nuclear Materials 188 (1992) 194-197.
[16] Schubert A., et al., Present Status of the MOX Version of the TU Code. EHPG Meeting on High Burn-up Fuel Performance, Sandefjord, Norway, 9-14 May 2004
[17] Carbajo J.J., Yoder G.L., Popov S.G., Ivanov V.K., A review of the thermo-physical
properties of MOX and UO2 fuels. Journal of Nuclear Materials 299 (2001) 181-198
[18] Lanning D.D., Beyer C.E., Proposed FRAPCON-3 MOX fuel thermal conductivity model
compared to Halden fuel temperature data. EHPG Meeting on High Burn-up Fuel
A.1 Assessment of the impact of relocation models on gap size
Rod P-19-2 Rod P-19-3R
Fig. A. 1 – HEDL P-19, influence of relocation on gap trend, rods #1, 2.
Rod P-19-5 Rod P-19-6
Fig. A. 2 – HEDL P-19, influence of relocation on gap trend, rods #3, 4.
Rod P-19-7R Rod P-19-8
Fig. A. 3 – HEDL P-19, influence of relocation on gap trend, rods #5, 6.
0 10 20 30 40 50 60 70 80 90 100 110 120 0 1 2 3 4 5 6 7 8 9 10 11 12 13 14 15 Ga p w idth [μ m] Time [hrs]
Gap in peak axial position - REL8 Gap in peak axial position - REL0 Gap in peak axial position - REL2 Gap in peak axial position - REL3 Gap in peak axial position - REL5 EXP gap
0 10 20 30 40 50 60 70 80 90 100 110 120 130 140 150 0 1 2 3 4 5 6 7 8 9 10 11 12 13 14 15 Ga p w idth [μ m] Time [hrs]
Gap in peak axial position - REL8 Gap in peak axial position - REL0 Gap in peak axial position - REL2 Gap in peak axial position - REL3 Gap in peak axial position - REL5 EXP gap
0 10 20 30 40 50 60 70 80 90 0 1 2 3 4 5 6 7 8 9 10 11 12 13 14 15 Ga p w idth [μ m] Time [hrs]
Gap in peak axial position - REL8 Gap in peak axial position - REL0 Gap in peak axial position - REL2 Gap in peak axial position - REL3 Gap in peak axial position - REL5 EXP gap
0 10 20 30 40 50 60 70 0 1 2 3 4 5 6 7 8 9 10 11 12 13 14 15 Ga p w idth [μ m] Time [hrs]
Gap in peak axial position - REL8 Gap in peak axial position - REL0 Gap in peak axial position - REL2 Gap in peak axial position - REL3 Gap in peak axial position - REL5 EXP gap
0 10 20 30 40 50 60 70 80 90 100 0 1 2 3 4 5 6 7 8 9 10 11 12 13 14 15 Ga p w idth [μ m] Time [hrs]
Gap in peak axial position - REL8 Gap in peak axial position - REL0 Gap in peak axial position - REL2 Gap in peak axial position - REL3 Gap in peak axial position - REL5 EXP gap
0 10 20 30 40 50 60 70 80 90 100 110 120 130 140 150 0 1 2 3 4 5 6 7 8 9 10 11 12 13 14 15 Ga p w idth [μ m] Time [hrs]
Gap in peak axial position - REL8 Gap in peak axial position - REL0 Gap in peak axial position - REL2 Gap in peak axial position - REL3 Gap in peak axial position - REL5 EXP gap
Rod P-19-13 Rod P-19-20 Fig. A. 4 – HEDL P-19, influence of relocation on gap trend, rods #7, 8.
Rod P-19-24R Rod P-19-25R
Fig. A. 5 – HEDL P-19, influence of relocation on gap trend, rods #9, 10.
Rod P-19-26R Rod P-19-27R
Fig. A. 6 – HEDL P-19, influence of relocation on gap trend, rods #11, 12.
0 10 20 30 40 50 60 70 80 90 100 110 120 0 1 2 3 4 5 6 7 8 9 10 11 12 13 14 15 Ga p w idth [μ m] Time [hrs]
Gap in peak axial position - REL8 Gap in peak axial position - REL0 Gap in peak axial position - REL2 Gap in peak axial position - REL3 Gap in peak axial position - REL5 EXP gap
0 10 20 30 40 50 60 70 80 90 100 110 120 130 140 150 0 1 2 3 4 5 6 7 8 9 10 11 12 13 14 15 Ga p w idth [μ m] Time [hrs]
Gap in peak axial position - REL8 Gap in peak axial position - REL0 Gap in peak axial position - REL2 Gap in peak axial position - REL3 Gap in peak axial position - REL5 EXP gap
0 10 20 30 40 50 60 70 80 90 100 110 120 130 140 150 0 1 2 3 4 5 6 7 8 9 10 11 12 13 14 15 Ga p w idth [μ m] Time [hrs]
Gap in peak axial position - REL8 Gap in peak axial position - REL0 Gap in peak axial position - REL2 Gap in peak axial position - REL3 Gap in peak axial position - REL5 EXP gap
0 10 20 30 40 50 60 70 80 90 100 110 120 0 1 2 3 4 5 6 7 8 9 10 11 12 13 14 15 Ga p w idth [μ m] Time [hrs]
Gap in peak axial position - REL8 Gap in peak axial position - REL0 Gap in peak axial position - REL2 Gap in peak axial position - REL3 Gap in peak axial position - REL5 EXP gap
0 10 20 30 40 50 60 70 80 90 100 0 1 2 3 4 5 6 7 8 9 10 11 12 13 14 15 Ga p w idth [μ m] Time [hrs]
Gap in peak axial position - REL8 Gap in peak axial position - REL0 Gap in peak axial position - REL2 Gap in peak axial position - REL3 Gap in peak axial position - REL5 EXP gap
0 10 20 30 40 50 60 70 0 1 2 3 4 5 6 7 8 9 10 11 12 13 14 15 Ga p w idth [μ m] Time [hrs]
Gap in peak axial position - REL8 Gap in peak axial position - REL0 Gap in peak axial position - REL2 Gap in peak axial position - REL3 Gap in peak axial position - REL5 EXP gap
Rod P-19-28 Rod P-19-30 Fig. A. 7 – HEDL P-19, influence of relocation on gap trend, rods #13, 14.
Rod P-19-33 Rod P-19-35
Fig. A. 8 – HEDL P-19, influence of relocation on gap trend, rods #15, 16.
0 10 20 30 40 50 60 0 1 2 3 4 5 6 7 8 9 10 11 12 13 14 15 Ga p w idth [μ m] Time [hrs]
Gap in peak axial position - REL8 Gap in peak axial position - REL0 Gap in peak axial position - REL2 Gap in peak axial position - REL3 Gap in peak axial position - REL5 EXP gap
0 10 20 30 40 50 60 70 80 90 100 110 0 1 2 3 4 5 6 7 8 9 10 11 12 13 14 15 Ga p w idth [μ m] Time [hrs]
Gap in peak axial position - REL8 Gap in peak axial position - REL0 Gap in peak axial position - REL2 Gap in peak axial position - REL3 Gap in peak axial position - REL5 EXP gap
0 10 20 30 40 50 60 70 80 0 1 2 3 4 5 6 7 8 9 10 11 12 13 14 15 Ga p w idth [μ m] Time [hrs]
Gap in peak axial position - REL8 Gap in peak axial position - REL0 Gap in peak axial position - REL2 Gap in peak axial position - REL3 Gap in peak axial position - REL5 EXP gap
0 10 20 30 40 50 60 70 80 90 100 110 0 1 2 3 4 5 6 7 8 9 10 11 12 13 14 15 Ga p w idth [μ m] Time [hrs]
Gap in peak axial position - REL8 Gap in peak axial position - REL0 Gap in peak axial position - REL2 Gap in peak axial position - REL3 Gap in peak axial position - REL5 EXP gap