Research Article
A Simple Blood Test, Such as Complete Blood Count, Can
Predict Calcification Grade of Abdominal Aortic Aneurysm
Marika Vezzoli,
1Stefano Bonardelli,
2,3Michele Peroni,
2,3Marco Ravanelli,
3,4and Emirena Garrafa
1,41Department of Molecular and Translational Medicine, University of Brescia, Viale Europa 11, 25123 Brescia, Italy
2Department of Surgery, University of Brescia, Piazzale Spedali Civili 1, 25123 Brescia, Italy
3ASST Spedali Civili di Brescia, Brescia, Italy
4Department of Radiology, University of Brescia, Piazzale Spedali Civili 1, 25123 Brescia, Italy
Correspondence should be addressed to Emirena Garrafa; [email protected] Received 15 June 2017; Accepted 16 July 2017; Published 30 August 2017
Academic Editor: Gianluca Buffone
Copyright © 2017 Marika Vezzoli et al. This is an open access article distributed under the Creative Commons Attribution License, which permits unrestricted use, distribution, and reproduction in any medium, provided the original work is properly cited. Objective. The pathogenesis of abdominal aortic aneurysm (AAA) is complex and different factors, including calcification, are linked to increased complications. This study was conducted in order to verify if classical risk factors for AAA and cell blood count parameter could help in the identification of calcification progression of the aneurysm. Design. Risk factors were collected and cell blood count was performed in patients with AAA and patients were analyzed for the presence of aorta calcification using CT angiography. Results. We found no association of calcification grade with risk factors for AAA but we found a strong association between MCV, MCH, and calcification grade. Instead, no association was found with the other parameter that we analyzed. Conclusions. In this study, we demonstrate that biomarkers such as MCV and MCH could have potential important information about AAA calcification progression and could be useful to discriminate between those patients that should undergo a rapid imaging, thus allowing prompt initiation of treatment of suspicious patients that do not need imaging repetition.
To the memory of Professor Adolfo Turano: “Accedit quod patrem plus etiam quam non modo tu sed quam ipse scit amo” (“I love my father more than, not only you, but even he knows”) (MT Cicerone)
1. Introduction
Abdominal aortic aneurysm (AAA) is largely an asymp-tomatic disease, but the aneurysm may rupture with subse-quent mortality rates of at least 80% if early detection and elective AAA repair are not performed [1–4]. Most of the literature is devoted to the study of the diameter of AAA since it is known that risk of rupture increases exponentially with maximal aortic diameter, and different authors have reported a relationship with risk factors such as age, smoking history, family history of cardiovascular disease, and dyslipidemia and also with some biomarkers [5–8]. Nevertheless, since aneurysm size does not completely represent the natural history of AAA [5–8] other risk factors, including calcifi-cation, have been investigated. Different degrees of mural
calcification exist and the gravity of calcification seems to be associated with the risk of rupture [9–11]. Actually no prognostic indices to evaluate progression of calcification exist and repetition of imaging to monitor AAA expansion is necessary, with some important limitations such as cost or availability [12, 13]. Lack of biomarkers for risk stratification of patients with AAA impedes development of novel person-alized therapies and interventions since, in every patient with a not-yet “surgical” AAA, there are no clear predictors of a fast or slow progression of its own, AAA; that is, the best interval between a radiological check and the next step is not defined. Different authors have suggested a link between risk factors such as smoking history, obesity, glucose tolerance, dyslipidemia, chronic obstructive pulmonary disease, and renal failure and cardiovascular morbidity and mortality,
Volume 2017, Article ID 1370751, 8 pages https://doi.org/10.1155/2017/1370751
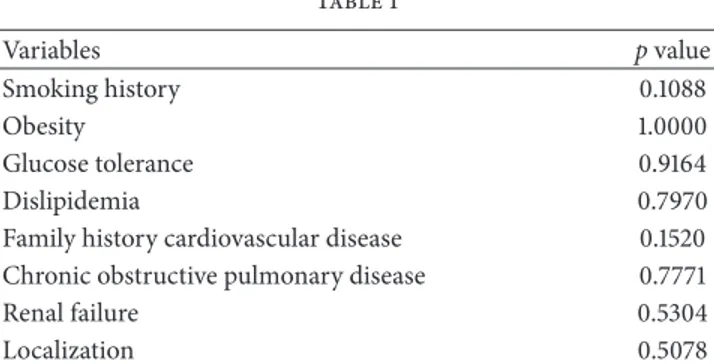
Table 1 Variables p value Smoking history 0.1088 Obesity 1.0000 Glucose tolerance 0.9164 Dislipidemia 0.7970
Family history cardiovascular disease 0.1520
Chronic obstructive pulmonary disease 0.7771
Renal failure 0.5304
Localization 0.5078
p values were computed using Pearson’s Chi-squared test.
together with some biomarkers such as RBC indices, WBC counts with differentials, platelet counts and neutrophil-to-lymphocyte ratio (NLR), and platelet-to-neutrophil-to-lymphocyte ratio (PLR), while no evidence exists in the literature about a possible association between AAA calcification and cell blood count (CBC) parameter even if it is a simple economic and extensively used basic hematological test [14–18]. The aim of our study is to evaluate if classical risk factor and biomarkers associated with AAA [14, 15] can be associated with AAA calcification grade since an accessible and cost-effective measure such as a blood test predicting subsequent AAA progression in calcification could be used to rule in and/or rule out patients for more expensive MR and CT angiography, with benefit for patients and caregivers and with important reduction of cost.
2. Methods
2.1. Patients. The study enrolled 149 Caucasian patients
admitted to the Vascular Surgery of Brescia University “Spedali Civili” hospital in Brescia, Northern Italy, between 2014 and 2016, for AAA surgical repair. Risk factors, including age (continuous), gender (male versus female), and smoking (current versus never or former), were collected. If patients had a body max index > 25 kg/m2 they were classified as obese and affected by diabetes mellitus if they had glycated hemoglobin> 6.5% or if they were prescribed antidiabetic drugs. Dyslipidemia was defined as fasting serum low-density lipoprotein cholesterol> 140 mg/dl, triglycerides > 150 mg/dl, or high-density lipoprotein cholesterol < 40 mg/dl or if patients were prescribed lipid-lowering medications. Finally, patients were classified with renal failure when serum creati-nine was>2 mg/dl and with chronic obstructive pulmonary disease if they had, during spirometry with a forced expira-tory volume in one second, a vital capacity of 70% or less. If cardiovascular disease was present within second-degree relatives, this was recorded as family history of cardiovascular disease. AAA aneurysms were classified on the basis of the anatomical localization and shape. Demographic data and medical history of each patient were collected. Institutional ethic committees approved the study, and all patients pro-vided a written informed consent (approval reference num-ber 1353). Participants did not receive any form of financial compensation. The study conformed to the ethical guidelines
of the “World Medical Association Declaration of Helsinki-Ethical Principles for Medical Research Involving Human Subjects” adopted by the 18th World Medical Association General Assembly, Helsinki, Finland, June 1964, and revised in Tokyo in 2004.
2.2. Imaging Assessment of Aneurysm Calcifications.
Aneu-rysm calcifications were qualitatively assessed by the consen-sus of two physicians: a radiologist and a resident in vascular surgery based on the CT angiography performed within one month before surgery. By a single radiologist, calcifications were evaluated on axial multiplanar reconstructions using a 10 mm thick maximum intensity projection on three different levels: upper, middle, and lower portion of the aneurysm. Cal-cification grade was scored as I when calCal-cifications covered less than one-third of aortic circumference and as II when they covered more than one-third of aortic circumferences. The score at the upper and lower aneurysm level was multiplied by a factor of 0.5 in order to reflect the changes in the aneurysm circumference due to the aneurysm shape. A global score I was observed in 88 patients and a score II in 61 patients.
2.3. Blood Collection and Laboratory Measurements. CBC
information used in this analysis was from blood sam-ples drawn from fasting overnight patients via an ante-cubital vein puncture before AAA resection and commer-cially available assays were used according to manufacturer’s instruction. Specimens were collected in peripheral blood sampling microtainer tube containing K2EDTA and com-plete blood count was measured with the Coulter LH 750 automatic blood counting system. Red blood cell (RBC) indices (hemoglobin, Hb; mean corpuscular volume, MCV; mean corpuscular hemoglobin, MCH; mean corpuscular hemoglobin concentration, MCHC; and red blood cell dis-tribution width, RDW), white blood cell (WBC) counts with differentials (neutrophil; lymphocyte; monocyte, eosinophils, and basophils) and platelet (PLT) counts data were collected. NLR was calculated by dividing absolute neutrophil count by absolute lymphocyte count and PLR as the ratio of the platelet to lymphocyte. The instruments were calibrated against appropriate proprietary reference standard material and verified by using the registered quality controls.
2.4. Statistical Analysis. To analyze the relationships between
calcification and the variables in the dataset, we applied different test.
First of all, we tested the association between calcification and the 9 risk factors in the dataset (which are qualitative variables) using Pearson’s Chi-squared test.
For the 14 quantitative variables related to blood count, we studied possible relationships with calcification by means of the nonparametric Wilcoxon signed-rank test since all the variables (except one) are not normally distributed. Wilcoxon signed-rank test is a good alternative to 𝑡-test when the population cannot be assumed to be normally distributed. Moreover, for the variables related to calcification, we build a boxplot in order to clearly highlight the differences between patients with severe calcifications and the others.
T able 2: D es cr ip ti ve st at ist ics fo r va ria b les re la te d to b lo o d co un t. St at ist ics WB C R B C H gb H ct M C V M CH M C H C RD W P TL N eu tr o p h il s L ym p h o cyt es M o no cyt es E osino p hi ls B as o p h il s M ea n 7.1 7 4.4 0 13.79 43.4 8 93.7 2 31 .4 9 33.3 9 14.5 3 19 2.8 2 4.3 3 1.7 5 0.58 0.3 2 0.0 3 Er ro r st anda rd 0.15 0.05 0.1 4 2.45 0.5 0 0.1 9 0.21 0.12 4.5 2 0.0 9 0.0 4 0.01 0.15 0.0 0 M o de 5.7 3 4.7 4 15.20 4 4.20 93.80 31.4 0 33.3 0 13.7 0 180.0 0 4.18 1.7 2 0 .5 6 0.15 0.0 3 Q1 5.8 9 4.0 6 12.8 38.3 91 .6 30.5 33.1 13.6 15 2 4.18 1.7 2 0.5 6 0.15 0.0 3 Q2 (media n) 7.01 4.4 8 14.0 0 4 2.0 0 94.10 31.7 0 33.6 0 14.20 188.0 0 4.18 1.7 2 0.5 6 0.15 0.0 3 Q3 8.3 4 4.7 8 14.9 0 4 4.20 97 .10 32.9 0 34.10 15.20 218.0 0 4.18 1.7 2 0.5 6 0.15 0.0 3 IR = Q 3 − Q1 1.3 3 0.3 0 0.9 0 2.20 3.0 0 1.20 0.5 0 1.0 0 30.0 0 0.0 0 0.0 0 0.0 0 0.0 0 0.0 0 M in 3.87 2.5 5 8.20 24.3 0 65.10 20.20 3.7 0 12.20 11.0 0 1.9 6 0.7 0 0.3 4 0.0 2 0.0 0 M ax 12.5 2 6.29 17 .3 0 4 01.0 0 10 6.9 0 36.80 35.5 0 19 .4 0 387 .0 0 9.5 2 3.5 2 1.12 22.0 0 0.0 9 Ra n ge (m ax − min) 8.6 5 3.7 4 9.10 37 6.7 0 41.80 16.6 0 31.80 7.20 37 6.0 0 7.5 6 2.8 2 0.7 8 21.98 0.0 9 St an da rd de via tio n 1.80 0.6 0 1.6 5 29 .9 1 6.0 6 2.3 2 2.5 6 1.4 3 55.18 1.0 6 0.45 0.12 1.79 0.01 Sa m p le va ri an ce 3.2 5 0.3 6 2.7 4 894.3 3 36.7 5 5.3 8 6.5 4 2.0 6 30 4 4.3 5 1.13 0.21 0.01 3.21 0.0 0 Ku rt o si s − 0.13 0.7 7 0.6 5 14 0.6 8 5.4 9 5.3 3 12 5.0 0 2.0 0 1.47 6.7 5 3.6 8 4.6 9 14 8.2 4 6.3 9 A symmet ry 0.4 8 − 0.2 8 − 0.6 3 11.6 9 − 1.5 5 − 1.4 9 − 10.7 1 1.3 6 0.6 2 1.8 4 1.0 9 1.6 1 12.16 1.5 5 C o efficien t o f va ria tio n 0.2 5 0.1 4 0.12 0.6 9 0.0 6 0.07 0.08 0.10 0.29 0.2 5 0.26 0.21 5.6 3 0.4 0
70 80 90 100 n = 61 n = 88 > 33% Calcification 33% Calcification ≤ (a) 35 30 25 20 n = 61 n = 88 > 33% Calcification 33% Calcification ≤ (b)
Figure 1: Boxplots for MCV (a) and MCH (b) using grouping variable calcification.
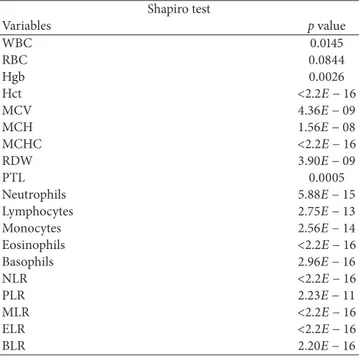
Table 3: Results of the Shapiro-Wilk normality on the variables related to the blood count.
Shapiro test Variables p value WBC 0.0145 RBC 0.0844 Hgb 0.0026 Hct <2.2𝐸 − 16 MCV 4.36𝐸 − 09 MCH 1.56𝐸 − 08 MCHC <2.2𝐸 − 16 RDW 3.90𝐸 − 09 PTL 0.0005 Neutrophils 5.88𝐸 − 15 Lymphocytes 2.75𝐸 − 13 Monocytes 2.56𝐸 − 14 Eosinophils <2.2𝐸 − 16 Basophils 2.96𝐸 − 16 NLR <2.2𝐸 − 16 PLR 2.23𝐸 − 11 MLR <2.2𝐸 − 16 ELR <2.2𝐸 − 16 BLR 2.20𝐸 − 16
These procedures were performed with the statistical programming language R version 3.2.4.
3. Results
The dataset is composed of 149 observations, 13 females (8.72%) and 136 males (91.28%). Among them, 88 patients (59.06%) showed a calcification that covered less than 33% of aortic circumference while for the remaining 61 the calcification covered more than 33% of aortic circumferences. Patients differed in age, sex, hypertension, obesity, glucose tolerance, renal failure, family history of cardiovascular dis-eases, and chronic obstructive pulmonary disease. As shown in Table 1, in our data no significant association was found with the classical risk factors analyzed between patients with calcification grades I and II.
We then analyzed CBC and, overall, all hematological indices were within the normal limit according to our laboratory references. Table 2 reports the descriptive statistics for the 14 quantitative variables in the dataset related to blood count.
We note that, for neutrophils, lymphocytes, monocytes, eosinophils, and basophils, the Interquartile Range (IR, henceforth) is equal to 0 (there is no variability in the central interval that contains 50% of the ordered observations).
Table 3 reports the results of Shapiro-Wilk normality test, pointing out that all the variables (except RBC) are not nor-mally distributed. These results led us to use nonparametric Wilcoxon signed-rank test since it does not require particular assumptions on the distribution of the analyzed variables. In fact, on this type of data, t-test could lead to biased results. Wilcoxon𝑝 values are reported in Table 4.
For completeness, we compute also𝑡-test for the unique variable normally distributed RBC which provides similar results (see Table 5) to the Wilcoxon signed-rank test. We computed also the following ratios well known in literature: NLR and PLR. For both we reject the hypothesis of normality (see Table 3) and we use the Wilcoxon signed-rank test for understanding potential relationships with wall calcification (Table 4).
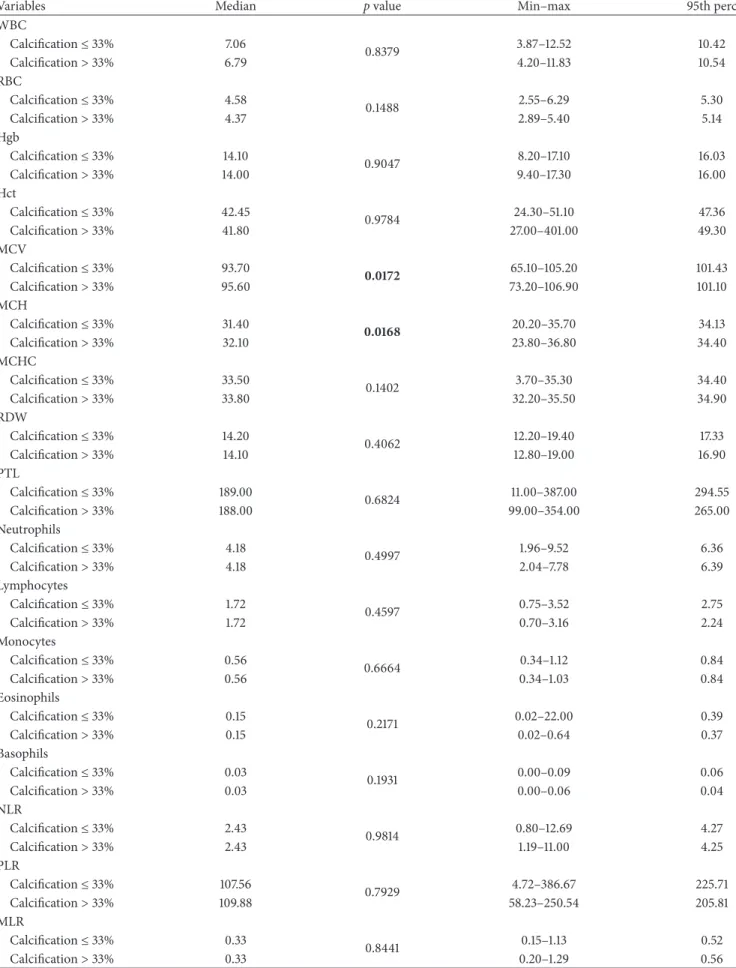
Only MCV and MCH (Table 4) show a significant rela-tionship with calcification (𝑝 value < 0.05). More precisely, patients with severe calcification (>33%) have higher median values for both variables (see also red boxplots in Figures 1(a) and 1(b)). Since reference values for MCV are different for men and women, we repeated the Wilcoxon signed-rank test excluding the 13 females from the analysis. It is interesting to note that we obtained similar results (see Table 6).
Differently from other studies related to calcification and other cardiovascular disease, no significant difference was observed in all the other parameters observed.
4. Discussion
The main finding in our study is the identification of potential biomarkers of increased risk of calcification in patients with AAA. Our results, if confirmed in independent larger studies,
Table 4: Wilcoxon signed-rank test for variables related to blood count. In bold, p value< 0.05.
Variables Median p value Min–max 95th perc
WBC Calcification≤ 33% 7.06 0.8379 3.87–12.52 10.42 Calcification> 33% 6.79 4.20–11.83 10.54 RBC Calcification≤ 33% 4.58 0.1488 2.55–6.29 5.30 Calcification> 33% 4.37 2.89–5.40 5.14 Hgb Calcification≤ 33% 14.10 0.9047 8.20–17.10 16.03 Calcification> 33% 14.00 9.40–17.30 16.00 Hct Calcification≤ 33% 42.45 0.9784 24.30–51.10 47.36 Calcification> 33% 41.80 27.00–401.00 49.30 MCV Calcification≤ 33% 93.70 0.0172 65.10–105.20 101.43 Calcification> 33% 95.60 73.20–106.90 101.10 MCH Calcification≤ 33% 31.40 0.0168 20.20–35.70 34.13 Calcification> 33% 32.10 23.80–36.80 34.40 MCHC Calcification≤ 33% 33.50 0.1402 3.70–35.30 34.40 Calcification> 33% 33.80 32.20–35.50 34.90 RDW Calcification≤ 33% 14.20 0.4062 12.20–19.40 17.33 Calcification> 33% 14.10 12.80–19.00 16.90 PTL Calcification≤ 33% 189.00 0.6824 11.00–387.00 294.55 Calcification> 33% 188.00 99.00–354.00 265.00 Neutrophils Calcification≤ 33% 4.18 0.4997 1.96–9.52 6.36 Calcification> 33% 4.18 2.04–7.78 6.39 Lymphocytes Calcification≤ 33% 1.72 0.4597 0.75–3.52 2.75 Calcification> 33% 1.72 0.70–3.16 2.24 Monocytes Calcification≤ 33% 0.56 0.6664 0.34–1.12 0.84 Calcification> 33% 0.56 0.34–1.03 0.84 Eosinophils Calcification≤ 33% 0.15 0.2171 0.02–22.00 0.39 Calcification> 33% 0.15 0.02–0.64 0.37 Basophils Calcification≤ 33% 0.03 0.1931 0.00–0.09 0.06 Calcification> 33% 0.03 0.00–0.06 0.04 NLR Calcification≤ 33% 2.43 0.9814 0.80–12.69 4.27 Calcification> 33% 2.43 1.19–11.00 4.25 PLR Calcification≤ 33% 107.56 0.7929 4.72–386.67 225.71 Calcification> 33% 109.88 58.23–250.54 205.81 MLR Calcification≤ 33% 0.33 0.8441 0.15–1.13 0.52 Calcification> 33% 0.33 0.20–1.29 0.56
Table 4: Continued.
Variables Median p value Min–max 95th perc
ELR Calcification≤ 33% 0.09 0.1405 0.02–14.77 0.23 Calcification> 33% 0.09 0.02–0.36 0.18 BLR Calcification≤ 33% 0.02 0.5956 0.00–0.09 0.03 Calcification> 33% 0.02 0.00–0.04 0.03 In bold,𝑝 values < 0.05.
Table 5: t-test for RBC variable.
Variable Mean p value Min–max 95th perc
RBC
Calcification≤ 33% 4.45
0.1981 2.55–6.29 5.30
Calcification> 33% 4.32 2.89–5.40 5.14
Table 6: Wilcoxon signed-rank test for MCV and MCH excluding females from the analysis.
Variables Median 𝑝 value Min–max 95th perc
MCV
Calcification≤ 33% 93.10 0.0060 65.10–105.20 101.50
Calcification> 33% 95.70 73.20–106.90 101.15
In bold,𝑝 values < 0.05.
may have potential implications for improved prediction, therapy personalization, and development of novel therapies. Personalized medicine is the concept promising progress in modern healthcare, and the biomarkers comprise its cornerstone [19]. Despite obviously varying rates of calcifi-cation progression or further clinical destabilization, current guidelines recommend a universal approach to these “high risk” patients. Such uniform management may be responsible for lack of progress in development of new strategies in the management of these patients. In our population of 149 patients admitted to the vascular surgery for AAA restriction we found that well-known risk factors for AAA are not, in our hands, correlated with different grade of calcification suggesting that none of the risk factors analyzed can be used reliably as risk factors for progression of calcification.
As an economic and extensively used basic hematological test, some parameter of CBC became a target of investigation after it was found that some of them are associated with mor-bidity, mortality, and calcification in different cardiovascular diseases [16, 20, 21].
A large number of studies use t-test to determine if two sets of data are significantly different from each other, without checking the normality in the units. For this reason, we first control the data distribution and we then choose a tailored approach able to deal with observations non-normally distributed. Consequently, we are confident that our results are reliable.
In our analysis we highlight a statistically significant difference in median values of MCV and MCH (both 𝑝 values are lower than 0.05) in patients with different grade
of calcification of AAA, confirming that these subgroups of individuals come from different populations.
Reduction in RBC indices, such as MCV and MCH, accompanies the aging of RBC together with a decrease in whole cell deformability while rigidity increases this reduc-tion in deformability which plays a role in the destrucreduc-tion of the RBC [22–24]. Deformability describes the ability of RBCs to change shape in response to deforming forces which not only improves their flow properties but also protects against cell disruption under bulk flow conditions and in the circulation when passing through vessels with higher rigidity caused, for example, by calcification, or with a flow shear stress caused by the change in the structure of the calcified AAA [25, 26]. Probably the reason of the higher MCV and MCH in patient with a higher calcification grade is related to the fact that older RBCs, with lower MCV and lower MCH, that have less elasticity died easily following turbulence that can be present nearby AAA calcification or cannot support the impact with calcified tissue that has as a consequence a global MCV and MCH increase.
From our data we found no association of the other above-mentioned markers with different grade of calcifica-tion of AAA; this is probably dependent on the fact that markers described to correlate with calcification of other districts are not useful for AAA calcification grade, regarding the heterogeneity between previous studies and our studies in the studied population and definition of each calcified group as well as imaging modalities to detect calcification, and from a methodological point of view statistical analysis used by most of the other studies was less complex than
the one we use in our study. Nevertheless, our findings suggest that none of CBC indices can be used reliably as a marker of calcification grade of AAA apart from MCV and MCH that strongly correlate with the different grade of calcification. This is very important since, beside imaging, today no accurate methods exist in order to diagnose calcified AAAs, and clinical examination is still doubtful and the management of patients with AAA might significantly benefit from the measurement of circulating markers that facilitate an early diagnosis and that could have a direct correlation with a possible fast growth of a known lesion with important limitation such as cost, availability, or waiting time; therefore the aim of our study is to identify circulating markers that could substantially help to identify appropriate patients for different monitoring protocols and intervention. We also believe that this marker should be available in most of the laboratories and have a weak economic impact.
Conflicts of Interest
The authors declare that they have no conflicts of interest.
Acknowledgments
The authors thank the personnel of the II and III Surgery Wards of Spedali Civili of Brescia for their assistance in sampling the specimens and Kris Hagan for his contribution to the preparation of this manuscript.
References
[1] J. J. Earnshaw, “Comments regarding ’Agreement between computed tomography and ultrasound on abdominal aortic aneurysms and implications on clinical decisions’,” European Journal of Vascular and Endovascular Surgery, vol. 42, no. 5, pp. 615-616, 2011.
[2] S. Svensj¨o, M. Bj¨orck, M. G¨urtelschmid, K. Djavani Gidlund, A. Hellberg, and A. Wanhainen, “Low prevalence of abdominal aortic aneurysm among 65-year-old swedish men indicates a change in the epidemiology of the disease,” Circulation, vol. 124, no. 10, pp. 1118–1123, 2011.
[3] R. Ahmed, K. Ghoorah, and V. Kunadian, “Abdominal aortic aneurysms and risk factors for adverse events,” Cardiology in Review, vol. 24, no. 2, pp. 88–93, 2016.
[4] E. Choke, K. Lee, M. McCarthy et al., “Risk models for mortality following elective open and endovascular abdominal aortic aneurysm repair: A single institution experience,” European Journal of Vascular and Endovascular Surgery, vol. 44, no. 6, pp. 549–554, 2012.
[5] E. Garrafa, A. Marengoni, R. D. Nave et al., “Association between human parainfluenza virus type 1 and smoking history in patients with an abdominal aortic aneurysm,” Journal of Medical Virology, vol. 85, no. 1, pp. 99–104, 2013.
[6] R. C. Lo, R. P. Bensley, A. D. Hamdan, M. Wyers, J. E. Adams, and M. L. Schermerhorn, “Gender differences in abdominal aortic aneurysm presentation, repair, and mortality in the Vascular Study Group of New England,” Journal of Vascular Surgery, vol. 57, no. 5, pp. 1261–1268, 2013.
[7] J. Golledge, P. S. Tsao, R. L. Dalman, and P. E. Norman, “Circulating markers of abdominal aortic aneurysm presence
and progression,” Circulation, vol. 118, no. 23, pp. 2382–2392, 2008.
[8] J. de Haro, F. Acin, S. Bleda, C. Varela, F. J. Medina, and L. Esparza, “Prediction of asymptomatic abdominal aortic aneurysm expansion by means of rate of variation of C-reactive protein plasma levels,” Journal of Vascular Surgery, vol. 56, no. 1, pp. 45–52, 2012.
[9] F. A. M. V. I. Hellenthal, B. Pulinx, R. J. T. J. Welten et al., “Circulating biomarkers and abdominal aortic aneurysm size,” Journal of Surgical Research, vol. 176, no. 2, pp. 672–678, 2012. [10] R. V. C. Buijs, T. P. Willems, R. A. Tio et al., “Calcification as a
risk factor for rupture of abdominal aortic aneurysm,” European Journal of Vascular and Endovascular Surgery, vol. 46, no. 5, pp. 542–548, 2013.
[11] W. E. Torres, D. E. Maurer, H. V. Steinberg, S. Robbins, and M. E. Bernardino, “CT of aortic aneurysms: The distinction between mural and thrombus calcification,” American Journal of Roentgenology, vol. 150, no. 6, pp. 1317–1319, 1988.
[12] S. A. O’Leary, J. J. Mulvihill, H. E. Barrett et al., “Determining the influence of calcification on the failure properties of abdom-inal aortic aneurysm (AAA) tissue,” Journal of the Mechanical Behavior of Biomedical Materials, vol. 42, pp. 154–167, 2015. [13] A. R. Brady, S. G. Thompson, F. G. R. Fowkes, R. M.
Green-halgh, J. T. Powell, and Participants UKSAT, “Abdominal aortic aneurysm expansion: risk factors and time intervals for surveil-lance,” Circulation, vol. 110, no. 1, pp. 16–21, 2004.
[14] E. Garrafa, A. Giacomelli, M. Ravanelli et al., “Prediction of abdominal aortic aneurysm calcification by means of variation of high-sensitivity C-reactive protein,” JRSM Cardiovascular Disease, vol. 5, article 204800401668217, 2016.
[15] B. G¨ung¨or, K. S. ¨Ozcan, F. ¨Ozpamuk Karadeniz et al., “Red cell
distribution width is increased in patients with ascending aortic dilatation,” Turk Kardiyoloji Dernegi Arsivi, vol. 42, no. 3, pp. 227–235, 2014.
[16] O. M. G¨urel, M. B. Demircelik, M. A. Bilgic et al., “Association between red blood cell distribution width and coronary artery calcification in patients undergoing 64-multidetector computed tomography,” Korean Circulation Journal, vol. 45, no. 5, pp. 372– 377, 2015.
[17] S. Balta, Z. Demirer, M. Aparci, A. O. Yildirim, and C. Ozturk, “The lymphocyte-monocyte ratio in clinical practice,” Journal of Clinical Pathology, vol. 69, no. 1, pp. 88-89, 2016.
[18] A. Oleksiak, M. Kruk, E. Lenarczyk et al., “Biomarkers for risk stratification in secondary cardiovascular prevention. A role of red blood cell distribution width and calcium score,” Atherosclerosis, vol. 246, pp. 57–62, 2016.
[19] M. Lindquist Liljeqvist, R. Hultgren, A. Siika, T. C. Gasser, and J. Roy, “Gender, smoking, body size, and aneurysm geometry influence the biomechanical rupture risk of abdominal aortic aneurysms as estimated by finite element analysis,” Journal of Vascular Surgery, vol. 65, no. 4, pp. 1014–1021.e4, 2017. [20] A. A. Agyeman and R. Ofori-Asenso, “Perspective: Does
per-sonalized medicine hold the future for medicine?” Journal of Pharmacy and Bioallied Sciences, vol. 7, no. 3, pp. 239–244, 2015. [21] M. Tanaka, M. Fukui, K.-I. Tomiyasu et al., “Eosinophil count is positively correlated with coronary artery calcification,” Hypertension Research, vol. 35, no. 3, pp. 325–328, 2012. [22] S. Nam, S. Kang, and S. Song, “The Neutrophil-Lymphocyte
Ratio Is Associated with Coronary Artery Calcification in Asymptomatic Korean Males: A Cross-Sectional Study,” BioMed Research International, vol. 2017, pp. 1–8, 2017.
[23] F. H. Bosch, J. M. Werre, L. Schipper et al., “Determinants of red blood cell deformability in relation to cell age,” European Journal of Haematology, vol. 52, no. 1, pp. 35–41, 1994.
[24] N. Penha-Silva, C. B. Firmino, F. G. de Freitas Reis et al., “Influ-ence of age on the stability of human erythrocyte membranes,” Mechanisms of Ageing and Development, vol. 128, no. 7-8, pp. 444–449, 2007.
[25] B. D. Horne, J. B. Muhlestein, S. T. Bennett et al., “Association of the dispersion in red blood cell volume with mortality,” European Journal of Clinical Investigation, vol. 45, no. 6, pp. 541– 549, 2015.
[26] G.-F. Von Tempelhoff, O. Schelkunov, A. Demirhan et al., “Correlation between blood rheological properties and red blood cell indices(MCH, MCV, MCHC) in healthy women,” Clinical Hemorheology and Microcirculation, vol. 62, no. 1, pp. 45–54, 2016.
Submit your manuscripts at
https://www.hindawi.com
Stem Cells
International
Hindawi Publishing Corporationhttp://www.hindawi.com Volume 2014
Hindawi Publishing Corporation
http://www.hindawi.com Volume 2014
INFLAMMATION
Hindawi Publishing Corporation
http://www.hindawi.com Volume 2014
Behavioural
Neurology
Endocrinology
International Journal ofHindawi Publishing Corporation
http://www.hindawi.com Volume 2014
Hindawi Publishing Corporation
http://www.hindawi.com Volume 2014
Disease Markers
Hindawi Publishing Corporation
http://www.hindawi.com Volume 2014
BioMed
Research International
Oncology
Journal ofHindawi Publishing Corporation
http://www.hindawi.com Volume 2014
Hindawi Publishing Corporation
http://www.hindawi.com Volume 2014
Oxidative Medicine and Cellular Longevity
Hindawi Publishing Corporation
http://www.hindawi.com Volume 2014
PPAR Research
The Scientific
World Journal
Hindawi Publishing Corporation
http://www.hindawi.com Volume 2014
Immunology Research
Hindawi Publishing Corporation
http://www.hindawi.com Volume 2014
Journal of
Obesity
Journal ofHindawi Publishing Corporation
http://www.hindawi.com Volume 2014
Hindawi Publishing Corporation
http://www.hindawi.com Volume 2014
Computational and Mathematical Methods in Medicine
Ophthalmology
Journal ofHindawi Publishing Corporation
http://www.hindawi.com Volume 2014
Diabetes Research
Journal ofHindawi Publishing Corporation
http://www.hindawi.com Volume 2014
Hindawi Publishing Corporation
http://www.hindawi.com Volume 2014
Research and Treatment
AIDS
Hindawi Publishing Corporation
http://www.hindawi.com Volume 2014
Gastroenterology Research and Practice
Hindawi Publishing Corporation
http://www.hindawi.com Volume 2014