Received: 25 November 2020 Accepted: 08 February 2021 Published: 23 February 2021
http://www.aimspress.com/journal/energy
Review
Economic viability of building energy efficiency measures: a review on
the discount rate
Sergio Copiello*
IUAV University of Venice, Department of Architecture, Dorsoduro 2206, 30123 Venice, Italy * Correspondence: Email: [email protected].
Abstract: How does the issue of the discount rate intersect the research on building energy efficiency and the topics into which it has branched? This contribution tries to answer the previous question through a comprehensive review of related studies. Those studies usually rely on two alternative assumptions. The first refers, explicitly or implicitly, to the notion of cost of capital and, hence, to the position of private stakeholders involved in the decision processes focusing on the adoption of energy-efficient measures in buildings. The second assumption relates to the notion of the social discount rate, which is meant to pursue intergenerational equity and environmental sustainability. As far as the results are concerned, the literature agrees that the discount rate is among the key parameters—possibly the most prominent—affecting the evaluation. However, despite the crucial role it plays, its calculation seldom relies on acknowledged methods and models. Furthermore, data sources sometimes lack consistency and accuracy. Some guidance and suggestions are provided as to the improvement of the discount rate estimation.
Keywords: discount rate; uncertainty and risk; sensitivity; Monte Carlo; building energy efficiency; life cycle cost analysis; discounted cash flow analysis; cost of capital; sustainability
1. Introduction and methodological background
Building energy efficiency has established itself as a promising research strand at least starting from the early eighties, in the wake of the oil price shocks experienced during the seventies and the adoption of the first regulations in the matter in several countries [1]. Accordingly, the literature focusing on the energy use to construct and operate buildings has sharply widened, covering a large range of topics: from policy evaluation to field studies using simulations, surveys, and in-situ
monitoring techniques [2,3]. The estimation of energy demand and consumption as a function of building features, occupant behavior, and other drivers [4–8], the use of innovative tools and systems to improve the performance of the building stock [9–13], the role played by renewable energy sources to reduce greenhouse gas emissions [14–16], and the relationship between embodied and operating energy [17–20] are just a few examples of the topics in which the research has branched.
Under the above framework, the studies dealing with the economic feasibility and viability of the measures meant to improve the energy performance of buildings play a prominent role [21]. Those studies rely on a long-standing set of methods and models, such as the Discounted cash flow analysis [22–26], the Life-cycle cost analysis [27–34], and—more recently—the Cost-optimal methodology [35–37]. The mentioned methods share the following theoretical fundamentals. The implementation of building energy retrofit solutions implies the need to consider investment costs, operating costs, and related savings that are variously distributed across time, along a period of several years or decades. The corresponding values are, therefore, non-homogeneous and require to be discounted back to the present to determine the current worth of the analyzed solutions.
The rationale behind the discounting procedure sinks its roots in the economic discipline and has been stated a century ago or so [38,39], especially in the works of Böhm-Bawerk [40], Fisher [41,42], and Marshall [43]. According to the latter author: “… human nature is so constituted that in estimating the ‘present value’ of a future benefit most people generally make a second deduction … in the form of what we may call a ‘discount’, that increases with the period for which the benefit is deferred” [43] (p. 100). A review of the concepts of discounting and intertemporal choices, including their historical development in the economic discipline, can be found in Frederick et al. [44]. The information needed to perform the discounting summarizes itself in a single parameter: the discount rate. It is defined as the interest rate aimed at capturing the trade-off between the present and future availability of values, goods, activity, and so forth, so it is also referred to as the rate of time preference. Denoting discount rate with r and time with t = 1, 2, …, n, where n is the time horizon of analysis, the discount coefficient d can be calculated as follows:
𝑑 = 1 (1 + 𝑟)⁄ 𝑡 (1)
The discount coefficient in Eq 1 varies from 1 when r = 0 or t = 0, to 0 when r → ∞ and t ≠ 0 or t → ∞ and r ≠ 0. Present values (pv) are found by multiplying future values at time t (fvt) and the
appropriate discount coefficient:
𝑝𝑣 = 𝑓𝑣𝑡∙ 1 (1 + 𝑟)⁄ 𝑡 (2)
The discount rate is directly related to the topic of uncertainty: as every other interest rate, it is a function of the inherent risk of the analyzed transaction, be it an investment financed by equity (the investor’s own capital), an investment financed by debt (the funds borrowed from third parties), and so forth. More broadly, it is a function of the risk perceived by the involved stakeholders—and their need for securing against unfavorable future events—under a given macroeconomic and regulatory framework [45].
The discount rate is precisely the focus of this contribution. The primary interest lies in understanding how that rate is used in the studies related to building energy efficiency. The economic and financial literature bases its estimation on the notion of cost of capital, some well-established models (Weighted average cost of capital and Capital Asset Pricing Model, for instance), and several specific data sources to implement those models (risk-free and risk-premium rates, yield
of treasury bonds, expected return on equity, cost of debt). Do the same notions, models, and data sources drive thermo-economic evaluations as far as energy efficiency in buildings is concerned? And how much the discount rate affects the results?
The remainder of this literature review is arranged as follows. Section 2 focuses on the aim of this contribution and the research questions it tries to address. Section 3 describes the method used to perform the search of the relevant references. Section 4 delves into the general characteristics of the reviewed studies and their relationships. Section 5 presents the results, which are discussed for each research question in a dedicated subsection. Section 6 tries to provide some guidance and suggestions as to the improvement of the discount rate estimation. Section 7 draws the conclusions. 2. Aim and research questions
The primary question which this study aims to address may be summarized as follows: how does the topic of the discount rate intersect with the research strands focusing on building energy efficiency? The discount rate is among the parameters required to perform that kind of economic analysis that involves values variously distributed across time. Accordingly, it is expected to play a prominent role also in the assessment of building energy efficiency measures. Thus it seems worthwhile to investigate how the literature, with regard to both thermo-economic evaluations and other related studies, deals with the topic of discounting.
The above aim translates into the following five specific research questions.
• RQ1: What are the assumptions made before implementing the discount rate estimation?
The estimation of the discount rate requires the adoption of a reference framework, which is primarily made of the issue at stake, depending on the involved stakeholders. Assumptions are expected to summarize those aspects, as well as to translate them into a coherent evaluation perspective.
• RQ2: Are formalized models used to estimate the discount rate?
The discount rate estimation represents the focus of specific methods and models. Nevertheless, their use is not always common practice and tends to be substituted by the adoption of reference values used in previous studies or by the fixation of ad hoc, arbitrary values.
• RQ3: What are the information sources used for collecting data?
Provided a model is used, at least a data source requires to be accessed, which poses the issue of its relevance, reliability, completeness, accuracy, and level of granularity. Since data quality is likely to affect the trustworthiness of the results, it deserves discussing that topic.
• RQ4: What are the typical value ranges of the discount rate estimates?
Depending on assumptions, models, and data sources, the estimated discount rates are expected to fall within bounded intervals. It may be useful to investigate whether the estimates converge —i.e., they more or less overlap—and the reasons why they possibly diverge.
• RQ5: Does the discount rate affect the results? And to what extent?
According to the findings of a few recent works, the influence exercised by the estimated discount rate on the analysis results and related conclusions is expected to be significant and to cause substantial impacts. However, there may be differences from one study to another, so it is worthwhile to investigate whether the analyzed literature agrees on the role played by the discount rate or not.
3. Method
The following two search phrases have been adopted to look for the relevant literature: “building energy efficiency” is the former, “discount rate” is the latter. Both the search phrases have been used simultaneously in the indexing database Scopus. Firstly, the search has been limited to the titles, abstracts, and keywords. The only three documents found are by far lower than the amount of literature that is expected to deal with the topic. Therefore, the search has been subsequently enlarged to all the fields included in Scopus using the following query: ALL (“building energy efficiency” AND “discount rate”), which enabled to find 60 documents (as of 29.10.2018).
Several items, 19 in total, are secondary with respect to the issue addressed here [1,46,55–63,47–54]. Typically, they briefly mention the topic of the discount rate when discussing the background studies, or their reference list features at least one article the title of which includes the phrase “discount rate”, and that is the reason why they are retrieved using the search key above. However, since not directly addressing the topic of discounting, they are no more considered from now on. It being known that the Scopus database and its search engine experience some limitations [64–66], not to mention the fact that several journals, books, and conference proceedings may be excluded from indexation, the search has been further extended to the references cited in the studies mentioned above. Apart from duplicate items, 56 more studies have been considered, bringing the total of literature sources to 116 (97 excluding the 19 secondary documents).
Once identified the literature base, the following data has been collected and organized in synoptic tables: Scopus ID and doi (if available); source title; document title; first author’s name and country (based on his/her affiliation); number of authors; document type (journal article; conference paper; book or book section; other, such as PhD dissertations, handbooks, and so forth); kind of study (literature review; policy paper, including theoretical formulations and position or opinion papers; case study, including benchmarking and comparative data analysis; report); location (for case studies only); kind of data analysis (survey; statistical modeling; cash flow or life-cycle analysis; simulation analysis; optimization modeling); methodologies and analytical tools (where applicable). Along with the document titles, also the keywords have been stored to be processed using a lexical correspondence analysis: term co-occurrence networks are explored using the mapping and clustering software VOSviewer [67–71]. Furthermore, as far as the discount rate is concerned, information about assumptions, models, data sources, estimated values, and impacts on the results is gathered in order to answer the research questions.
4. Preliminary remarks
The analyzed documents feature about three authors on average, ranging from a minimum of one to a maximum of eleven, mostly based in the US, the UK, China, and a few continental European countries (Germany, Sweden, and Italy especially). Nearly 89% of the documents are articles and reviews published in a total of 54 publication outlets, but primarily in a few prominent journals (Energy Policy with 15 occurrences, Energy Efficiency and Energy and Buildings with 8 occurrences each, Energy with 6 occurrences, the Journal of Environmental Economics and
Management with 5 items, the Journal of Cleaner Production with 4 documents). Book sections
represent an additional 6% of the examined documents, while conference papers and other items play a marginal role.
A minor part of the reviewed studies is composed of literature reviews (10%) and reports (7%), while most of the documents are classified here as policy papers (26%) and, above all, case studies (57%). Out of the latter kind of items, only six performs questionnaire-based surveys. Instead, nearly half of the case studies present the results of a discounted cash flow analysis or a life-cycle cost assessment, seldom integrated with a sensitivity analysis. Other significant clusters include the papers discussing the outcomes of statistical investigations—especially based on regression models—and those showing applications of optimization models.
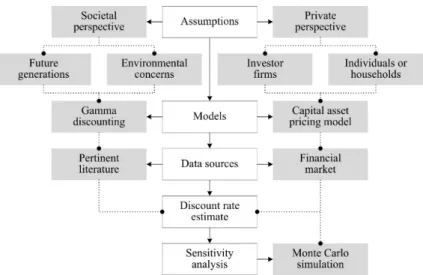
A network-like arrangement of the topics the reviewed studies deal with can be found in Figure 1. The network visualization is built based on binary counting of term co-occurrences in titles and keywords. The minimum number of co-occurrences is set to three, 33 terms met the threshold, and the 25 most relevant (thus 75% of the total) are shown in the network map. The term building lies in the center of the graph and shows connections with nearly all the topics, but it is especially clustered with expressions such as life-cycle cost and assessment. Another significant cluster is centered around the discount rate and also includes the following topics: energy price, energy saving, and cost-effectiveness. A strictly-related cluster is that including the term uncertainty, which is tied with two well-known research branches: climate change is the former, intergeneration equity is the latter. The issue of uncertainty leads to another cluster since it requires the use of appropriate techniques— such as sensitivity analysis and Monte Carlo simulation—to ascertain the effect on the calculation of the net present value in case studies. Finally, the part of the reviewed literature that examines investments in energy conservation measures often deal with the so-called energy efficiency gap and the underlying market barriers.
Figure 1. Network-like arrangement of the topics addressed by the reviewed studies (created using VOSviewer, ver. 1.6.6).
5. Results and discussion
5.1. RQ1: The notions of cost of capital and social discount rate as primary assumptions
5.1.1. Cost of capital and market interest rates
A common assumption is that the discount rate is tied with the notion of cost of capital. Sometimes the assumption is made explicit [72], otherwise it remains hidden behind the data used [73]. Tadeu et al. [74] refer to the average interest rate of the loans accorded by the Deposits and Loans Fund to carry out building rehabilitation projects. Both Copiello [75] and Brown et al. [76] use the yield of long-term Treasury Bonds, the former to estimate the cost of public money, the other authors to approximate the long run time preference of owner households. Fabbri et al. [77] implicitly refer to the cost of debt by introducing the sum of the EurIRS (Euro Interest Rate Swap) and a bank spread. Similarly, Di Giuseppe et al. [34] use both the EurIRS and a consumer loan rate. Newell et al. [78] and Walls et al. [79] also mention the consumer credit interest rates.
The inherent reason behind that assumption is easily understood. Energy efficiency measures in buildings are primarily implemented by private stakeholders—investor firms and individuals or households—in the hope to lessen operating costs: they incur upfront costs in the present and expect to recover the investment in the future thanks to energy bill savings. Upfront costs, in turn, have to be funded. Therefore, the cost of capital is meant to represent the rate of time preference of the involved stakeholders.
5.1.2. Intergenerational equity and environmental sustainability
Building on a different assumption, several studies [80–86] rely on the notion of social discount rate, which should be prone to take on very low values—potentially zero or even negative values [87]—and should also be modeled according to a decreasing function of time [88–91]. That research strand stems from the evolution of environmental economics and heavily relies on the concepts of intergenerational equity and sustainable development [92–97]: the assumption of a zero—or, anyway, declining—discount rate over time ought to be adopted to let the preferences of future generations to weight at least as much as the preferences of the current generation. Lower future discount rates are likely to increase by many folds the present value of long-term environmental benefits [98,99]. Gollier [100] provides arguments supporting the claim that environmental impacts should be discounted using a rate lower than that suitable to discount the monetary (and financial) benefits. Those arguments develop around the following assertion (pp. 813, 814): “The efficient … ecological discount rate equals the marginal rate of substitution between future and present … environmental qualities. … if one believes that the quality of the environment will deteriorate over time, a negative ecological discount rate may be socially efficient.”
A further shift of the above point of view is represented by the proposal of adopting a decreasing discount rate across time [101,102]. A befitting example is the gamma discounting approach proposed by Weitzman [89]. The author subdivide the future into five subperiods (p. 261): “the Immediate Future (1 to 5 years hence), the Near Future (6 to 25 years hence), the Medium Future (26 to 75 years hence), the Distant Future (76 to 300 years hence), and the Far-Distant Future (more than 300 years hence).” The proper discount rates for each subperiod, based on a survey involving more than two thousand
economists, are as follows: 4%, 3%, 2%, 1%, and 0%, respectively. Newell and Pizer [98] suggest the following thresholds of falling rates according to an analysis performed using a random walk model (p. 66): “from 4% to 2% after 100 years, down to 1% after 200 years, and further declining to 0.5% after about 300 years.” Metz et al. [86] report that the UK government endorses the use of the following declining rates (p. 137): “3.5% … for 1–30 years, a 3% … for 31–75 years, a 2.5% … for 76–125 years, a 2% … for 125–200 years, 1.5% for 201–300 years, and 1% for longer periods.” Frederick et al. [44] report several studies that found empirical evidence of a declining rate of time preference (see p. 360), which is often referred to as hyperbolic discounting.
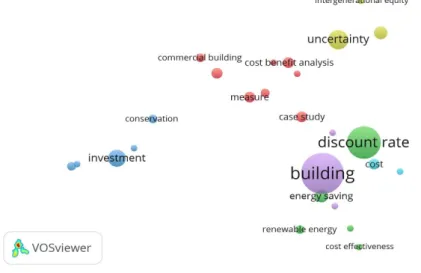
Declining discount schemes are controversial not only because they are at odds with common practice in financial markets - since we are used to experiencing increasing yield curves (Figures 2 and 3)—but also due to unintended side effects [102]. A few studies review the weaknesses, failures, and biases due to the arguments brought forward to support the adoption of low, zero, or declining discount rates, especially as far as their time inconsistency is concerned [103–105]. Moreover, the theoretical foundation of a social discount rate that declines across the time horizon has been called into question due to implications as regards its ambiguity and uncertainty [106]. However, it must also be stressed that the assumption of declining rates in the long run, over many decades or centuries, goes hand in hand with what has happened over the last four millennia or so. In their history of interest rates, Homer and Sylla [107] note that (p. 2): “interest rates in ancient Babylonia, Greece, and Rome show, in each case, a progressive decline … as the nation or culture developed and throve, and then a sharp rise … as each declined … In our culture (Western Europe and North America), interest rates declined most of the time from the Middle Ages to the middle of the twentieth century … The extraordinarily high rates of the 1970’s and 1980’s have not lasted long enough to show a significant change of trend in the long-run charts.”
As far as the sustainability perspective is concerned, a brief digression may be in order here. Between late 2019 and early 2020, we saw the coronavirus pandemic outbreak, which is still ongoing at the time of writing this literature review. Although it is unclear whether or not this pandemic is about to become a turning point in the economic landscape, also resulting in a shift of paradigm in evaluation, it is already shaping changes in the studies focusing on the viability and profitability of energy efficiency measures [108]. It is suggested, there, that the new framework will be characterized by the need to reconcile the concept of sustainability with that of resilience, seemingly the driver of the forthcoming economic policies, in the energy field, too [109,110].
5.2. RQ2: The lack of formalized methods and models
The handbook of cost-benefit analysis published by the Australian Department of Finance and Administration [111] examines several benchmarks useful to set the discount rate—such as the project-specific cost of capital, the social opportunity cost of capital, the private time preference rate, and the social time preference rate—and the related underlying methodologies. For instance, the Capital Asset Pricing Model (CAPM) and Weighted Average Cost of Capital (WACC) are identified as suitable to estimate discount rates based on the notion of project-specific cost of capital. Although criticized [112], precisely the well-established CAPM [113–116] is widely adopted in other research strands and has also been applied in the evaluation of energy-related investments [117–119]. However, and despite the availability of other options, the reviewed literature is reluctant to use formalized methods and models to estimate the discount rate. Therefore, the second RQ is destined
to remain unanswered, at least in part.
Furthermore, even when relying on well-established methodologies, something is missing. That is particularly the case of variable discounting, namely, adjusting discount rates across time. It is long since recognized that cost of capital and risk can hardly be assumed as constant during a project’s life cycle, so that differential discounting [120,121] has been theorized and applied in various research fields. Indeed, the weighting parameters included in the calculation of the WACC—namely, the equity-debt ratio—are dynamic rather than static so, as remarked in the literature [122], a “single-period WACC applied to cash flows over multiple periods” (p. 527) is a source of inconsistency. Nevertheless, so far, differential discounting has not made its way into the research strand focused on the economic viability of energy efficiency measures.
Even in the generalized lack of formalized methods and models, there is a remarkable exception. Building on a different methodological framework, Torriti [123] takes the cue from the observation that projects are seldom isolated items. They are instead more or less strongly interrelated, so the author provides a model to set a multiple-project discount rate, that is to say, a representative rate for a portfolio of projects. Accordingly, the fundamental parameters to estimate the discount rate are the interrelations and dependencies between investment choices and their economic performance.
Figure 2. Real treasury interest rates in the US during the period 1979–2017 (source: US Office of Management and Budget, Circular A-94, Appendix C).
Figure 3. Yield of treasury bonds in comparison to Weitzman’s gamma discounting (sources: US Department of the Treasury; Bloomberg; Spain’s Ministry of Economy; Italy’s Ministry of Economy and Finance; Weitzman [89]).
A wider look at the methodologies employed in the reviewed studies draws attention to how the issue of uncertainty and risk, which is intrinsic to the topic of discounting, is handled. The inherent uncertainty in investment valuations applied to energy retrofit transactions is the focus of a few influential publications [73,119]. Some studies agree in identifying the preeminence of a probabilistic approach, over a deterministic one, when dealing with stochastic input parameters [33,34,124]: the latter is easily inclined to reject viable energy-efficient solutions, while the former has the ability to deal with the various risk profiles characterizing the stakeholders involved in energy-related projects and transactions.
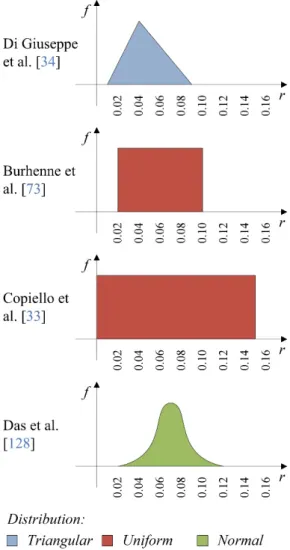
The handbook of cost-benefit analysis mentioned above [111] suggests resorting to sensitivity analysis and full risk analysis as in the case of the Monte Carlo simulation technique to accommodate risk-related issues. Monte Carlo simulation [125,126] is also useful to address the inherent uncertainty of other stochastic input, such as energy price [23]. Nikolaidis et al. [127] perform a sensitivity analysis by setting costs, benefits, and period of analysis as stochastic parameters, under a given discount rate. Das et al. [128] deal with uncertainty in future economic trends by assuming the discount rate is normally distributed with mean 0.07 and variance 0.015. Copiello et al. [33] hypothesize a uniform distribution of the discount rate within the range from 0 to 0.15, while Burhenne et al. [73] let the interest rate varies in the range 0.02–0.10, again according to a uniform distribution. Mahdiyar et al. [129] also seem to adopt a uniform probability distribution of the discount rate, although it is not clearly stated.
Figure 4. Probabilistic approach: the discount rates as a stochastic input parameter.
Instead, Di Giuseppe et al. [34] assume the interest rate—from which the discount rate is derived—follows a triangular distribution with minimum value 0.0149, maximum value 0.0908, and peak value 0.0409 (Figure 4). Cox et al. [130] estimate various average discount rates (from 17% to 63%) and related continuous probability distribution functions—GRKS (the acronym is named after Gray, Richardson, Klose, and Schumann) and Weibull—depending on appliances and energy end-uses (lighting, air conditioning, space or water heating, refrigerators, and cooking). A thorough review of uncertainty-related analysis in the assessment of building energy performance can be found in [131]. The authors devote ample space to the discussion of probabilistic approaches such as the Monte Carlo method and its variants. However, that work mostly deals with physical and technical variables—i.e., climate and weather conditions, building features, system properties, occupant behavior—rather than with the specific economic parameter that is the focus of this piece.
5.3. RQ3: The wide use of already processed and readily available information instead of raw data
As far as the determination of the discount rate is concerned, regardless of the implementation of methods and models, there are several documents published by public authorities and agencies which offer a priori values. For instance, the European Union guidelines accompanying the
Commission Delegated Regulation (EU) No 244/2012 on the cost-optimal methodology [35] recalls the Commission’s 2009 Impact Assessment guidelines and the 4% social discount rate suggested there (p. 18). It shall be stressed that the same Commission Delegated Regulation (EU) No 244/2012 mentions, instead, a 3% real (net of the inflation) discount rate [132] (p. 26). Fennell et al. [133] rely on the UK Treasury Social Discount rate of 3.5%. Other examples are as follows [134]: from 5% to 10% according to the International Energy Agency; 10% proposed by the International Renewable Energy Agency; 5% suggested by the Clean Energy Solutions Center. In its 2013 and 2016 reports [135,136], the National Institute of Standards and Technology of the US Department of Commerce provides tables of discount factors based on the 3% real discount rate forecasted by the Department of Energy, which has been further used in the study of Paganin et al. [137]. The same Department of Energy of the US Government commissioned a document focusing on estimation methods and data sources, which presents estimates by commercial sectors such as healthcare, retail sales, warehouses, education, and several others [138]. Another example is provided by the Circular A-94 of the US Office of Management and Budget [139], relating “Guidelines and Discount Rates for Benefit-Cost Analysis of Federal Programs”, and especially its Appendix C, updated annually, which features discount rates also for cost-effectiveness analysis. The Australian Government, through the Office of Best Practice Regulation and its Handbook of the same name, suggests adopting a 7% discount rate [140]. A review of discount rates applied by public agencies when performing energy system analysis and policy evaluation can be found in Steinbach and Staniaszek [141].
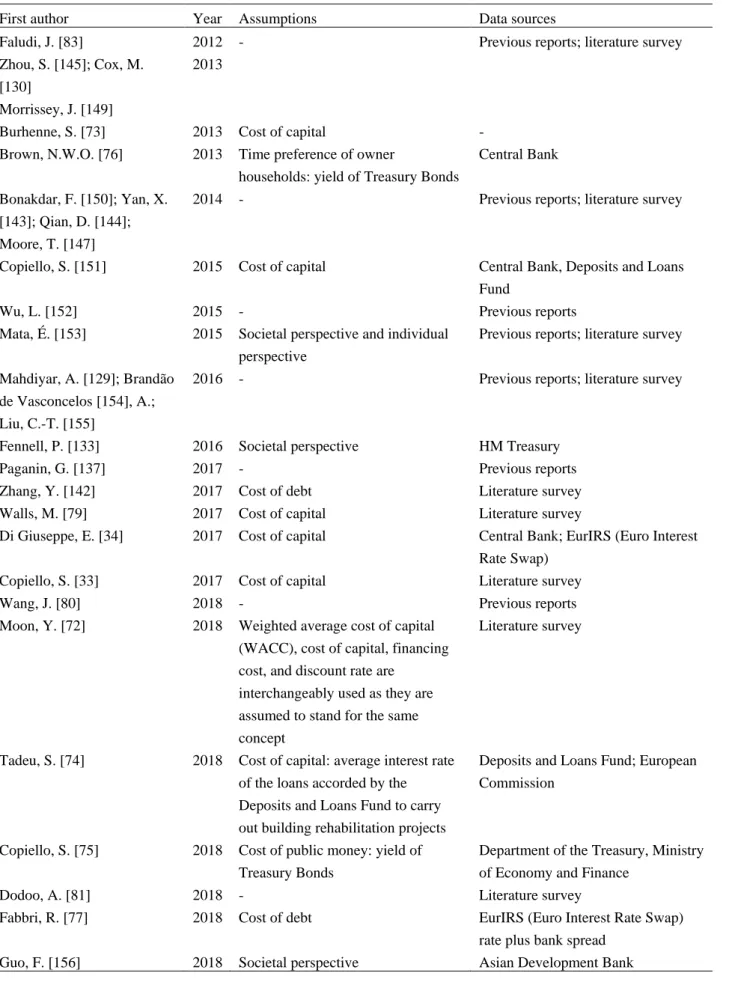
Given the wide availability of already processed information, several studies identify the discount rate relying on the reports mentioned above or by surveying the previous literature [72,80,147,81,83,137,142–146]. A comparison of the values adopted in some studies performing life-cycle cost analyses can be found in Islam et al. [148]. Table 1 provides a synoptic view of the data sources used in part of the analyzed literature and contrasts them with the assumptions made prior to the discount rate estimation.
Table 1. Synoptic view of assumptions and data sources.
First author Year Assumptions Data sources
Faludi, J. [83] Zhou, S. [145]; Cox, M. [130] Morrissey, J. [149] 2012 2013
- Previous reports; literature survey
Burhenne, S. [73] 2013 Cost of capital -
Brown, N.W.O. [76] 2013 Time preference of owner
households: yield of Treasury Bonds
Central Bank
Bonakdar, F. [150]; Yan, X. [143]; Qian, D. [144]; Moore, T. [147]
2014 - Previous reports; literature survey
Copiello, S. [151] 2015 Cost of capital Central Bank, Deposits and Loans Fund
Wu, L. [152] 2015 - Previous reports
Mata, É. [153] 2015 Societal perspective and individual perspective
Previous reports; literature survey
Mahdiyar, A. [129]; Brandão de Vasconcelos [154], A.; Liu, C.-T. [155]
2016 - Previous reports; literature survey
Fennell, P. [133] 2016 Societal perspective HM Treasury
Paganin, G. [137] 2017 - Previous reports
Zhang, Y. [142] 2017 Cost of debt Literature survey
Walls, M. [79] 2017 Cost of capital Literature survey
Di Giuseppe, E. [34] 2017 Cost of capital Central Bank; EurIRS (Euro Interest Rate Swap)
Copiello, S. [33] 2017 Cost of capital Literature survey
Wang, J. [80] 2018 - Previous reports
Moon, Y. [72] 2018 Weighted average cost of capital (WACC), cost of capital, financing cost, and discount rate are
interchangeably used as they are assumed to stand for the same concept
Literature survey
Tadeu, S. [74] 2018 Cost of capital: average interest rate of the loans accorded by the Deposits and Loans Fund to carry out building rehabilitation projects
Deposits and Loans Fund; European Commission
Copiello, S. [75] 2018 Cost of public money: yield of Treasury Bonds
Department of the Treasury, Ministry of Economy and Finance
Dodoo, A. [81] 2018 - Literature survey
Fabbri, R. [77] 2018 Cost of debt EurIRS (Euro Interest Rate Swap) rate plus bank spread
5.4. RQ4: Three value ranges and their underlying rationale
5.4.1. Discount rate values: an overview
The discount rate estimates roughly vary according to three fuzzy ranges. Firstly, intermediate values are in accordance with a business perspective, hence the point of view of the firms involved in carrying out energy retrofit transactions as well as in the provision of energy services. Secondly, high values stem from the literature addressing the consumers’ behavior and their alleged bounded rationality as far as energy-efficient investments are concerned. Thirdly, low values reflect the willingness to incorporate the concept of intergenerational equity and environmental sustainability. The three levels above are broadly equivalent to the three perspectives mentioned in the study of Guo et al. [156]: the first level corresponds to the point of view of business firms and their weighted average cost of capital (also see the investor perspective in Steinbach and Staniaszek [141] and the market-potential perspective in Mata et al. [153] and Ó Broin et al. [157]); the second level translates in what the authors call the individuals perspective; the third level reflects in the so-called whole society perspective and the related social discount rate (also see the social or macroeconomic perspective in Steinbach and Staniaszek [141] and the techno-economic potential perspective in Mata et al. [153] and Ó Broin et al. [157]).
A typical situation is to base the value of the discount rate on agreed thresholds, which are expected to show a more or less significant relationship with a physical, technical, or economic parameter. For instance, Wang et al. [80] set the discount rate to 5.5%, 6.5%, and 8.0% for relatively developed areas, developed areas, and less developed areas, respectively, according to the suggestion of a previous report. Tadeu et al. [74] make the distinction between a financial and a macroeconomic perspective, with higher discount factors characterizing the former (6%, 12%) than those characterizing the latter (3%, 6%). Brandão de Vasconcelos et al. [154] rely on the same two perspectives: for the macroeconomic one they assume four discrete values (2%, 3%, 4%, and 6%), while for the financial one the authors use five threshold values (3%, 5%, 6%, 7%, and 10%). In a similar vein, Dodoo et al. [81] rely on two previous studies [82,150] and define the discount rate level according to the following scenarios: sustainability (1%); intermediate (3%); business as usual (5%). It deserves mentioning that sometimes few explanations are provided, so it is not always immediately clear whether and why the above relationships hold. Copiello and Bonifaci [151] adopt two points of view: the first reflects the cost of capital for households (which is estimated to vary in the range from 3.0% to 5.5%); the second pertains to the cost to access the capital market for public housing companies (from 1.8% to 4.5%). Both the financial perspective [74,154] and the business as usual scenario [81,82] discussed earlier are expressive of the point of view of the firms. Similarly, several case studies [1,77,151,158,159] implicitly recalls the involvement of private investors.
Other authors opt for country-specific discount rates [72], following a recently developing literature [45,134,160,161]. Building on the inverse relationship between income (i.e., economic growth) and discount rate [162], Mahdiyar et al. [129] make a rough distinction between developed and developing nations, the latter ones being characterized by higher rates. Country-specific discount factors are also endorsed by the already mentioned European Union guidelines on the cost-optimal methodology: “The discount rate will be different from Member State to Member State as it reflects to a certain extent not only policy priorities … but also different financing environments and mortgage conditions” [35] (p. 18). Furthermore, the country-specific discount rates in Moon and
Baran [72] and Ondraczek et al. [134] rely on the concept of weighted average cost of capital, which reflects the financing conditions of firms and investors when they enter the capital market.
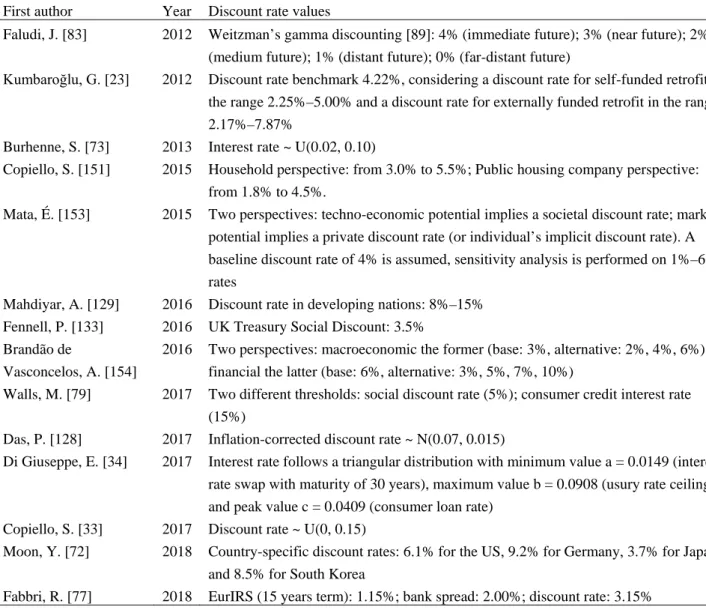
A synoptic view of point estimates and variation intervals (Figure 5, some further details are provided in Table 2 for a selection of studies) highlights a few shared features. Discount rates commonly fall within the range from 3% to 6%. The adoption of a macroeconomic and societal perspective usually leads to lower estimates than market benchmarks, but there are some exceptions. Discount rate estimates driven by sustainability concerns vary in the range from 1% to 5%, and especially between 1% and 3%. Market-based and country-specific discount rates show a high variability and, hence, are scarcely susceptible of generalization.
Table 2. Synoptic view of discount rate estimates. First author Year Discount rate values
Faludi, J. [83] 2012 Weitzman’s gamma discounting [89]: 4% (immediate future); 3% (near future); 2% (medium future); 1% (distant future); 0% (far-distant future)
Kumbaroğlu, G. [23] 2012 Discount rate benchmark 4.22%, considering a discount rate for self-funded retrofit in the range 2.25%–5.00% and a discount rate for externally funded retrofit in the range 2.17%–7.87%
Burhenne, S. [73] 2013 Interest rate ~ U(0.02, 0.10)
Copiello, S. [151] 2015 Household perspective: from 3.0% to 5.5%; Public housing company perspective: from 1.8% to 4.5%.
Mata, É. [153] 2015 Two perspectives: techno-economic potential implies a societal discount rate; market potential implies a private discount rate (or individual’s implicit discount rate). A baseline discount rate of 4% is assumed, sensitivity analysis is performed on 1%–6% rates
Mahdiyar, A. [129] 2016 Discount rate in developing nations: 8%–15% Fennell, P. [133] 2016 UK Treasury Social Discount: 3.5%
Brandão de
Vasconcelos, A. [154]
2016 Two perspectives: macroeconomic the former (base: 3%, alternative: 2%, 4%, 6%), financial the latter (base: 6%, alternative: 3%, 5%, 7%, 10%)
Walls, M. [79] 2017 Two different thresholds: social discount rate (5%); consumer credit interest rate (15%)
Das, P. [128] 2017 Inflation-corrected discount rate ~ N(0.07, 0.015)
Di Giuseppe, E. [34] 2017 Interest rate follows a triangular distribution with minimum value a = 0.0149 (interest rate swap with maturity of 30 years), maximum value b = 0.0908 (usury rate ceiling), and peak value c = 0.0409 (consumer loan rate)
Copiello, S. [33] 2017 Discount rate ~ U(0, 0.15)
Moon, Y. [72] 2018 Country-specific discount rates: 6.1% for the US, 9.2% for Germany, 3.7% for Japan, and 8.5% for South Korea
Figure 5. Comparison of discount rate estimates. 5.4.2. Individuals’ implicit discount rates
In their review of energy-economy models and energy efficiency policies, Mundaca et al. [163] recall a specific empirical research strand, which claims that individuals and households show very high implicit discount rates [164–167]. That outcome is alternatively linked to market and behavioral failures (for instance, asymmetric information and bounded rationality), or hidden transaction costs and risk perception. There is indeed a long literature focusing on the so-called energy efficiency gap, namely, the fact that efficient technologies, which are seemingly cost-effective, experience a low market penetration [168–172]. Part of that literature investigates the implicit discount rates used by
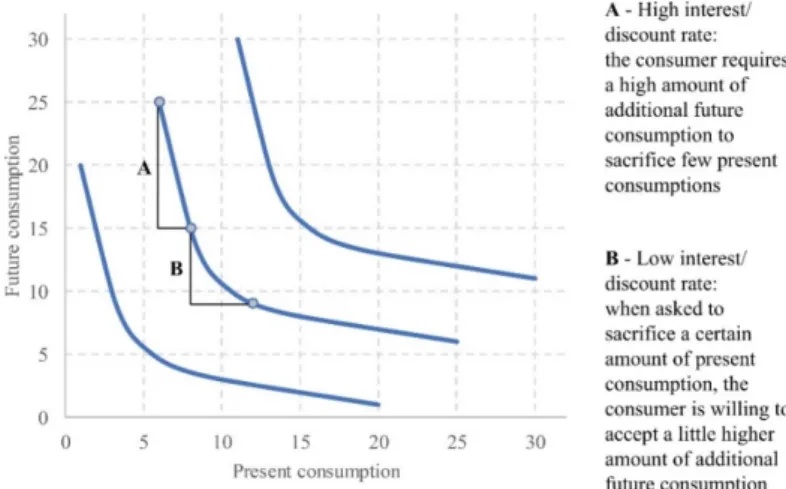
consumers when taking investment decisions, especially when they evaluate the trade-off between upfront costs and deferred savings in energy efficiency problems [173–177]. The empirical findings point to unusually high values, falling within the range from roughly 15% to 50%. The origin of the above research strand can be dated back to some works published between the late seventies and the early eighties [178–180], which point out even higher implicit discount rates. The topic has been further expanded in the subsequent years [181,182], suggesting that a rational explanation may lie in the fact that energy-related investments are not only characterized by uncertainty about future savings but are inhibited by the lack of reliable information [183]. They also are almost irreversible [184,185], as well as affected by remarkable sunk costs [173] and a high-risk profile [117]. Another study has hypothesized that the alleged returns on energy efficiency investments are overestimated, while the expected individual discount rates simply reflect the underlying market risk [186]. Atmadja et al. [187] focus on the determinants of personal discount rates in developing countries, which are supposed to be higher than in developed economies, and find that those determinants are negatively related to the adoption of behavior aimed to prevent health harms. Comprehensive reviews on the topic and the related issues can be found in the works of Train [188], Howarth and Sanstad [189], and Howarth [190]. However, building on a survey of single-family US homeowners and their willingness to pay for energy efficiency, Newell and Siikamäki [191] find that individuals’ implicit discount rates are characterized by remarkable heterogeneity and a skewed distribution with a mean rate of 19%, a median rate of 11%, and a high frequency of rates lower than 10%. Those conflicting results are confirmed by the relatively low implicit discount rates found later by Walls et al. [79]. What is more, relying on the notion of indifference curves and representing interest rates as the result of the trade-off between current and future consumption [42,44,84], it should be noted that different implicit discount factors may characterize even the same consumer according to various levels of consumption that are presently available (Figure 6), so the issue is difficult to resolve.
Figure 6. Representation of interest rates as the result of the trade-off between current and future consumption.
5.4.3. Discount rates, intergenerational equity, and environmental sustainability
As mentioned earlier, several works [80–86] refer to a specific research strand, which has been established and developed around the idea of the social discount rate. As far as the reviewed
literature is concerned, there are specific cases wherein the social discount rate is set to non-negligible values such as, for instance, developing countries or fast-growing economies, as in the cases of China and other South-Eastern Asian countries [156]. However, high discount rates are deemed to be in contrast with policies targeting the reduction of greenhouse gas emissions as an outgrowth of building energy efficiency [154]. Moreover, it is suggested to lower the usual benchmark discount rates used in life-cycle evaluations of energy supply facilities, so that the project options meant to deliver savings of both consumption and emission are not excluded or underrated [152].
5.5. RQ5: Converging results on the impact of the discount rate in the evaluations of building energy efficiency measures
The reviewed literature agrees in identifying the discount rate as a significant variable in the assessment of energy-efficient measures in buildings. Table 3 provides a synoptic view of how it affects the results in a variety of evaluation issues addressed using several methodological tools.
Table 3. Synoptic view of the role played by the discount rate. First author Year Role played by the discount rate
Edenhofer, O. [192]
2011 Discount rates affect the levelized costs of energy for commercially-available renewable energy technologies: increasing the discount rate raises the levelized cost, especially for those technologies characterized by a high ratio between upfront costs and variable costs Cox, M. [130] 2013 The choice of the discount rate influences the expected investments in energy-efficient equipment that the property owners are willing to undertake and, hence, the forecasts of future energy consumption in buildings. A downward correction of the discount rate leads to lower projected energy consumption and higher energy savings in comparison to current benchmarks
Morrissey, J. [149] 2013 The results of life-cycle cost analysis of energy efficiency investments are highly sensitive to the choice of the discount rate. Especially, the use of high discount rates have significant effects also in intragenerational time horizons, and not only from an intergenerational perspective
Burhenne, S. [73] 2013 Economic parameters—especially interest rate and energy price—are found to be very influential in building performance simulation, much more than the technical parameters Yan, X. [143] 2014 In a techno-economic evaluation of energy storage systems to be used in commercial
buildings, the sensitivity analysis reveals that the discount rate has the greatest influence on the net present value of the investment and the related cash flows
Qiu, Y. [193] 2015 The implicit discount rates, used to compare future benefits of energy efficiency technologies with their upfront costs, are a function of the perceived risk. The evidence of very high discount rates means that the actual performance of green buildings is uncertain, unknown, and doubted
Copiello, S. [151] 2015 The net present value of alternative energy efficiency measures is sensitive to the discount rate parameter. Notably, when investment costs and expected savings of an alternative are a multiple of those of another alternative, the net present value curves as a function of the discount rate are likely to intersect, leading to uncertain outcomes
First author Year Role played by the discount rate
Wu, L. [152] 2015 Under the framework of techno-economic evaluations involving greenhouse gas emission and related costs, the decision criteria used to rank the sites suitable to host water supply facilities should undergo sensitivity analysis, being the discount rate and carbon pricing the main influential drivers
Mata, É. [153] 2015 Discount rate significantly affects the net annual costs and, more broadly, the market potential for investments in energy-saving measures
Newell, R. [191] 2015 A skewed distribution characterizes implicit individual discount rates. In contrast with the previous literature, low implicit rates are found to be predominant
Mahdiyar, A. [129] 2016 Due to its correlation with the net present value, the discount rate is featured among the influential parameters in a cost-benefit analysis focusing on green roof installation Liu, X. [155] 2016 Emission reduction efforts are modeled as part of the bid in building procurement, hence,
lower greenhouse gas emissions correspond to higher procurement costs, and the discount rate is used to control the emission within the level desired by the property owner who awards the contract. The discount rate is found to alter the emission reduction efforts of the bidders substantially
Qiu, Y. [194] 2017 Empirical evidence confirms that future energy savings are likely to be heavily discounted when a decision on whether to incur the upfront cost of green building certification has to be made
Walls, M. [79] 2017 The empirical findings contrast with the mainstream idea that implicit discount rates are unusually high for the individuals that opt for energy labels and green certifications Das, P. [128] 2017 Under the framework of a design optimization scheme, the economic criterion requires
considering the discount rates, along with maintenance costs and energy price changes, due to their impact on the optimal design option
Di Giuseppe, E. [34]
2017 Among the stochastic inputs of the Life-cycle cost analysis - such as investment cost, operating costs, and maintenance expenditure - there are three core economic and financial parameters that mostly affect the results: energy price trend, inflation rate, and discount rate Copiello, S. [33] 2017 Life-cycle cost analysis is suitable to be integrated with Monte Carlo simulation due to
several stochastic inputs, among which the discount rate is a primary source of uncertainty. Moreover, that parameter is found to affect the results four times as much as the energy price Dodoo, A. [82] 2017 Under the framework of cost-effectiveness analysis, optimal energy renovation measures
are sensitive to discount rate and energy price increase, which cause large swings in both heat needs and electricity consumptions
Wang, J. [80] 2018 The study points out a strong inverse relationship between the discount rate and life-cycle environmental impacts of buildings. Therefore, the higher the discount rate is, the lower the impact
Moon, Y. [72] 2018 The discount rate plays a crucial role in an analysis based on real options theory, altering the decision on the optimal time of investing in residential photovoltaic systems
Tadeu, S. [74] 2018 Discount rate changes, according to different economic perspectives, substantially affect the identification of cost-optimal solutions
Dodoo, A. [81] 2018 Discount rates, along with energy price changes, are recognized as influential parameters affecting the cost-effectiveness and the economic viability of building energy renovation measures
Fabbri, R. [77] 2018 In a Discounted cash flow analysis of the restoration of a heritage building, the discount rate is not among the sensitive parameters with regard to the Net present value, as well as investment and operating costs
The most remarkable outcomes may be summarized as follows. Apart from a few exceptions [77], the discount rate strongly interacts with investment costs and expected energy savings of energy-efficient solutions [81,82,128–130,153,192,194], in such a way that, although implicit individual discount factors are not found to be unusually high [79,191], it is possibly the most influential parameter in the analysis of energy-related investment [33,34,72–74,143]. Its effects are significant not only from an intergenerational perspective but also in intragenerational time horizons [149]. Moreover, it is a function of risk and uncertainty but, in turn, it further contributes to the uncertainty of the results [151], which also reflects on related environmental issues [80], e.g., the cost of greenhouse gas emissions [152] as well as the cost to reduce them [155].
6. Some suggestions and guidance from the literature review
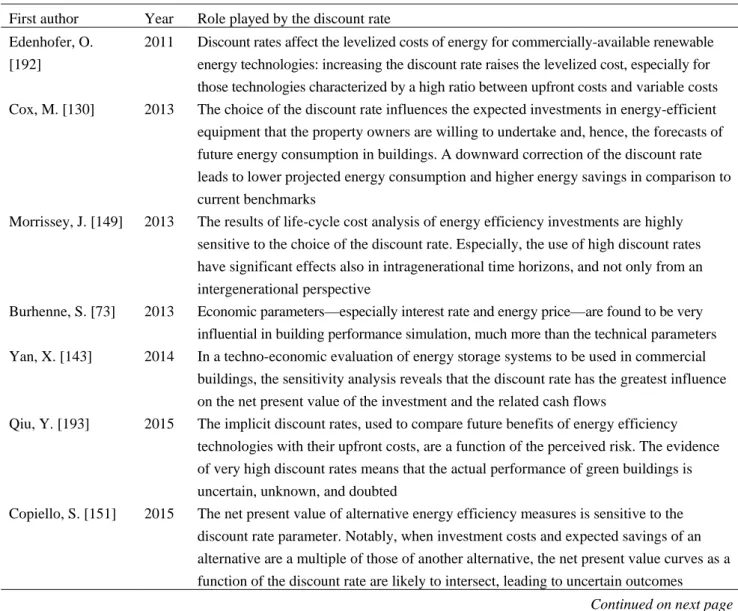
In consideration of the reviewed literature, the primary suggestion has its roots in the need to ensure the comparability among the studies as well as the replicability of the results. As one may expect, the assumptions underlying the discount rate estimation, the evaluation perspectives, and the data sources often vary from one study to another. Nevertheless, the primary issue lies in the fact that some of the aspects above are not clearly stated, which makes confounding and problematic the comparison of the results. Accordingly, the discount rate estimation should follow a logical thread (Figure 7 provides an example), which top-down hierarchical structure is as follows: starting from the assumptions and the related evaluation perspectives, going on with the adoption of coherent models and data sources, and possibly ending at the bottom with the sensitivity analysis of the results.
Here are further specific suggestions that stem from the perusal of the references. The adoption of a market-based approach or a sustainability-based perspective is a primary discriminating factor. The former leads to consider the financing costs incurred by investors firms, individuals, and households, which imply a positive discount rate, ordinarily growing across time. The latter includes both the topic of intergenerational equity and the willingness to properly weight environmental concerns, which instead may suggest the use of a null or declining discount rate. Since it is likely to generate diverging results, the choice deserves to be clearly stated, and its implications should be properly made explicit.
When adopting the notion of cost of capital, considering that the determinants of the discount rate vary continuously across time, the use of estimates and values found in the literature is risky. Those values undergo a quick aging process, unless the above determinants face a steady state due, for instance, to economic stagnation. It looks better to outline updated estimates based on reliable and fully referenced raw data.
Because the discount rate strongly affects the results, the use of point estimates provides limited insights. Sensitivity analysis, at least, and stochastic approaches should be considered. Most of all, the Monte Carlo simulation method has established itself as the leading approach to deal with the inherent uncertainty of the discounting procedure.
Figure 7. Logical thread for the estimation and implementation of the discount rate in energy efficiency evaluations: an example.
7. Conclusions
Save for a few exceptions, the reviewed literature agrees that the discount rate is among the influential parameters—possibly the most prominent—affecting the evaluation of energy-efficient measures in buildings. Neglecting this evidence is likely to produce biased results. Nevertheless, the topic has still to gain the attention it deserves. Several clues support the above conclusion. Firstly, the studies that comprehensively deal with the estimation of the discount rate represent a niche in comparison to the wide and ever-growing literature focusing on the economic viability of energy efficiency solutions. Secondly, the methods and models meant to estimate the discount rate are seldom implemented and mostly disregarded. Furthermore, the data sources sometimes lack consistency and accuracy, especially when values are acritically taken from previous studies or reports. However, there is a core set of state-of-the-art studies that deeply delve into the matter of discounting and its relationships with the key parameters of techno-economic analyses as far as building energy efficiency is concerned. Those studies represent a guiding light for forthcoming research projects and the further development of the field.
Conflict of interest
The author declares no conflicts of interest in this paper. References
1. Copiello S (2017) Building energy efficiency: A research branch made of paradoxes. Renew
Sustain Energy Rev 69: 1064–1076.
2. Rajagopalan P, Dimoudi A (2018) Editorial note for low energy social housing. Energy Build 180: 29–31.
3. Soebarto V, de Dear R, Zuo J, et al. (2018) Editorial note for Virtual Special Issue on energy performance to indoor environmental quality. Energy Build 166: 317–318.
4. Galvin R, Sunikka-Blank M (2014) Disaggregating the causes of falling consumption of domestic heating energy in Germany. Energy Effic 7: 851–864.
5. Huebner GM, Hamilton I, Chalabi Z, et al. (2015) Explaining domestic energy consumption— The comparative contribution of building factors, socio-demographics, behaviours and attitudes.
Appl Energy 159: 589–600.
6. Belaïd F (2016) Understanding the spectrum of domestic energy consumption: Empirical evidence from France. Energy Policy 92: 220–233.
7. Copiello S, Gabrielli L (2017) Analysis of building energy consumption through panel data: The role played by the economic drivers. Energy Build 145: 130–143.
8. Copiello S, Grillenzoni C (2017) Is the cold the only reason why we heat our homes? Empirical evidence from spatial series data. Appl Energy 193: 491–506.
9. Gann DM, Wang Y, Hawkins R (1998) Do regulations encourage innovation?—the case of energy efficiency in housing. Build Res Inf 26: 280–296.
10. Sandén BA, Azar C (2005) Near-term technology policies for long-term climate targets— economy wide versus technology specific approaches. Energy Policy 33: 1557–1576.
11. Noailly J (2012) Improving the energy efficiency of buildings: The impact of environmental policy on technological innovation. Energy Econ 34: 795–806.
12. Dalla Mora T, Peron F, Romagnoni P, et al. (2018) Tools and procedures to support decision making for cost-effective energy and carbon emissions optimization in building renovation.
Energy Build 167: 200–215.
13. Penna P, Prada A, Cappelletti F, et al. (2015) Multi-objectives optimization of Energy Efficiency Measures in existing buildings. Energy Build 95: 57–69.
14. Omer AM (2008) Energy, environment and sustainable development. Renew Sustain Energy
Rev 12: 2265–2300.
15. Marszal AJ, Heiselberg P, Bourrelle JS, et al. (2011) Zero Energy Building—A review of definitions and calculation methodologies. Energy Build 43: 971–979.
16. Palm J (2018) Household installation of solar panels—Motives and barriers in a 10-year perspective. Energy Policy 113: 1–8.
17. Sartori I, Hestnes AG (2007) Energy use in the life cycle of conventional and low-energy buildings: A review article. Energy Build 39: 249–257.
18. Dixit MK, Fernández-Solís JL, Lavy S, et al. (2010) Identification of parameters for embodied energy measurement: A literature review. Energy Build 42: 1238–1247.
19. Dixit MK, Fernández-Solís JL, Lavy S, et al. (2012) Need for an embodied energy measurement protocol for buildings: A review paper. Renew Sustain Energy Rev 16: 3730–3743.
20. Copiello S (2016) Economic implications of the energy issue: Evidence for a positive non-linear relation between embodied energy and construction cost. Energy Build 123: 59–70.
21. Copiello S (2019) Economic parameters in the evaluation studies focusing on building energy efficiency: a review of the underlying rationale, data sources, and assumptions. Energy Procedia 157: 180–192.
22. Amstalden RW, Kost M, Nathani C, et al. (2007) Economic potential of energy-efficient retrofitting in the Swiss residential building sector: The effects of policy instruments and energy price expectations. Energy Policy 35: 1819–1829.
23. Kumbaroğlu G, Madlener R (2012) Evaluation of economically optimal retrofit investment options for energy savings in buildings. Energy Build 49: 327–334.
24. Zalejska-Jonsson A, Lind H, Hintze S (2012) Low-energy versus conventional residential buildings: cost and profit. J Eur Real Estate Res 5: 211–228.
25. Brotman BA (2014) Green office construction: A discounted after-tax cash flow analysis. J
Prop Invest Financ 32: 474–484.
26. Becchio C, Bottero MC, Corgnati SP, et al. (2018) Decision making for sustainable urban energy planning: an integrated evaluation framework of alternative solutions for a NZED (Net Zero-Energy District) in Turin. Land Use Policy 78: 803–817.
27. Marshall HE, Ruegg RT (1977) Energy Conservation through Life-Cycle Costing. J Archit Educ 30: 42–53.
28. Bagatin M, Caldon R, Gottardi G (1984) Economic optimization and sensitivity analysis of energy requirements in residential space heating. Int J Energy Res 8: 127–138.
29. Gustafsson S-I (1993) Life cycle costing related to the refurbishment of buildings, In: Bull JW (Ed.), Life Cycle Costing for Construction, London, Chapman & Hall, 37–52.
30. Gustafsson SI (2000) Optimization of insulation measures on existing buildings. Energy Build 33: 49–55.
31. Verbeeck G, Hens H (2005) Energy savings in retrofitted dwellings: economically viable?
Energy Build 37: 747–754.
32. Ouyang J, Lu M, Li B, et al. (2011) Economic analysis of upgrading aging residential buildings in China based on dynamic energy consumption and energy price in a market economy. Energy
Policy 39: 4902–4910.
33. Copiello S, Gabrielli L, Bonifaci P (2017) Evaluation of energy retrofit in buildings under conditions of uncertainty: The prominence of the discount rate. Energy 137: 104–117.
34. Di Giuseppe E, Massi A, D’Orazio M (2017) Probabilistic Life Cycle Cost Analysis of building energy efficiency measures: Selection and characterization of the stochastic inputs through a case study. Procedia Eng 180: 491–501.
35. European Commission (2012) Guidelines accompanying Commission Delegated Regulation (EU) No 244/2012 of 16 January 2012 supplementing Directive 2010/31/EU of the European Parliament and of the Council on the energy performance of buildings by establishing a comparative methodology f. Off J Eur Union 55: 1–28.
36. Kurnitski J, Kuusk K, Tark T, et al. (2014) Energy and investment intensity of integrated renovation and 2030 cost optimal savings. Energy Build 75: 51–59.
37. Mora TD, Righi A, Peron F, et al. (2017) Cost-Optimal measures for renovation of existing school buildings towards nZEB. Energy Procedia 140: 288–302.
38. Damodaran A (2006) Valuation Approaches and Metrics: A Survey of the Theory and Evidence, New York.
39. Copiello S (2016) A Discounted Cash Flow variant to detect the optimal amount of additional burdens in Public-Private Partnership transactions. MethodsX 3: 195–204.
40. Böhm-Bawerk E von (1903) Recent Literature on Interest, London, The MacMillan co. 41. Fisher I (1907) The Rate of Interest, New York, The MacMillan Co.
42. Fisher I (1930) The Theory of Interest, New York, The MacMillan Co. 43. Marshall A (1920) Principles of Economics, London, The MacMillan co.
44. Frederick S, Loewenstein G, O’donoghue T (2002) Time discounting and time preference: A critical review. J Econ Lit 40: 351–401.
45. Komendantova N, Patt A, Williges K (2011) Solar power investment in North Africa: Reducing perceived risks. Renew Sustain Energy Rev 15: 4829–4835.
46. Liu N, Zhao Y, Ge J (2018) Do renters skimp on energy efficiency during economic recessions? Evidence from Northeast Scotland. Energy 165: 164–175.
47. Trotta G (2018) The determinants of energy efficient retrofit investments in the English residential sector. Energy Policy 120: 175–182.
48. Phua FTT (2018) The role of organizational climate in socially embedding construction firms’ sustainability goals. Constr Manag Econ 36: 409–421.
49. Gaspar K, Casals M, Gangolells M (2018) In situ measurement of façades with a low U-value: Avoiding deviations. Energy Build 170: 61–73.
50. Kangas H-L, Lazarevic D, Kivimaa P (2018) Technical skills, disinterest and non-functional regulation: Barriers to building energy efficiency in Finland viewed by energy service companies. Energy Policy 114: 63–76.
51. Wells L, Rismanchi B, Aye L (2018) A review of Net Zero Energy Buildings with reflections on the Australian context. Energy Build 158: 616–628.
52. Palmer K, Walls M (2017) Using information to close the energy efficiency gap: A review of benchmarking and disclosure ordinances. Energy Effic 10: 673–691.
53. Davis P, McCord MJ, McCluskey W, et al. (2017) Is energy performance too taxing?: A CAMA approach to modelling residential energy in housing in Northern Ireland. J Eur Real Estate Res 10: 124–148.
54. Liu J, Sun X, Lu B, et al. (2016) The life cycle rebound effect of air-conditioner consumption in China. Appl Energy 184: 1026–1032.
55. Claudy M, Michelsen C (2016) Housing market fundamentals, housing quality and energy consumption: Evidence from Germany. Energy J 37: 25–43.
56. Wang Q, Ploskić A, Song X, et al. (2016) Ventilation heat recovery jointed low-temperature heating in retrofitting—An investigation of energy conservation, environmental impacts and indoor air quality in Swedish multifamily houses. Energy Build 121: 250–264.
57. Ürge-Vorsatz D, Kelemen A, Tirado-Herrero S, et al. (2016) Measuring multiple impacts of low-carbon energy options in a green economy context. Appl Energy 179: 1409–1426.
58. Langlois-Bertrand S, Benhaddadi M, Jegen M, et al. (2015) Political-institutional barriers to energy efficiency. Energy Strateg Rev 8: 30–38.
59. Bouhou N-EI, Blackhurst MF, Torres P (2015) An empirical analysis of joint residential electricity efficiency gains within and across end uses: implications for demand-side management. Ecol Econ 110: 61–70.
60. Abolarin SM, Shitta MB, Gbadegesin O, et al. (2015) An Economic Evaluation of Energy Management Opportunities in a Medium Scale Manufacturing Industry in Lagos. Int J Eng Res
Africa 14: 97–106.
61. Jeuland M, Pattanayak SK, Bluffstone R (2015) The economics of household air pollution. Annu
Rev Resour Econ 7: 81–108.
62. Hsu D (2014) Improving energy benchmarking with self-reported data. Build Res Inf 42: 641–656. 63. Matisoff DC, Noonan DS, Mazzolini AM (2014) Performance or marketing benefits? The case
of LEED certification. Environ Sci Technol 48: 2001–2007.
64. Franceschini F, Maisano D, Mastrogiacomo L (2016) The museum of errors/horrors in Scopus.
J Informetr 10: 174–182.
65. Meester WJN, Colledge L, Dyas EE (2016) A response to ‘The museum of errors/horrors in Scopus’ by Franceschini et al. J Informetr 10: 569–570.
66. Franceschini F, Maisano D, Mastrogiacomo L (2016) Empirical analysis and classification of database errors in Scopus and Web of Science. J Informetr 10: 933–953.
67. van Eck NJ, Waltman L (2007) VOS: A New Method for Visualizing Similarities Between Objects, In: Lenz H-J, Decker R (Eds.), Advances in Data Analysis: Proceedings of the 30th
Annual Conference of the German Classification Society, Berlin, Heidelberg, Springer, 299–306.
68. van Eck NJ, Waltman L (2010) Software survey: VOSviewer, a computer program for bibliometric mapping. Scientometrics 84: 523–538.
69. Waltman L, van Eck NJ, Noyons ECM (2010) A unified approach to mapping and clustering of bibliometric networks. J Informetr 4: 629–635.
70. Waltman L, van Eck NJ (2013) A smart local moving algorithm for large-scale modularity-based community detection. Eur Phys J B 86: 471.
71. van Eck NJ, Waltman L (2014) Visualizing Bibliometric Networks, In: Ding Y, Rousseau R, Wolfram D (Eds.), Measuring Scholarly Impact, Cham, Springer International Publishing, 285–320. 72. Moon Y, Baran M (2018) Economic analysis of a residential PV system from the timing
perspective: A real option model. Renew Energy 125: 783–795.
73. Burhenne S, Tsvetkova O, Jacob D, et al. (2013) Uncertainty quantification for combined building performance and cost-benefit analyses. Build Environ 62: 143–154.
74. Tadeu S, Tadeu A, Simões N, et al. (2018) A sensitivity analysis of a cost optimality study on the energy retrofit of a single-family reference building in Portugal. Energy Effic 11: 1411–1432. 75. Copiello S (2018) Expansion of the Italian natural gas network to the Sardinia Island : Economic
assessment. J Nat Gas Sci Eng 54: 297–308.
76. Brown NWO, Malmqvist T, Bai W, et al. (2013) Sustainability assessment of renovation packages for increased energy efficiency for multi-family buildings in Sweden. Build Environ 61: 140–148. 77. Fabbri R, Gabrielli L, Ruggeri AG (2018) Interactions between restoration and financial
analysis: the case of Cuneo War Wounded House. J Cult Herit Manag Sustain Dev 8: 145–161. 78. Newell RG, Jaffe AB, Stavins RN (1999) The induced innovation hypothesis and
Energy-Saving technological change. Q J Econ 114: 941–975.
79. Walls M, Gerarden T, Palmer K, et al. (2017) Is energy efficiency capitalized into home prices? Evidence from three U.S. cities. J Environ Econ Manage 82: 104–124.
80. Wang J, Zhang Y, Wang Y (2018) Environmental impacts of short building lifespans in China considering time value. J Clean Prod 203: 696–707.
81. Dodoo A, Gustavsson L, Le Truong N (2018) Primary energy benefits of cost-effective energy renovation of a district heated multi-family building under different energy supply systems.
Energy 143: 69–90.
82. Dodoo A, Gustavsson L, Tettey UYA (2017) Final energy savings and cost-effectiveness of deep energy renovation of a multi-storey residential building. Energy 135: 563–576.
83. Faludi J, Lepech M (2012) Ecological payback time of an energy-efficient modular building. J
Green Build 7: 100–119.
84. Reddy BS, Assenza GB, Assenza D, et al. (2009) Energy efficiency and climate change: Conserving power for a sustainable future energy efficiency and climate change: Conserving power for a sustainable future, New Delhi, SAGE Publications India.
85. Revesz RL, Stavins RN (2007) Chapter 8 Environmental Law, Handbook of Law and
Economics, 499–589.
86. Metz B, Davidson O, Bosch P, et al. (Eds.) (2007) Climate Change 2007: Mitigation of Climate Change, Cambridge, Cambridge University Press.
87. Dasgupta P, Mäler K-G, Barrett S (1999) Intergenerational Equity, Social Discount Rates and Global Warming, In: Portney P, Weyant JP (Eds.), Discounting and intergenerational equity, Washington, DC, Resources for the Future, 51–79.
88. Weitzman ML (1998) Why the Far-Distant Future Should Be Discounted at Its Lowest Possible Rate. J Environ Econ Manage 36: 201–208.
89. Weitzman ML (2001) Gamma Discounting. Am Econ Rev 91: 260–271.
90. Hepburn C, Koundouri P, Panopoulou E, et al. (2009) Social discounting under uncertainty: A cross-country comparison. J Environ Econ Manage 57: 140–150.
91. Goulder LH, Williams RC (2012) The choice of discount rate for climate change policy evaluation. Clim Chang Econ 03: 1250024.
92. Markandya A, Pearce DW (1991) Development, the environment, and the social rate of discount.
World Bank Res Obs 6: 137–152.
93. Weitzman ML (1994) On the ‘Environmental’ Discount Rate. J Environ Econ Manage 26: 200–209. 94. Lind RC (1997) Intertemporal Equity, Discounting, and Economic Efficiency in Water Policy Evaluation, Climate Change and Water Resources Planning Criteria, Dordrecht, Springer Netherlands, 41–62.
95. Hellweg S, Hofstetter TB, Hungerbühler K (2003) Discounting and the environment. Int J Life
Cycle Assess 8: 8–18.
96. Howarth RB (2003) Discounting and uncertainty in climate change policy analysis. Land Econ 79: 369–381.
97. Dasgupta P (2008) Discounting climate change. J Risk Uncertain 37: 141–169.
98. Newell RG, Pizer WA (2003) Discounting the distant future: how much do uncertain rates increase valuations? J Environ Econ Manage 46: 52–71.
99. Newell RG, Pizer WA (2004) Uncertain discount rates in climate policy analysis. Energy Policy 32: 519–529.
100. Gollier C (2010) Ecological discounting. J Econ Theory 145: 812–829.
101. Gollier C (2002) Time Horizon and the Discount Rate. J Econ Theory 107: 463–473.
102. Atkinson G, Mourato S (2008) Environmental Cost-Benefit analysis. Annu Rev Environ Resour 33: 317–344.
103.Horowitz JK (1996) Environmental policy under a non-market discount rate. Ecol Econ 16: 73–78. 104. Philibert C (1999) The economics of climate change and the theory of discounting. Energy
Policy 27: 913–927.
105. Winkler R (2006) Does ‘better’ discounting lead to ‘worse’ outcomes in long-run decisions? The dilemma of hyperbolic discounting. Ecol Econ 57: 573–582.
106. Freeman MC, Groom B (2016) How certain are we about the certainty-equivalent long term social discount rate? J Environ Econ Manage 79: 152–168.
107. Homer S, Sylla R (2005) A History of Interest Rates, Hoboken, John Wiley & Sons.
108. D’Adamo I, Gastaldi M, Morone P (2020) The post COVID-19 green recovery in practice: Assessing the profitability of a policy proposal on residential photovoltaic plants. Energy Policy 147: 111910.
109. Croese S, Green C, Morgan G (2020) Localizing the sustainable development goals through the lens of urban resilience: Lessons and learnings from 100 resilient cities and cape town.
Sustainability 12: 550.
110. Elmqvist T, Andersson E, Frantzeskaki N, et al. (2019) Sustainability and resilience for transformation in the urban century. Nat Sustain 2: 267–273.
111.Australian Department of Finance and Administration (2006) Handbook of cost-benefit analysis, Canberra, Commonwealth of Australia.
112. Fama EF, French KR (2004) The Capital Asset Pricing Model: Theory and evidence. J Econ

![Figure 3. Yield of treasury bonds in comparison to Weitzman’s gamma discounting (sources: US Department of the Treasury; Bloomberg; Spain’s Ministry of Economy; Italy’s Ministry of Economy and Finance; Weitzman [89])](https://thumb-eu.123doks.com/thumbv2/123dokorg/5488878.62774/9.892.241.658.115.383/comparison-weitzman-discounting-department-bloomberg-ministry-ministry-weitzman.webp)