1) Department of Gastroenterology, Henry Durant Hospital Center, Athens, Greece 2) Division of Internal Medicine, “Aldo Moro” University, Bari Medical School, Bari, Italy 3) Department of
Gastroenterology, University Hospital, Heraklion, Crete, Greece
Address for correspondence: Theodore Rokkas Gastroenterology Clinic, Henry Durant Hospital Center Athens, Greece
Received: 13.06.2018 Accepted: 22.08.2018
Fecal Calprotectin in Assessing Inflammatory Bowel Disease
Endoscopic Activity: a Diagnostic Accuracy Meta-analysis
Theodore Rokkas1, Piero Portincasa2, Ioannis E. Koutroubakis3INTRODUCTION
T h e d i a g n o s i s o f inflammatory bowel diseases (IBD), i.e. Crohn’s disease (CD) and ulcerative colitis (UC), is achieved by combining clinical, laboratory, endoscopic, histological, and radiological findings, whereas their course is characterized by episodes of exacerbation and periods of remission [1-3]. In this context the evaluation of disease severity is of importance for choosing the suitable treatment. Studies [4–6] have shown that existingABSTRACT
Background & Aim: Fecal calprotectin (FC) has been suggested as a sensitive biomarker of inflammatory
bowel disease (IBD). However, its usefulness in assessing IBD activity needs to be more precisely defined. In this meta-analysis we aimed to determine the diagnostic performance of FC in assessing IBD endoscopic activity in adults.
Methods: We searched the databases Pubmed/Medline and EMBASE, and studies which examined IBD
endoscopic activity in association to FC were identified. From each study pooled data and consequently pooled sensitivity, specificity, likelihood ratios (LR), diagnostic odds ratios (DORs) and areas under the curve (AUCs) were calculated, using suitable meta-analysis software. We analyzed extracted data using fixed or random effects models, as appropriate, depending on the presence of significant heterogeneity.
Results: We included 49 sets of data from 25 eligible for meta-analysis studies, with 298 controls and 2,822 IBD
patients. Fecal calprotectin in IBD (Crohn’s disease, CD and ulcerative colitis, UC) showed a pooled sensitivity of 85%, specificity of 75%, DOR of 16.3 and AUC of 0.88, in diagnosing active disease. The sub-group analysis revealed that FC performed better in UC than in CD (pooled sensitivity 87.3% vs 82.4%, specificity 77.1% vs 72.1% and AUC 0.91 vs 0.84). Examining the optimum FC cut-off levels, the best sensitivity (90.6%) was achieved at 50 μg/g, whereas the best specificity (78.2%) was found at levels >100 μg/g.
Conclusions: This meta-analysis showed that in adults, FC is a reliable laboratory test for assessing endoscopic
activity in IBD. Its performance is better in UC than CD.
Key words: Inflammatory bowel disease − Crohn’s disease − ulcerative colitis − fecal calprotectin − diagnostic
accuracy.
Abbreviations: CD: Crohn’s disease; CRP: C-reactive protein; ESR: erythrocyte sedimentation rate; FC: fecal
calprotectin; IBD: inflammatory bowel diseases; UC: ulcerative colitis.
bowel symptoms are unspecific and, furthermore, show poor correlation with mucosal inflammation. On the other hand, conventional laboratory tests such as erythrocyte sedimentation rate (ESR), C-reactive protein (CRP), platelets, blood leukocyte count, and albumin, although useful in clinical practice, express systemic patient responses instead of intestinal inflammation [7]. In recent years, colonoscopy has been considered as the most accurate diagnostic modality and the “reference test” for quantifying activity in IBD. Various scoring systems have been developed to assess IBD endoscopic severity [8, 9]. However, despite its unequivocal usefulness, colonoscopy has some disadvantages in that it is expensive, uncomfortable, and time-consuming and is also related to some complication risks. Therefore, an accurate, relatively simple and easily available laboratory test reflecting intestinal mucosal inflammation would be beneficial to IBD patients.
Calprotectin is a calcium and zinc binding protein mostly derived from neutrophils and monocytes. It can be detected in body fluids, tissue samples, and stools, and is deemed as a marker of neutrophil activity, since calprotectin represents approximately 60% of the total amount of protein in these cells. Consequently, in IBD, the quantity of FC is proportional to the number of neutrophils, which migrate from the wall of the inflamed bowel to the mucosa [10-12]. It is noteworthy that the concentration of FC is resistant to degradation and stable, thus allowing measurements at a convenient time [13]. For all these reasons, it seems that FC is a promising non-invasive biomarker, compared with other existing conventional laboratory markers, for assessing IBD activity. In this context, although FC usefulness has been examined in various individual studies and meta-analyses in the past [14, 15], our understanding on its exact role remains unsatisfactory and, furthermore, studies have been recently published and are not included in the above meta-analyses. Therefore, the aims of this meta-analysis were first to evaluate the performance of FC in assessing endoscopic activity in IBD adult patients by updating the above mentioned meta-analyses and second, to evaluate the optimum FC cutoff level for diagnosing active disease.
MATERIAL AND METHODS
Selection criteria
PRISMA guidelines for systematic reviews were strictly followed. The inclusion and exclusion criteria of potentially eligible studies for the meta-analysis were defined. Full article studies were included if they met the following criteria: (a) they were written in English language, (b) included only adult IBD patients, (c) included IBD patients with symptomatic active disease, which was confirmed endoscopically and (d) they contained appropriate data to construct 2 by 2 contingency tables, in order to calculate FC sensitivity and specificity and all other diagnostic accuracy parameters. If two papers reported the same data, we selected the more informative study. In order to estimate the quality of the eligible studies, we used the QUADAS-2 evaluation [16].
Study identification and extraction of data
Medical literature searches in English, involving PubMed/ MEDLINE and EMBASE databases were performed to identify any relevant publication referring to the role of FC in estimating IBD activity in comparison with reference diagnostic methods such as colonoscopy. Suitable search terms were used as follows: („calprotectin”[All Fields]) AND („faeces”[All Fields] OR „feces”[MeSH Terms] OR „feces”[All Fields]) AND („Crohn disease”[MeSH Terms] OR („Crohn”[All Fields] AND „disease”[All Fields]) OR „Crohn disease”[All Fields] OR („Crohn‘s”[All Fields] AND „disease”[All Fields]) OR „Crohn‘s disease”[All Fields]) AND („colitis, ulcerative”[MeSH Terms] OR („colitis”[All Fields] AND „ulcerative”[All Fields]) OR „ulcerative colitis”[All Fields] OR („ulcerative”[All Fields] AND „colitis”[All Fields]). The search was performed till the end of December 2017, whereas no initiation date limit was used. In addition, we screened the articles of the selection
process for more appropriate references. Data were extracted independently from each study by two of the authors (T.R. and P.P.) by using a predefined form and disagreements were resolved by discussion with the third investigator (I.K.) and consensus.
Statistical analysis
Fecal calprotectin sensitivity, specificity, positive and negative likelihood ratios (LR), diagnostic odds ratios (DOR) and AUCs, with 95% confidence intervals (CIs) were derived by computing data contained in the analyzed studies. Pooled results were calculated by using the fixed-effects model (Mantel and Haenszel method) [17], unless we found significant heterogeneity, in which case we used the random-effects model (DerSimonian and Laird method) [18]. Forest plots were constructed for visual display of individual and pooled data. In addition, the results of the individual studies were displayed in a receiver operating characteristic (ROC) graph, illustrating the distribution of sensitivities and specificities and furthermore a weighted symmetric summary ROC (sROC) curve was calculated. Consequently, the relevant areas under the curve (AUC) were derived, with accurate tests having an AUC approaching 1 and poor tests having an AUC close to 0.5 [19-21]. The existence of heterogeneity between studies was examined by using the Cochran Q-test and the relevant inconsistency index I squared (I2) was used as a measure for quantifying the degree of heterogeneity [22]. In cases where the Q-test provided a p value of less than 0.1 and if I2 was more than 50 [23], then heterogeneity was considered to be present. The existence of publication bias was examined by the Deeks’ funnel plot, with a superimposed regression line [24]. The analyses were performed by Stata software (version 13.0, College Station, TX) with the MIDAS command.
RESULTS
Descriptive assessment and study characteristics
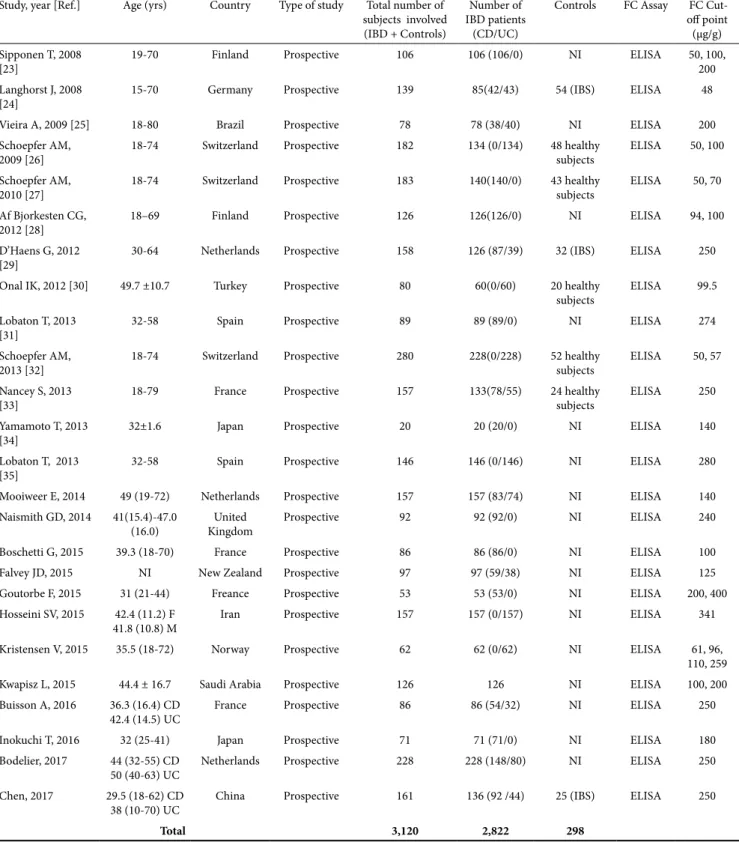
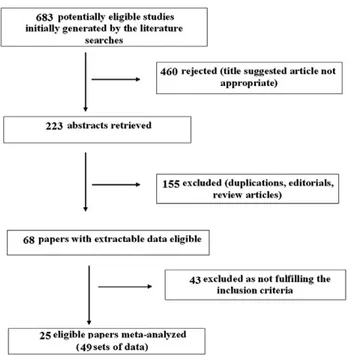
A flow chart describing the process of study selection is shown in Fig. 1. Out of 683 titles initially generated by the literature searches, 25 prospective cohort studies in adult patients [25-49] containing 49 sets of data were found eligible for meta-analysis. These studies included IBD patients whose symptoms were compatible with active disease and in whom disease activity was confirmed endoscopically. The endoscopic activity was quantitated by using various validated indices of scoring the endoscopic findings. In detail, in CD the Simple Endoscopic Score for Crohn‘s Disease (SES-CD), Crohn‘s Disease Endoscopic Index of Severity (CDEIS) and Rutgeert’s endoscopy scores were utilized, whereas the Mayo, Schroeder, and Rachmiliewitz scores were utilized in UC. The main characteristics of the 25 meta-analyzed studies are shown in Table I. They contained a total of 2,822 IBD patients and 298 controls. In the IBD group there were 1,464 CD and 1,232 UC patients. One study [45] reported the total number of IBD patients studied without giving separate information on CD and UC groups. The quality assessment of the included studies was relatively good as the majority of included studies fulfilled most of the QUANTAS-2 criteria.
Table I. The main characteristics of studies selected for meta-analysis.
Study, year [Ref.] Age (yrs) Country Type of study Total number of subjects involved (IBD + Controls)
Number of IBD patients
(CD/UC)
Controls FC Assay FC Cut-off point (μg/g) Sipponen T, 2008
[23] 19-70 Finland Prospective 106 106 (106/0) NI ELISA 50, 100, 200
Langhorst J, 2008
[24] 15-70 Germany Prospective 139 85(42/43) 54 (IBS) ELISA 48
Vieira A, 2009 [25] 18-80 Brazil Prospective 78 78 (38/40) NI ELISA 200
Schoepfer AM,
2009 [26] 18-74 Switzerland Prospective 182 134 (0/134) 48 healthy subjects ELISA 50, 100 Schoepfer AM,
2010 [27] 18-74 Switzerland Prospective 183 140(140/0) 43 healthy subjects ELISA 50, 70 Af Bjorkesten CG,
2012 [28] 18–69 Finland Prospective 126 126(126/0) NI ELISA 94, 100
D’Haens G, 2012
[29] 30-64 Netherlands Prospective 158 126 (87/39) 32 (IBS) ELISA 250
Onal IK, 2012 [30] 49.7 ±10.7 Turkey Prospective 80 60(0/60) 20 healthy
subjects ELISA 99.5 Lobaton T, 2013
[31] 32-58 Spain Prospective 89 89 (89/0) NI ELISA 274
Schoepfer AM,
2013 [32] 18-74 Switzerland Prospective 280 228(0/228) 52 healthy subjects ELISA 50, 57 Nancey S, 2013
[33] 18-79 France Prospective 157 133(78/55) 24 healthy subjects ELISA 250
Yamamoto T, 2013
[34] 32±1.6 Japan Prospective 20 20 (20/0) NI ELISA 140
Lobaton T, 2013
[35] 32-58 Spain Prospective 146 146 (0/146) NI ELISA 280
Mooiweer E, 2014 49 (19-72) Netherlands Prospective 157 157 (83/74) NI ELISA 140 Naismith GD, 2014 41(15.4)-47.0
(16.0) KingdomUnited Prospective 92 92 (92/0) NI ELISA 240
Boschetti G, 2015 39.3 (18-70) France Prospective 86 86 (86/0) NI ELISA 100
Falvey JD, 2015 NI Νew Zealand Prospective 97 97 (59/38) NI ELISA 125
Goutorbe F, 2015 31 (21-44) Freance Prospective 53 53 (53/0) NI ELISA 200, 400
Hosseini SV, 2015 42.4 (11.2) F
41.8 (10.8) M Iran Prospective 157 157 (0/157) NI ELISA 341
Kristensen V, 2015 35.5 (18-72) Norway Prospective 62 62 (0/62) NI ELISA 61, 96, 110, 259
Kwapisz L, 2015 44.4 ± 16.7 Saudi Arabia Prospective 126 126 NI ELISA 100, 200
Buisson A, 2016 36.3 (16.4) CD
42.4 (14.5) UC France Prospective 86 86 (54/32) NI ELISA 250
Inokuchi T, 2016 32 (25-41) Japan Prospective 71 71 (71/0) NI ELISA 180
Bodelier, 2017 44 (32-55) CD
50 (40-63) UC Netherlands Prospective 228 228 (148/80) NI ELISA 250 Chen, 2017 29.5 (18-62) CD
38 (10-70) UC China Prospective 161 136 (92 /44) 25 (IBS) ELISA 250
Total 3,120 2,822 298
IBD: Inflammatory bowel disease; FC: Fecal calprotectin; CD: Crohn’s disease; UC: Ulcerative colitis; NI: Not Included; ELISA: Enzyme-linked immunosorbent assay; IBS: irritable bowel syndrome.
Diagnostic performance of FC
The pooled data (random-effects analysis) showed that FC had a sensitivity of 85% (95% CI 82–87%) and a specificity of 75% (95% CI 71–79%) for diagnosing active disease. There was significant heterogeneity for both the sensitivity and the specificity results (Q-test = 159.28, d.f. = 48, P=0.00, I2= 69.87%) and (Q-test=180.50, d.f. =48, P=0.00, I2=73.41%), respectively.
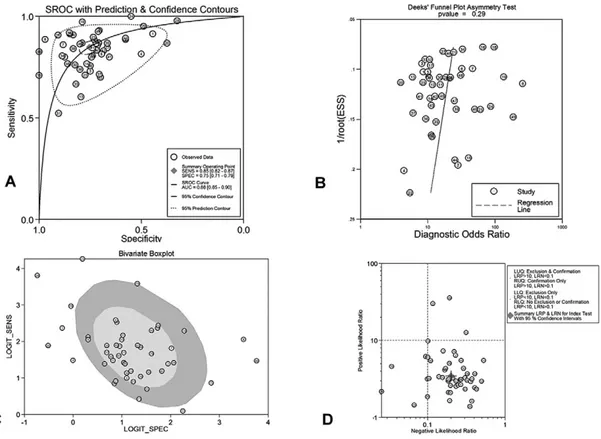
The forest plots of sensitivities and the specificities are presented in Fig. 2. The corresponding ROC plot with sROC is displayed in Fig. 3A, showing an AUC of 0.88 (95% CI 0.85-0.90). Figure 3B depicts the exploration of publication bias (Deek’s funnel plot asymmetry test with superimposed regression line). As shown, there was no significant publication bias (p=0.29 for the slope coefficient)]. In addition, Fig. 3C shows the bivariate boxplot
with most studies clustering within the median distribution and some outliers, suggesting indirectly the magnitude of heterogeneity. The respective likelihood ratio scatter gram is
shown in Fig. 3D, providing the summary point of likelihood ratios obtained as functions of mean sensitivity and specificity. In exploring reasons for the observed significant heterogeneity among studies, further analyses (sensitivity analyses) were conducted, as shown in Supplementary Fig. 1, i.e. the residual-based goodness-of-fit (1A), the bivariate normality (1B), the influence analysis (1C) and the outlier detection (1D). These analyses identified 4 outlier studies that contributed to the significant heterogeneity found. Furthermore, the results of more analyses aiming to identify other factors contributing to significant heterogeneity are depicted in Suppl. Fig. 2C, which shows Forest plots of multiple univariable meta-regression and subgroup analyses for sensitivity and specificity. Suppl. Fig. 2A presents the relevant Fagan’s nomogram providing 46% post-test probability of active IBD after an FC-positive result and only a 5% post-test probability after an FC-negative result. Finally, probability modifying plot is shown in Suppl. Fig. 2B with a positive LR=3.46 (95% CI 2.95-4.04) and negative LR= 0.20 (95% CI 0.17-0.24). These results give a 76% (95% CI 73-79%) positive predictive value (PPV) and an 82% (95% CI 79-85%) negative predictive value (NPV).
Subgroup analyses
FC diagnostic accuracy according to different cutoff values
In the 49 sets of meta-analyzed data the cutoff values for testing positive in the FC assay varied between studies, Fig. 1. Flow chart of the studies identified in this meta-analysis.
ranging from 48 to 400 μg/g. In order to examine FC accuracy performance at different cutoff values, we carried out sub-group analyses taking into account three cut off levels, i.e. FC up to 50 μg /g (7 studies), FC up to 100 mcg/gr (20 studies) and FC > 100 μg /g (29 studies). Table II summarizes pooled sensitivity and specificity (with 95% CI), pooled PLR and NLR (95% CI), pooled DOR (95% CI) and pooled AUCs for these three cut off levels together with the overall performance for the whole group of 49 sets of data. Thus, for the cut off level of 50 μg/g the relevant pooled results were; sensitivity (95% CI) = 90.6% (87.9-92.9), specificity = 60.7% (53.7-67.4) and AUC 0.91. The respective values for cut off levels up to 100 μg /g and > 100 μg /g were 88.2 % (86.5– 89.8), 67 % (63.3 – 70.6), 0.89 and 80 % (77.7-82.2), 78.2% (75.7-80.6), 0.86, respectively.
These pooled results clearly showed that as the cutoff value increases, sensitivity falls and specificity increases.
FC diagnostic accuracy according to disease type
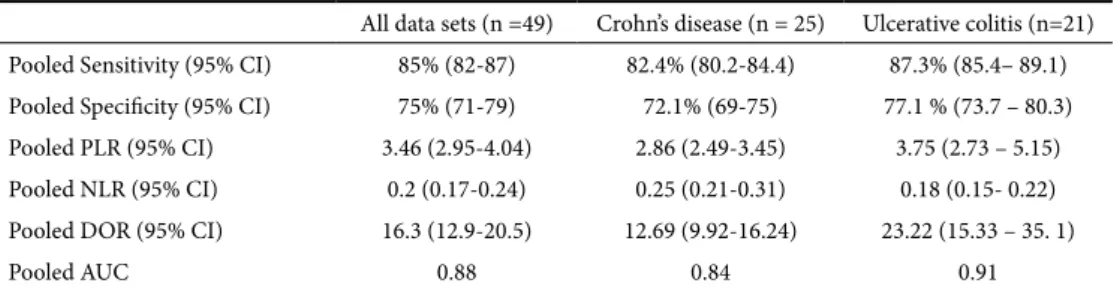
In the 49 sets of data included in the 25 eligible studies, there were 25 sets evaluating FC diagnostic performance in CD and 21 evaluating this performance in UC. Table III summarizes pooled sensitivity and specificity (with 95% CI), pooled PLR and NLR (95% CI), pooled DOR (95% CI) and pooled AUCs for these two diseases separately, together with the overall performance for the whole group of 49 sets of IBD data. For CD, pooled sensitivity, specificity (with 95% CI) and AUC were 82.4% (80.2-84.4), 72.1% (69-75) and 0.84, respectively. For UC these results were 87.3% (85.4– 89.1), Fig. 3. A. Weighted symmetric summary receiver operating curve (sROC), with 95% confidence intervals and prediction
regions around mean operating sensitivity and specificity point. B. Deeks’ funnel plot, with superimposed regression line. No evidence of publication bias C. Bivariate box plot with most studies clustering within the median distribution and some outliers suggesting indirectly the existence of heterogeneity D. Likelihood ratio scattergram.
Table II. Fecal calprotectin diagnostic accuracy (random effects model) according to different cutoff values Calprotectin 48-400 μg/g
All studies (n =49) Calprotectin up to 50 μg//g(Νumber of studies = 7) Calprotectin up to 100 μg /g(Νumber of studies =20) Calprotectin > 100 μg /g(Νumber of studies=29) Pooled Sensitivity (95% CI) 85% (82-87) 90.6% (87.9-92.9) 88.2 % (86.5– 89.8) 80% (77.7-82.2) Pooled Specificity (95% CI) 75% (71-79) 60.7% (53.7-67.4) 67 % (63.3 – 70.6) 78.2% (75.7-80.6) Pooled PLR (95% CI) 3.46 (2.95-4) 2.37 (1.49-3.76) 2.81 (2.15 – 3.69) 3.36 (2.94 - 3. 83) Pooled NLR (95% CI) 0.2 (0.17-0.24) 0.16 (0.1-0.23) 0.18 (0.14- 0.22) 0.24 (0.21-0. 31) Pooled DOR (95% CI) 16.3 (12.9-20.5) 18.2(8.53-38.57) 18.4 (12.37 – 27.6) 14.7 (11.28-19.1)
Pooled AUC (95% CI) 0.88 0.91 0.89 0.86
77.1 % (73.7 – 80.3) and 0.91. These results suggest that the FC test performed better in UC than in CD patients. A possible explanation of this finding might be the extent and severity of the colonic lesions in the two disease groups.
DISCUSSION
This meta-analysis updated older meta-analyses [14, 15] using a larger number of included studies. The results showed that FC has a pooled sensitivity of 85%, specificity of 75%, DOR of 16.3 and AUC of 0.88. These data confirmed the results of the former meta-analyses denoting a good level of overall diagnostic accuracy in estimating bowel mucosal inflammation status in IBD. A novelty of this meta-analysis is the sub-group analysis, which revealed that the FC test performed better in UC (pooled sensitivity 87.3 %, specificity 77.1%, AUC 0.91) than CD (pooled sensitivity 82.4%, specificity 72.1%, AUC 0.84). The modest specificity of this test in CD, i.e. 72.1%, is potentially a problem, since the remaining 27.9% are false positive tests and could lead to treating patients with inactive disease. Other studies have stressed this issue in the literature [29, 50-52].
Nowadays, colonoscopy is considered as the most accurate diagnostic modality and the standard method for estimating the inflammatory status of the intestinal mucosa. Consequently, several endoscopic scoring systems have developed to quantify the endoscopic activity in IBD. However, despite its unequivocal usefulness, colonoscopy carries some disadvantages in that it is invasive, time consuming, expensive, and uncomfortable. In addition, colonoscopy could lead to some undesirable events, which might negatively influence the patient’s health. Therefore, doctors and patients could both benefit from an accurate and accessible laboratory biomarker reflecting intestinal mucosal inflammation. Conventional biomarkers such as ESR, CRP and blood leukocyte count, although useful and widely used in the clinical management of IBD, express systemic patient responses instead of specifically expressing intestinal inflammation. On the contrary, FC is a surrogate marker for the condition of intestinal mucosa. Therefore, it could be important if this test could perform well in distinguishing active from inactive disease. This would be especially significant in IBD patients under treatment, as it could decisively help the clinician in taking important therapeutic decisions.
In the studies included in this meta-analysis there was variation in the cutoff values for the FC test, ranging from 48 to 400 μg/g. In trying to identify an optimum FC cut-off level,
we performed sub-group analyses, i.e. separate meta-analyses of studies at three FC cut off levels, i.e. FC up to 50 μg/g, FC up to 100 μg/g and FC > 100 μg/g. As indicated in Table II, the increase in cutoff value resulted in lower sensitivity and higher specificity. Thus, the best sensitivity of 90% (87.9-92.9) was achieved at the cut-off level of 50 μg/g, whereas the best specificity of 78.2% (75.7-80.6) was achieved for cut-off levels greater than 100 μg/g. Overall, when comparing different cut-off levels, the FC test showed its best performance (sensitivity 90.6%, AUC 0.91) at the cut-off level of 50 μg/g. It seems, therefore, that this cut-off level is optimal for assessing IBD activity and this could be useful in clinical practice. Indeed, apart from our meta-analysis, former meta-analyses [14, 15] have come to a similar conclusion suggesting that in IBD patients with FC <50 μg/g, the likelihood of active disease is very low. On the other hand, this cut-off level has a specificity for active disease of 60.7%, meaning that almost 40% of patients will undergo an unnecessary colonoscopy or treatment escalation by using this cut-off. Especially the upper cut-off level with the higher specificity appropriate for treatment escalation without endoscopy has to be defined by future studies.
The results of our meta-analysis are strengthened by the lack of publication bias. However, the significant heterogeneity found represents a limitation. Similarly, significant heterogeneity was found in a former meta-analysis [15] that included studies with both paediatric and adult patients. We hypothesized that the mixed age groups in their study were responsible for this. However, in our meta-analysis, despite the fact that we included only studies of adult patients the significant heterogeneity still exists. The latter could be the result of the influence of various factors related to lack of standardization concerning design and methodology of the included studies. Thus, factors such as differences in the end point of included studies, spectrum of disease, quality of reporting and different test cut-off points, as detected by the various sensitivity analyses performed, such as the meta-regression analysis, might potentially be confounding factors contributing to overall significant heterogeneity. This could have influenced the interpretation of the results. All the above stress the necessity of standardization in future IBD studies examining the diagnostic accuracy of biomarkers in IBD. However, in our meta-analysis, all limitations mentioned may be compensated by the fact that, in the group of studies evaluated, a relatively large sample size of IBD patients was amenable for analysis.
Table III. Fecal calprotectin diagnostic accuracy (random effects model) according to underlying disease All data sets (n =49) Crohn’s disease (n = 25) Ulcerative colitis (n=21) Pooled Sensitivity (95% CI) 85% (82-87) 82.4% (80.2-84.4) 87.3% (85.4– 89.1) Pooled Specificity (95% CI) 75% (71-79) 72.1% (69-75) 77.1 % (73.7 – 80.3) Pooled PLR (95% CI) 3.46 (2.95-4.04) 2.86 (2.49-3.45) 3.75 (2.73 – 5.15) Pooled NLR (95% CI) 0.2 (0.17-0.24) 0.25 (0.21-0.31) 0.18 (0.15- 0.22) Pooled DOR (95% CI) 16.3 (12.9-20.5) 12.69 (9.92-16.24) 23.22 (15.33 – 35. 1)
Pooled AUC 0.88 0.84 0.91
CI: confidence intervals; PLR: Positive Likelihood Ratio; NLR: Negative Likelihood Ratio; DOR: Diagnostic Odds Ratio; AUC: Area Under Curve
CONCLUSION
The results of this systematic review and meta-analysis show that FC is a highly sensitive diagnostic tool in estimating endoscopic IBD activity. It appears to have greater accuracy when used in UC in comparison to CD at the cut-off level of 50 μg/g. To overcome some limitations raised by the significant heterogeneity found, large and well-designed prospective studies are required to further evaluate the usefulness of this biomarker in clinical practice.
Conflicts of interest: None to declare.
Authors’ contributions: T.R., P.P. and I.E.K. participated in the design
of the study. T.R., P.P. and I.E.K. performed the literature search, study retrieval and data collection. T.R. performed the statistical analysis. T.R., P.P., and I.E.K. wrote the paper. All authors read and approved the final manuscript.
Supplementary material: To access the supplementary material visit
the online version of the J Gastrointestin Liver Dis at http://www. jgld.ro/wp/archive/y2018/n3/a15 and http://dx.doi.org/10.15403/ jgld.2014.1121.273.pti
REFERENCES
1. Xavier RJ, Podolsky DK. Unravelling the pathogenesis of inflammatory bowel disease. Nature 2007;448:427–434. doi:10.1038/nature06005
2. Ponder A, Long MD. A clinical review of recent findings in the epidemiology of inflammatory bowel disease. Clin Epidemiol 2013;5:237–247. doi:10.2147/CLEP.S33961
3. Assadsangabi A, Lobo AJ. Diagnosing and managing inflammatory bowel disease. Practitioner 2013;257:13–18.
4. Gomes P, du Boulay C, Smith CL, Holdstock G. Relationship between disease activity indices and colonoscopic findings in patients with colonic inflammatory bowel disease. Gut 1986;27:92–95. doi:10.1136/ gut.27.1.92
5. Crama-Bohbouth G, Pena AS, Biemond I, et al. Are activity indices helpful in assessing active intestinal inflammation in Crohn’s disease? Gut 1989;30:1236–1240. doi:10.1136/gut.30.9.1236
6. Baars JE, Nuij VJ, Oldenburg B, Kuipers EJ, van der Woude CJ. Majority of patients with inflammatory bowel disease in clinical remission have mucosal inflammation. Inflamm Bowel Dis 2012;18:1634–1640. doi:10.1002/ibd.21925
7. Foell D, Wittkowski H, Roth J. Monitoring disease activity by stool analyses: from occult blood to molecular markers of intestinal inflammation and damage. Gut 2009;58:859–868. doi:10.1136/ gut.2008.170019
8.. Stange EF, Travis SP, Vermeire S, et al. European evidence-based Consensus on the diagnosis and management of ulcerative colitis: definitions and diagnosis. J Crohns Colitis 2008;2:1–23. doi:10.1016/j. crohns.2007.11.001
9. Van Assche G, Dignass A, Panes J, et al. The second European evidence based consensus on the diagnosis and management of Crohn’s disease: definitions and diagnosis. J Crohns Colitis 2010;4:7–27. doi:10.1016/j. crohns.2009.12.003
10. Roseth AG, Schmidt PN, Fagerhol MK. Correlation between faecal excretion of indium-111-labelled granulocytes and calprotectin, a granulocyte marker protein, in patients with inflammatory bowel disease. Scand J Gastroenterol 1999;34:50–54. doi:10.1080/00365529950172835
11. Vermeire S, Van Assche G, Rutgeerts P. Laboratory markers in IBD: useful, magic, or unnecessary toys? Gut 2006;55:426–431. doi:10.1136/ gut.2005.069476
12. Schoepfer AM, Trummler M, Seeholzer P, Seibold-Schmid B, Seibold F. Discriminating IBD from IBS: comparison of the test performance of fecal markers, blood leukocytes, CRP, and IBD antibodies. Inflamm Bowel Dis 2008;14:32–39. doi:10.1002/ibd.20275
13. Roseth AG, Fagerhol MK, Aadland E, Schjønsby H. Assessment of the neutrophil dominating protein calprotectin in feces. A methodologic study. Scand J Gastroenterol 1992;27:793–798. doi:10.3109/00365529209011186
14. Lin JF, Chen JM, MD, Zuo JH, et al. Meta-analysis: Fecal Calprotectin for Assessment of Inflammatory Bowel Disease Activity. Inflamm Bowel Dis 2014;20:1407–1415. doi:10.1097/MIB.0000000000000057
15. Mosli MH, Zou G, Garg SK, et al. C-Reactive Protein, Fecal Calprotectin, and Stool Lactoferrin for Detection of Endoscopic Activity in Symptomatic Inflammatory Bowel Disease Patients:A Systematic Review and Meta-Analysis. Am J Gastroenterol 2015;110:802–819. doi:10.1038/ajg.2015.120
16. Whiting PF, Rutjes AW, Westwood ME, et al; QUADAS-2 Group. QUADAS-2: a revised tool for the quality assessment of diagnostic accuracy studies. Ann Intern Med 2011;155:529-536. doi: 10.7326/0003-4819-155-8-201110180-00009
17. Mantel N, Haenszel W. Statistical aspects of the analysis of data from retrospective studies of disease. J Natl Cancer Inst 1959;22:719–748. doi:10.1093/jnci/22.4.719
18. DerSimonian R, Laird N. Meta-analysis in clinical trials. Control Clin Trials 1986;7:177–188. doi:10.1016/0197-2456(86)90046-2
19. Moses LE, Shapiro D, Littenberg B. Combining independent studies of a diagnostic test into a summary ROC curve: data-analytic approaches and some additional considerations. Stat Med 1993;12:1293–1316. doi:10.1002/sim.4780121403
20. Hanley JA, McNeil BJ. The meaning and use of the area under a receiver operating characteristic (ROC) curve. Radiology 1982;143:29–36. doi:10.1148/radiology.143.1.7063747
21. Zamora J, Abraira V, Muriel A, Khan K, Coomarasamy A. Meta-DiSc: a software for meta-analysis of test accuracy data. BMC Med Res Methodol 2006;6:31. doi:10.1186/1471-2288-6-31
22. Cochran WG. The combination of estimates from different experiments. Biometrics 1954;10:101–129. doi:10.2307/3001666
23. Higgins JP, Thompson SG. Quantifying heterogeneity in a meta-analysis. Stat Med 2002;21:1539–1558. doi:10.1002/sim.1186
24. Deeks JJ. Macaskill P, Irwig L. The performance of tests of publication bias and other sample size effects in systematic reviews of diagnostic test accuracy was assessed. J Clin Epidemiol 2005;58:882-893. doi:10.1016/j. jclinepi.2005.01.016
25. Sipponen T, Savilahti E, Kolho KL, Nuutinen H, Turunen U, Färkkilä M. Crohn’s disease activity assessed by fecal calprotectin and lactoferrin: correlation with Crohn’s disease activity index and endoscopic findings. Inflamm Bowel Dis 2008;14:40–46. doi:10.1002/ibd.20312
26. Langhorst J, Elsenbruch S, Koelzer J, et al. Noninvasive markers in the assessment of intestinal inflammation in inflammatory bowel diseases: performance of fecal lactoferrin, calprotectin, and PMN-elastase, CRP, and clinical indices. Am J Gastroenterol 2008;103:162–169. doi:10.1111/j.1572-0241.2007.01556.x
27. Vieira A, Fang CB, Rolim EG, et al. Inflammatory bowel disease activity assessed by fecal calprotectin and lactoferrin: correlation with laboratory parameters, clinical, endoscopic and histological indexes. BMC Res Notes 2009;2:221. doi:10.1186/1756-0500-2-221
28. Schoepfer AM, Beglinger C, Straumann A, Trummler M, Renzulli P, Seibold F. Ulcerative colitis: correlation of the Rachmilewitz endoscopic activity index with fecal calprotectin, clinical activity, C reactive protein, and blood leukocytes. Inflamm Bowel Dis 2009;15:1851–1858. doi:10.1002/ibd.20986
29. Schoepfer AM, Beglinger C, Straumann A, et al. Fecal calprotectin correlates more closely with the simple endoscopic score for Crohn’s disease (SES-CD) than CRP, blood leukocytes, and the CDAI. Am J Gastroenterol 2010;105:162–169. doi:10.1038/ajg.2009.545
30. af Bjorkesten CG, Nieminen U, Turunen U, Arkkila P, Sipponen T, Färkkilä M. Surrogate markers and clinical indices, alone or combined, as indicators for endoscopic remission in anti-TNF-treated luminal Crohn’s disease. Scand J Gastroenterol 2012;47:528–537. doi:10.3109/ 00365521.2012.660542
31. D’Haens G, Ferrante M, Vermeire S, et al. Fecal calprotectin is a surrogate marker for endoscopic lesions in inflammatory bowel disease. Inflamm Bowel Dis 2012;18:2218–2224. doi:10.1002/ibd.22917
32. Onal IK, Beyazit Y, Sener B, et al. The value of fecal calprotectin as a marker of intestinal inflammation in patients with ulcerative colitis. Turk J Gastroenterol 2012;23:509–514. doi:10.4318/tjg.2012.0421
33. Lobaton T, Rodriguez-Moranta F, Lopez A, Sánchez E, Rodríguez-Alonso L, Guardiola J. A new rapid quantitative test for fecal calprotectin predicts endoscopic activity in ulcerative colitis. Inflamm Bowel Dis 2013;19:1034–1042. doi:10.1097/MIB.0b013e3182802b6e
34. Schoepfer AM, Beglinger C, Straumann A, et al. Fecal calprotectin more accurately reflects endoscopic activity of ulcerative colitis than the Lichtiger Index, C-reactive protein, platelets, hemoglobin, and blood leukocytes. Inflamm Bowel Dis 2013;19:332–341. doi:10.1097/ MIB.0b013e3182810066
35. Nancey S, Boschetti G, Moussata D, et al. Neopterin is a novel reliable fecal marker as accurate as calprotectin for predicting endoscopic disease activity in patients with inflammatory bowel diseases. Inflamm Bowel Dis 2013;19:1043–1052. doi:10.1097/ MIB.0b013e3182807577
36. Yamamoto T, Shiraki M, Bamba T, Umegae S, Matsumoto K. Faecal calprotectin and lactoferrin as markers for monitoring disease activity and predicting clinical recurrence in patients with Crohn’s disease after ileocolonic resection:a prospective pilot study. United European Gastroenterol J 2013;1:368–374. doi:10.1177/2050640613501818
37. Lobaton T, Lopez-Garcia A, Rodriguez-Moranta F, Ruiz A, Rodríguez L, Guardiola J. A new rapid test for fecal calprotectin predicts endoscopic remission and postoperative recurrence in Crohn’s disease. J Crohns Colitis 2013;7:e641–e651. doi:10.1016/j.crohns.2013.05.005
38. Mooiweer E, Fidder HH, Siersema PD, Laheij RJ, Oldenburg B. Fecal Hemoglobin and Calprotectin Are Equally Effective in Identifying Patients with Inflammatory Bowel Disease with Active Endoscopic Inflammation. Inflamm Bowel Dis 2014;20:307–314. doi:10.1097/01. MIB.0000438428.30800.a6
39. Naismith GD, Smith LA, Barry SJ, et al. A prospective evaluation of the predictive value of faecal calprotectin in quiescent Crohn’s disease. J Crohns Colitis 2014;8:1022-1029. doi:10.1016/j.crohns.2014.01.029
40. Boschetti G, Laidet M, Moussata D, et al. Levels of Fecal Calprotectin Are Associated with the Severity of Postoperative Endoscopic Recurrence in Asymptomatic Patients with Crohn’s Disease. Am J Gastroenterol 2015;110:865–872. doi:10.1038/ajg.2015.30
41. Falvey JD, Hoskin T, Meijer B, et al. Disease Activity Assessment in IBD:Clinical Indices and Biomarkers Fail to Predict Endoscopic Remission. Inflamm Bowel Dis 2015;21:824–831. doi:10.1097/ MIB.0000000000000341
42. Goutorbe F, Goutte M, Minet-Quinard R, et al. Endoscopic Factors Influencing Fecal Calprotectin Value in Crohn’s Disease. J Crohns Colitis 2015;9:1113-1119. doi:10.1093/ecco-jcc/jjv150
43. Hosseini SV, Jafari P, Taghari SA, et al. Fecal Calprotectin is an Accurate Tool and Correlated to Seo Index in Prediction of Relapse in Iranian Patients with Ulcerative Colitis. Iran Red Crescent Med J 2015;17:e22796. doi:10.5812/ircmj.22796
44. Kristensen V, Klepp P, Cvancarova M, Røseth A, Skar V, Moum B. Prediction of endoscopic disease activity in ulcerative colitis by two different assays for fecal calprotectin. J Crohns Colitis 2015;9:164-169. doi:10.1093/ecco-jcc/jju015
45. Kwapisz L, Mosli M, Chande N, et al. Rapid fecal calprotectin testing to assess for endoscopic disease activity in inflammatory bowel disease: A diagnostic cohort study. Saudi J Gastroenterol 2015;21:360-366. doi:10.4103/1319-3767.170948
46. Buisson A, Vazeille E, Minet-Quinard R, et al. Faecal chitinase 3-like 1 is a reliable marker as accurate as faecal calprotectin in detecting endoscopic activity in adult patients with inflammatory bowel diseases. Aliment Pharmacol Ther 2016;43:1069–1079. doi:10.1111/apt.13585
47. Inokuchi T, Kato J, Hiraoka S, et al. Fecal Immunochemical Test Versus Fecal Calprotectin forPrediction of Mucosal Healing in Crohn’s Disease. Inflamm Bowel Dis 2016;22:1078–1085. doi:10.1097/ MIB.0000000000000728
48. Bodelier AG, Jonkers D, van den Heuvel T, et al. High Percentage of IBD Patients with Indefinite Fecal Calprotectin Levels:Additional Value of a Combination Score. Dig Dis Sci 2017;62:465–472. doi:10.1007/ s10620-016-4397-6
49. Chen JM, Liu T, Gao S, Tong XD, Deng FH, Nie B. Efficacy of noninvasive evaluations in monitoring inflammatory bowel disease activity: a prospective study in China. World J Gastroenterol 2017;23:8235-8247. doi:10.3748/wjg.v23.i46.8235
50. Sipponen T, Nuutinen H, Turunen U, Färkkilä M. Endoscopic evaluation of Crohn’s disease activity: comparison of the CDEIS and the SES-CD. Inflamm Bowel Dis 2010;16:2131–2136. doi:10.1002/ibd.21300
51. Inoue K, Aomatsu T, Yoden A, Okuhira T, Kaji E, Tamai H. Usefulness of a novel and rapid assay system for fecal calprotectin in pediatric patients with inflammatory bowel diseases. J Gastroenterol Hepatol 2014;29:1406–1412. doi:10.1111/jgh.12578
52. D’Inca R, Pont E, Di Leo V et al. Calprotectin and lactoferrin in the assessment of intestinal inflammation and organic disease. Int J Colorectal Dis 2007;22:429–437. doi:10.1007/s00384-006-0159-9
Supplementary Fig. 1. Sensitivity analyses, with graphical depiction of: A. residual-based goodness-of-fit, B. bivariate normality, C. influence analyses, D. outlier detection analyses.
Supplementary Fig. 2. A. Fagan’s nomogram for showing post-test probability of IBD activity after FC-positive result (upper line) and FC-negative result (lower line). B. Probability modifying
plot C. Forest plot of multiple univariable meta-regression and subgroup analyses for detection of