A PROCEDURE FOR THE ASSESSMENT OF THE
BEHAVIOUR FACTOR FOR STEEL MOMENT RESISTING
FRAME SYSTEMS BASED ON PUSHOVER CURVES
A Dissertation Presented By
Amin Alavi
Submitted to the Graduate School of the Politecnico di Milano in Partial Fulfillment of the Requirements for the Degree of
DOCTOR OF PHILOSOPHY
March 2019
Department of Architecture, Built Environment and Construction Engineering (ABC)
Supervisor
Prof. Carlo Andrea Castiglioni
Tutor
II
Dedicated To
My Father, who took keen interest in my work and guided me all along, till the completion of the book by providing all the necessary information for developing a good system.
My Mother, for her unlisted encouragement and moreover for her timely support and guidance till the completion of the book.
Finally, to my incredible Wife and partner in everything where words fail me, but I will try anyway. Having her in my life has been the most precious gift that anyone could have ever asked for.
III
Acknowledgments
The success and final outcome of this dissertation required a lot of guidance and assistance from many people and I am extremely fortunate to have got this all along the completion of my work. Whatever I have done is only due to such guidance and assistance and I would not forget to thank them.
I have very much enjoyed being a Ph.D. candidate in the Politecnico di Milano, department of Architecture, Built Environment and Construction Engineering. It has been a most friendly and stimulating place to research and study. I am indebted to the department of ABC for allowing me the opportunity to research.
Professor Castiglioni has been an excellent supervisor. Despite his many responsibilities as a professor of Civil Engineering, he has always made time to discuss and challenge my ideas for which I am most grateful. I would like to thank him for being so helpful and for being straightforward in his advice and comments throughout the time spent in the Politecnico di Milano. Under his supervision, I was able to gain a priceless set of skills that allowed me to finish my work in a better manner than I had anticipated.
My sincere thanks also go to NTUA group, who provided me an opportunity to join their team, and giving access to their research facilities. Without they precious support it would not be possible to conduct this research.
I feel especially lucky for crossing paths with Professor Enrico de Angelis, who is one of the smartest and kindest people I have ever met.
Amin Alavi March 2019
IV
ABSTRACT
The purpose of this dissertation was to calculate/obtain the behaviour factor for steel moment resisting frame systems by means of re-analysis of a pushover curve which can be conveniently applied in everyday practice due to its simplicity. Presently, FEMA P-695 provides a procedure for the definition of the behaviour factor by re-analysis of the push over curve. In Europe, such a method is not yet proposed by EC8 and only ECCS provides some recommendations. Furthermore, the reference parameters to obtain the behaviour factor are defined by each code in a different way which results in a wide variety of possible choices and resulting output. In order to overcome this kind of problem, first, all possible definitions of the reference overstrength and ductility parameters which may be used for all types of structures will be discussed in this research. Then, standard re-analysis procedure of the results of the pushover analysis will be introduced.
The influence of different choices of such parameters in the assessment of the behaviour factor will be investigated in 102 case studies of different composite steel-concrete MRF buildings, each designed with increasing values of the behaviour factor from 2.0 to 7.0. The case studies employ 96 conventional steel-concrete MRF buildings and 6 non-conventional MRF structures. Nonlinear static analysis (PushOver) is conducted for each type of structure to provide an estimate of overstrength and the ductility factor based on different possible selection of the reference parameters defined in the current seismic codes. The re-analysis of the obtained results is presented and discussed.
On the other hand, the current structural design procedure, however, doesn’t assure that the “actual” behaviour factor (= the actual ductility of the structure) will coincide with the “assumed” one (= behaviour factor given by the codes), so that most of the time results in over-designing the structures. As a result, design engineers never tend to optimize their design using more advanced procedures, due to the complexity of these methods. This might be overcome through the definition of a new step in the design scenario before seismic analysis in order to identify the real behaviour factor based on the proposed methodology.
In the same way, the initial construction cost of a building has been always an important parameter. The design optimization objective is to minimize the initial structural cost/weight. It is evident that the lower the actions in a structure, the less need for materials required for a
V strength based design of the structure. But, it is not always so, due to other factors, such as the limits imposed by the codes and allowable inter-storey drift, which will prevent reduction of member’s sizes and stiffness. The current research will present a novel strategy for an optimal design of steel structures in high seismic zones through balancing the initial cost and the lifetime seismic damage. The investigation will be performed in order to explore the relationship between the expected initial material cost and the design behaviour factor.
Incremental Dynamic Analysis is subsequently performed to obtain a refined representation of response throughout the desired range of seismic intensity measure. The so-called average spectral acceleration is used to illustrate the severity of the ground motions. The dynamic analysis results for the considered modes of failure are conveniently summarised into fragility functions, which are further convoluted with the seismic hazard function in order to derive the associated mean annual frequency of exceedance. Further the Ballio-Setti’s methodology is investigated to approve the behaviour factor obtained by means of re-analysis of the pushover curve.
The results introduce an optimal method to define a consistent behaviour factor for moment resisting frame systems based on the re-analysis of the pushover curves. The results are also approved by the incremental dynamic analysis. Finally, a novel strategy for an optimal design of steel structures in high seismic zones through balancing the initial cost and the lifetime seismic damage is presented.
Keywords: Behaviour Factor, Pushover, Nonlinear Analysis, Incremental Dynamic Analysis, MRF Systems and Behaviour Factor Assessment
VI
SOMMARIO
Scopo di questa tesi è la valutazione del fattore di struttura (q-factor) per strutture a telaio in acciaio mediante una rielaborazione della curva pushover che possa essere convenientemente applicata nella pratica quotidiana grazie alla sua semplicità.
Ad oggi, solo la normativa FEMA P-695 fornisce una procedura per la definizione del fattore q basata sulla rielaborazione della curva pushover. In Europa, un metodo simile non è previsto dalll'EC8, mentre l’ECCS fornisce solo alcune raccomandazioni in merito.
Inoltre, le varie Normative antisismiche più recenti definiscono in modo differente i parametri di riferimento per la valutazione del fattore di struttura. Questo si traduce in un'ampia varietà di scelte possibili, che vengono lasciate al progettista; conseguenza di ciò è che, nella pratica progettuale, il q-factor per una stessa struttura può essere attualmente stimato in modo differente da differenti professionisti, a seconda della Normativa adottata e della combinazione dei parametri di riferimento scelti.
Per superare questo problema, in questa ricerca verranno discusse tutte le possibili definizioni dei parametri di sovra-resistenza e duttilità, proposti da varie Normative, che possono essere utilizzati per vari tipi di strutture. Quindi, verrà introdotta una procedura standard di rielaborazione dei risultati dell'analisi pushover.
L'influenza delle diverse scelte di tali parametri nella valutazione del fattore di comportamento è stata studiata in 102 casi di studio di diversi edifici con struttura intelaiata tipo MRF composta acciaio-calcestruzzo, ciascuno progettato con valori crescenti del fattore di struttura, da 2.0 a 7.0. I casi studio analizzati comprendono 96 edifici MRF a struttura acciaio-calcestruzzo convenzionale e 6 strutture MRF non convenzionali con collegamenti dissipativi / fusibili strutturali.
L'analisi statica non lineare (PushOver) è stata condotta per le varie strutture, ottenendo, in funzione delle diverse possibili combinazioni dei parametri di riferimento, una stima della sovraresistenza e del fattore di duttilità.
D'altro canto, la pratica corrente non assicura che il fattore di comportamento "effettivo" (= la duttilità effettiva della struttura) coinciderà con quello "assunto" in fase di progetto (= fattore di comportamento derivato dalle indicazioni di normativa).
VII Ciò crea una serie di incertezze in merito al dimensionamento delle strutture, che potrebbero essere superate solo a patto di adottare metodi di progettazione avanzati, che sono molte volte incompatibili con la normale pratica progettuale, e che sono adatti esclusivamente a scopo scientifico.
La proposta sviluppata in questo lavoro di tesi mira al superamento di tale situazione mediante una stima dell’effettivo valore del coefficiente di struttura da effettuarsi mediante un’analisi di push-over sul modello strutturale, a valle del dimensionamento per carichi gravitazionali, ma prima di eseguire l’analisi sismica.
Ovviamente, l’individuazione della “combinazione ottimale” dei parametri di riferimento può essere effettuata solo sulla base di un confronto (in termini di q-factor) tra i risultati ottenibili con l’analisi semplificata (push-over) e quello “effettivo” della struttura stessa. Quest’ultimo valore di confronto, in questa tesi è stato ottenuto mediante una serie di Analisi Dinamiche Incrementali (IDA), considerando i possibili effetti non-lineari, in termini di comportamento dei materiali e di geometria delle strutture in esame.
Dal confronto tra i risultati ottenuti mediante analisi push-over e IDA è stato possibile identificare il metodo di combinazione dei parametri di riferimento che porta ad una minimizzazione dell’errore in termini di fattore di struttura.
Infine, viene presentata una nuova strategia per una progettazione ottimale delle strutture in acciaio in zone sismiche attraverso un bilanciamento tra costo iniziale e danno conseguente ad eventi sismici.
Il costo iniziale di costruzione di un edificio è sempre stato un parametro importante. L'obiettivo di ottimizzazione del progetto è la minimizzazione del costo / peso strutturale iniziale. È evidente che minore sono le azioni che impegnano una struttura, minore è la “richiesta” in termini di sezioni portanti (=peso dei materiali) necessari secondo una progettazione in termini di resistenza.
Altri fattori, quali ad esempio le limitazioni imposte dalla normativa agli spostamenti di interpiano, impediscono una riduzione delle dimensioni e della rigidezza delle membrature.
L’ultima parte di questa tesi presenta una nuova strategia per una progettazione ottimale delle strutture in acciaio in zone ad elevata sismicità, attraverso un bilanciamento del costo iniziale e del danno sismico nel corso della vita utile. L'indagine verrà condotta al fine di esplorare la relazione tra il costo del materiale iniziale previsto e il fattore di struttura adottato in fase di progetto.
VIII
Table of Contents
1 INTRODUCTION ... 1
1.1 A Short Introduction on the Behaviour Factor ... 1
1.2 Problem Statement ... 3
1.3 The Research Goals ... 7
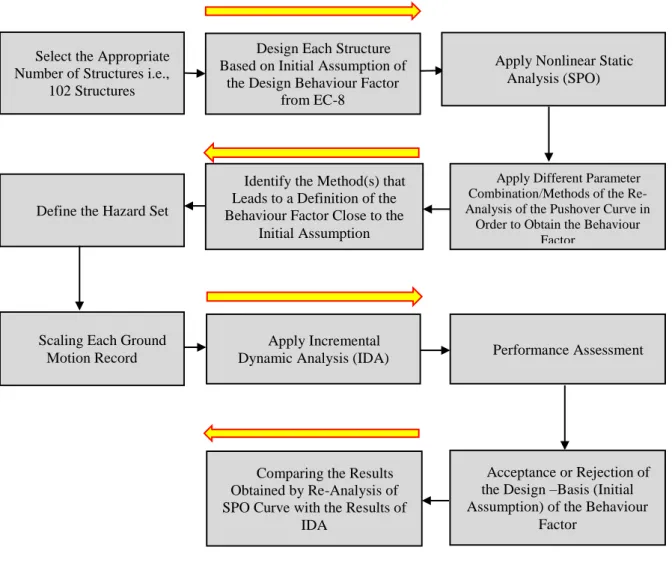
1.4 Proposed Methodology to Achieve the Research Goals ... 8
1.5 Organisation of Dissertation ... 10
2 STATE OF THE ART ... 13
2.1 Historical Perspective of the Behaviour Factor ... 13
2.2 The Role of the Behaviour Factor ... 14
2.3 The Behaviour Factor Definitions on Modern Seismic Codes ... 15
2.3.1 European Approach ... 15
2.3.2 American Approach ... 19
2.3.3 Japanese Approach... 20
2.4 Behaviour Factor Assessment Methods ... 21
2.4.1 Ductility-Dependent Factor Theory ... 21
2.4.2 Extrapolation of Nonlinear Inelastic Dynamic Response Analysis of SDOFS22 2.4.3 Energy Approach ... 23
2.4.4 Damage Accumulations Method... 23
3 RESEARCH METHODOLOGY... 27
3.1 Proposed Behavior Factor Evaluation Procedure Based on Re-Analysis of the Pushover Curve ... 28
3.1.1 Introduction ... 28
3.1.2 Definition of the Reference Parameters ... 29
3.2 Evaluation of the Behaviour Factor via Incremental Dynamic Analysis ... 34
IX
3.2.2 Records Scaling ... 36
3.2.3 Limit-State Definition on IDA Curve ... 36
3.2.4 Acceptance or Rejection of the Initial Assumption of the Design-Basis Behaviour Factor ... 38
3.2.5 A Method for the Calculative Determination of the Behaviour Factor via IDA…………..………..………..………..………..………..………..………..…………40
4 CASE STUDIES ... 45
4.1 General Assumptions ... 45
4.2 Description of the Buildings ... 45
4.2.1 Material ... 45
4.2.2 Loads and load combinations... 46
4.2.3 Typical MRF Buildings (Conventional Structures) ... 47
4.2.4 Innovative Dissipative FUSEIS Bolted & welded Beam Splices For Non-Conventional Structures ... 50
4.3 Analysis and Design ... 53
4.3.1 Current Steel Design and Seismic Design Provision Requirements ... 53
4.3.2 Design Principal of the Beam Splices as Non-Conventional Structures ... 55
4.3.3 Modeling and Simulation ... 59
4.3.4 Seismic Design Situation ... 59
4.3.5 Response Spectrum Analysis ... 60
4.4 Design Summary ... 63
4.4.1 Typical MRF Buildings (Conventional Buildings)... 64
4.4.2 Innovative Dissipative FUSEIS Bolted & Welded Beam Splices (Non-Conventional Structures) ... 64
4.5 Response Spectrum and Modal Analysis Results ... 67
5 SEISMIC ANALYSIS RESULTS AND DISCUSSION ... 73
5.1 Nonlinear Static Analysis (Push-Over) ... 73
X
5.1.2 Lateral Load Pattern Selection ... 75
5.1.3 Modeling and Simulations ... 75
5.1.4 Numerical Results ... 77
5.1.5 Discussion of the Results of Pushover Analysis ... 82
5.2 Incremental Dynamic Analysis (IDA) ... 88
5.2.1 Modeling and Simulations ... 88
5.2.2 Acceptance or Rejection of the Initial Assumption of the Design Behaviour Factor………..………..………..………..………..………..………..………..…………89
6 BEHAVIOUR FACTOR ESTIMATION ... 95
6.1 Behaviour Factor Calculations Based on Re-Analysis of the Pushover Curve ... 95
6.1.1 Behaviour Factor Acceptance (qacc) ... 95
6.1.2 Typical MRF Buildings (Conventional Structures) ... 96
6.1.3 Innovative Dissipative FUSEIS Bolted & welded Beam Splices (Non-Conventional Structures) ... 99
6.1.4 The Optimal Methods ... 101
6.1.5 Optimal Methods and Discussion of the Results ... 102
6.1.6 Behaviour Factor Calculations via Incremental Dynamic Analysis (IDA) ... 120
7 CONCLUDING REMARKS ... 129
7.1 Future Work Developments ... 133
8 REFERENCES ... 135 9 APPENDICES ... 143 9.1 APPENDIX-A... 143 9.2 APPENDIX-B ... 146 9.3 APPENDIX-C ... 155 9.4 APPENDIX-D-1 ... 163 9.5 APPENDIX-D-2 ... 175 9.6 APPENDIX-E-1 ... 176 9.7 APPENDIX-E-2 ... 188
XI
9.8 APPENDIX-F-1 ... 190
9.9 APPENDIX-F-2 ... 202
9.10 APPENDIX-G-1 ... 204
9.10.1 12-Storey 3Bays and 6m Length of the Bay ... 204
9.10.2 8-Storey 3Bays and 6m Length of the Bay ... 206
9.10.3 4-Storey 3Bays and 6m Length of the Bay ... 209
9.10.4 2-Storey 3Bays and 6m Length of the Bay ... 210
9.10.5 12-Storey 3Bays and 8m Length of the Bay ... 211
9.10.6 8-Storey 3Bays and 8m Length of the Bay ... 214
9.10.7 4-Storey 3Bays and 8m Length of the Bay ... 217
9.10.8 2-Storey 3Bays and 8m Length of the Bay ... 218
9.10.9 12-Storey 4Bays and 6m Length of the Bay ... 219
9.10.10 8-Storey 4Bays and 6m Length of the Bay ... 222
9.10.11 4-Storey 4Bays and 6m Length of the Bay ... 224
9.10.12 2-Storey 4Bays and 6m Length of the Bay ... 225
9.10.13 12-Storey 4Bays and 8m Length of the Bay ... 226
9.10.14 8-Storey 4Bays and 8m Length of the Bay ... 229
9.10.15 4-Storey 4Bays and 8m Length of the Bay ... 232
9.10.16 2-Storey 4Bays and 8m Length of the Bay ... 233
9.11 APPENDIX-G-2 ... 234
9.11.1 8-Storey 3Bays and 6m Length of the Bay ... 234
9.11.2 4-Storey 3Bays and 6m Length of the Bay ... 235
9.11.3 2-Storey 3Bays and 6m Length of the Bay ... 236
9.12 APPENDIX-G-3 ... 237
9.12.1 3Bays and 6m Length of the Bay ... 237
9.12.2 3Bays and 8m Length of the Bay ... 239
XII 9.12.4 4Bays and 8m Length of the Bay ... 243 9.13 APPENDIX-H... 246
XIII
List of Figures
Figure 1-1 Behaviour Factor Definition ... 2
Figure 1-2 General Structural Design Process ... 5
Figure 1-3 New Design Procedure with Augmented Efficiency... 6
Figure 1-4 Research Flowchart ... 9
Figure 2-1 Force-Displacement Response of Elastic and Inelastic System ... 16
Figure 2-2 The Structural Ductility and the System Ductility Relationship According to Newmark and Hall Definition for a) Short Period (Equal Acceleration) b) Moderate Period (Equal Energy) c) Long Period (Equal Displacement) ... 18
Figure 2-3 Base Shear vs. Top Roof Displacement in American Approach [54] ... 20
Figure 2-4 Evaluating of q Factor on The Basis of Ductility Factor Theory [22] ... 22
Figure 2-5 Evaluating of q Factor on The Basis of The Response of SDOF Systems ... 22
Figure 2-6 A Comparison between a) Ductility Theory and b) Energy Approach ... 23
Figure 3-1 Collapse Mechanism Typologies for Moment-Resisting Frames under Seismic Horizontal Forces ... 28
Figure 3-2 Behaviour Factor Evaluation Procedure ... 29
Figure 3-3 Behaviour Factor Evaluation Procedure based on the Nonlinear Static Analysis ... 34
Figure 3-4 Europe Seismic Hazard Map ... 35
Figure 3-5 Hazard Curves for the Three European Sites for AvgSa with a Period Range of [0.3s, 3.0s] and an Increment of 0.2s ... 35
Figure 3-6 Design-Basis Behaviour Factor Acceptance Procedure [79] ... 40
Figure 3-7 The Relationship between the Response of the Structure, the Behaviour Factor and the Intensity of the Acceleration ... 41
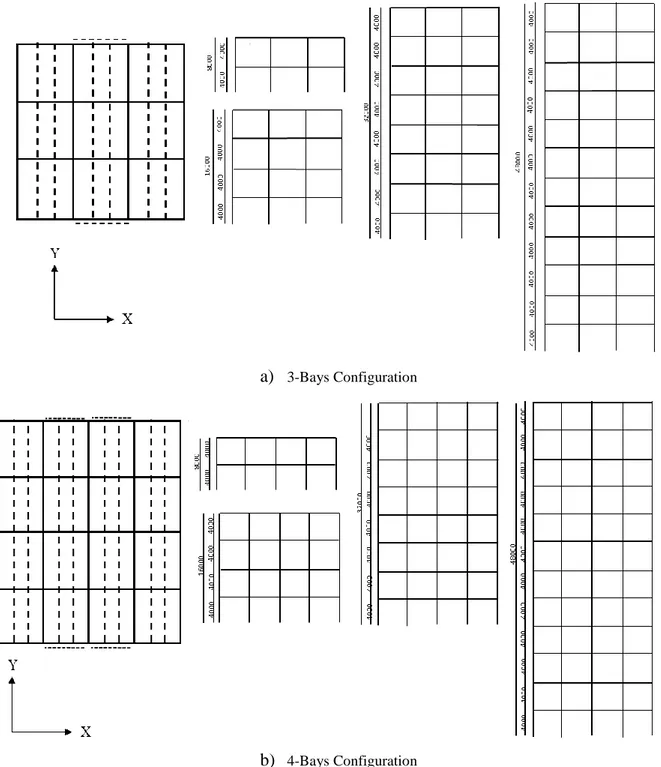
Figure 4-1 Schematic View of Plan and Elevation of 2/4/8 and 12-story of the typical MRF structures a) 3-Bays Configuration b) 4-Bays Configuration (diameter in mm) ... 48
Figure 4-2 Schematic View of an Example of 8-Storey 3-Bays having the Length of the Bay Equal to 8m ... 49
Figure 4-3 Dissipative Beam Splices a) Bolted b) Welded ... 51
Figure 4-4 Bolted Beam Splice Main Section Elements ... 51
Figure 4-5 Schematic View of Plan and Elevation of the 2/4/8-story of non-conventional building (diameter in mm) ... 52
XIV
Figure 4-6 Schematic View of An Example of Non-Conventional 2-Storey Building ... 53
Fig. 4-7: Buckling mechanism of the FUSEIS ... 57
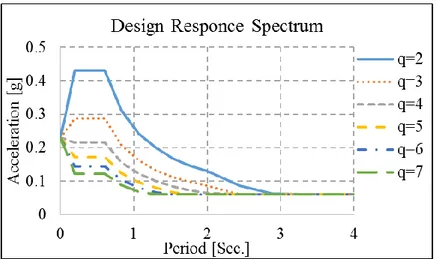
Figure 4-8 Shape of Design Response Spectrum ... 63
Figure 4-9 Design Response Spectrum for Different Values of Behaviour Factor ... 63
Figure 4-10 Designed Composite Slab Section ... 64
Figure 4-11 Plan View of the Typical Non-Conventional Structure. Blue Lines Illustrate the X-Bracing System, Whereas the Red Lines Imply the Beam Splices ... 65
Figure 4-12 Resistance Capacity Ratio for Beam Splices 1, 2 and 3 ... 66
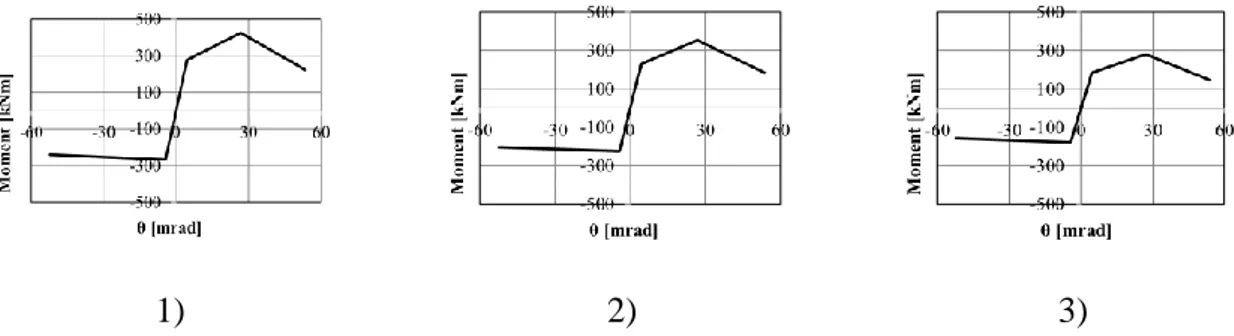
Figure 4-13 Beam Splices constitutive law in Terms of Moment-Rotation 1) 170x12mm 2) 170x10mm 3) 170x8mm ... 66
Figure 4-14 Distribution of Assigned Bolted and Welded Beam Splices ... 67
Figure 4-15 Inter-Storey Drift for Buildings Having 3B-6m ... 68
Figure 4-16 Inter-Storey Drift for Buildings Having 3B-8m ... 69
Figure 4-17 Inter-Storey Drift for Buildings Having 4B-6m ... 69
Figure 4-18 Inter-Storey Drift for Buildings Having 4B-8m ... 70
Figure 5-1 Summary of Lumped Plasticity Modelling-Approach for Non-Conventional Structures ... 77
Figure 5-2 Pushover Curves for Buildings Having 3B-6m ... 78
Figure 5-3 Pushover Curves for Buildings Having 3B-8m ... 78
Figure 5-4 Pushover Curves for Buildings Having 4B-6m ... 79
Figure 5-5 Pushover Curves for Buildings Having 4B-8m ... 79
Figure 5-6 Non Linear Pushover Analysis-the Formation of Plastic Hinges at the Displacement Equal to 60cm (δ= 60cm) for Conventional Structures ... 80
Figure 5-7 Push-Over Curve for 2, 4 and 8 Storey-Building Having Bolted and Welded Beam Splices (Non-Conventional Structures) ... 81
Figure 5-8 Non Linear Pushover Analysis-the Formation of Plastic Hinges at the Displacement Equal to 60cm (δ= 60cm), a) Bolted Beam Splices, b) Welded Beam Splices 82 Figure 5-9 Global Plastic Mechanism of 8 Storey Bolted/Welded Beam Splices at δ= 60cm ... 82
Figure 5-10 Behaviour Factor vs. Normalized Base Shear for Buildings Having 3B-6m .. 83
Figure 5-11 Behaviour Factor vs. Normalized Base Shear for Buildings Having 3B-8m .. 84
Figure 5-12 Behaviour Factor vs. Normalized Base Shear for Buildings Having 4B-6m .. 84
Figure 5-13 Behaviour Factor vs. Normalized Base Shear for Buildings Having 4B-8m .. 84
XV
Figure 5-15 Fragility Curves for 12S-3B-6m ... 91
Figure 6-1 Optimal Methods to Define the Behaviour Factor ... 101
Figure 6-2 The Ductility Factor if Designed by q=7 ... 103
Figure 6-3 The Overstrength Factor if Designed by q=7 ... 103
Figure 6-4 The Calculated Behaviour Factor if Designed by q=7 ... 104
Figure 6-5 The Ductility Factor if Designed by q=6 ... 105
Figure 6-6 The Overstrength Factor if Designed by q=6 ... 105
Figure 6-7 The Calculated Behaviour Factor if Designed by q=6 ... 106
Figure 6-8 The Ductility Factor if Designed by q=5 ... 108
Figure 6-9 The Overstrength Factor if Designed by q=5 ... 108
Figure 6-10 The Calculated Behaviour Factor if Designed by q=5 ... 109
Figure 6-11 The Ductility Factor if Designed by q=4 ... 111
Figure 6-12 The Overstrength Factor if Designed by q=4 ... 111
Figure 6-13 The Calculated Behaviour Factor if Designed by q=4 ... 111
Figure 6-14 The Ductility Factor if Designed by q=3 ... 113
Figure 6-15 The Overstrength Factor if Designed by q=3 ... 113
Figure 6-16 The Calculated Behaviour Factor if Designed by q=3 ... 114
Figure 6-17 The Ductility Factor if Designed by q=2 ... 115
Figure 6-18 The Overstrength Factor if Designed by q=2 ... 115
Figure 6-19 The Calculated Behaviour Factor if Designed by q=2 ... 116
Figure 6-20 The Ductility Factor if qacc=3.5 ... 117
Figure 6-21 The Overstrength Factor if qacc=3.5 ... 117
Figure 6-22 The Calculated Behaviour Factor if qacc=3.5 ... 118
Figure 6-23 The Ductility Factor if qacc=4.5 ... 118
Figure 6-24 The Overstrength Factor if qacc=4.5 ... 119
Figure 6-25 The Calculated Behaviour Factor if qacc=4.5 ... 119
Figure 6-26 The Behaviour Factor Calculated for Bolted and Welded Beam Splices ... 120
Figure 6-27 Comparison of the 30 Elastic-Plastic Responses Obtained by Increasing the Intensity of the Ground Acceleration and the Expected Elastic Response for 8S-3B-8m... 121
Figure 6-28 The Relationship between the Response of the Structure in Terms of Maximum Roof Drifts, and the Intensity of the Acceleration, (left) record 12 (right) record 19 ... 121
Figure 6-29 q-Value Dispersion (Obtained by 30 IDAs Record) with Respect to ±20% of Their Design Behaviour Factor for 8S-3B-8m ... 122
XVI Figure 6-30 The Calculated Behaviour Factor with Respect to the Acceptance Range of ±20% from the Initial Design Behaviour Factor (qdes.) and the Total Number of IDAs Records
for 12-Storey Buildings... 123
Figure 6-31 The Calculated Behaviour Factor with Respect to the Acceptance Range of ±20% from the Initial Design Behaviour Factor (qdes.) and the Total Number of IDAs Records for 8-Storey Buildings... 123
Figure 6-32 The Calculated Behaviour Factor with Respect to the Acceptance Range of ±20% from the Initial Design Behaviour Factor (qdes.) and the Total Number of IDAs Records for 4-Storey Buildings... 124
Figure 6-33 The Calculated Behaviour Factor with Respect to the Acceptance Range of ±20% from the Initial Design Behaviour Factor (qdes.) and the Total Number of IDAs Records for 2-Storey Buildings... 124
Figure 6-34 q-Value Dispersion (Obtained by 30 IDAs Record) with Respect to ±20% of the Design Behaviour Factor (q=4) for 8S-3B-6m a) Bolted Beam Splices b) Welded Beam Splices ... 125
Figure 6-35 q-Value Dispersion (Obtained by 30 IDAs Record) with Respect to ±20% of the Design Behaviour Factor (q=4) for 4S-3B-6m a) Bolted Beam Splices b) Welded Beam Splices ... 125
Figure 6-36 q-Value Dispersion (Obtained by 30 IDAs Record) with Respect to ±20% of the Design Behaviour Factor (q=4) for 2S-3B-6m a) Bolted Beam Splices b) Welded Beam Splices ... 125
Figure 9-1 q Factors provided in the First and Last Version of EuroCode ... 143
Figure 9-2 Sap 2000 and OpenSees Comparison for 12S-3B-6m ... 163
Figure 9-3 Sap 2000 and OpenSees Comparison for 8S-3B-6m ... 164
Figure 9-4 Sap 2000 and OpenSees Comparison for 4S-3B-6m ... 165
Figure 9-5 Sap 2000 and OpenSees Comparison for 2S-3B-6m ... 165
Figure 9-6 Sap 2000 and OpenSees Comparison for 12S-3B-8m ... 166
Figure 9-7 Sap 2000 and OpenSees Comparison for 8S-3B-8m ... 167
Figure 9-8 Sap 2000 and OpenSees Comparison for 4S-3B-8m ... 168
Figure 9-9 Sap 2000 and OpenSees Comparison for 2S-3B-8m ... 168
Figure 9-10 Sap 2000 and OpenSees Comparison for 12S-4B-6m ... 169
Figure 9-11 Sap 2000 and OpenSees Comparison for 8S-4B-6m ... 170
Figure 9-12 Sap 2000 and OpenSees Comparison for 4S-4B-6m ... 171
XVII
Figure 9-14 Sap 2000 and OpenSees Comparison for 12S-4B-8m ... 172
Figure 9-15 Sap 2000 and OpenSees Comparison for 8S-4B-8m ... 173
Figure 9-16 Sap 2000 and OpenSees Comparison for 4S-4B-8m ... 174
Figure 9-17 Sap 2000 and OpenSees Comparison for 2S-4B-8m ... 174
Figure 9-18 Sap 2000 and OpenSees Comparison for 8S-3B-6m ... 175
Figure 9-19 Sap 2000 and OpenSees Comparison for 4S-3B-6m ... 175
Figure 9-20 Sap 2000 and OpenSees Comparison for 2S-3B-6m ... 175
Figure 9-21 Incremental Dynamic Records for 12S-3B-6m ... 176
Figure 9-22 Incremental Dynamic Records for 8S-3B-6m ... 177
Figure 9-23 Incremental Dynamic Records for 4S-3B-6m ... 178
Figure 9-24 Incremental Dynamic Records for 2S-3B-6m ... 178
Figure 9-25 Incremental Dynamic Records for 12S-3B-8m ... 179
Figure 9-26 Incremental Dynamic Records for 8S-3B-8m ... 180
Figure 9-27 Incremental Dynamic Records for 4S-3B-8m ... 181
Figure 9-28 Incremental Dynamic Records for 2S-3B-8m ... 181
Figure 9-29 Incremental Dynamic Records for 12S-4B-6m ... 182
Figure 9-30 Incremental Dynamic Records for 8S-4B-6m ... 183
Figure 9-31 Incremental Dynamic Records for 4S-4B-6m ... 184
Figure 9-32 Incremental Dynamic Records for 2S-4B-6m ... 184
Figure 9-33 Incremental Dynamic Records for 12S-4B-8m ... 185
Figure 9-34 Incremental Dynamic Records for 8S-4B-8m ... 186
Figure 9-35 Incremental Dynamic Records for 4S-4B-8m ... 187
Figure 9-36 Incremental Dynamic Records for 2S-4B-8m ... 187
Figure 9-37 Incremental Dynamic Records for 8S-3B-6m a) Bolted Beam Splices b) Welded Beam Splices ... 188
Figure 9-38 Incremental Dynamic Records for 4S-3B-6m a) Bolted Beam Splices b) Welded Beam Splices ... 188
Figure 9-39 Incremental Dynamic Records for 2S-3B-6m a) Bolted Beam Splices b) Welded Beam Splices ... 189
Figure 9-40 q-Value Dispersion (Obtained by 30 IDAs Record) with Respect to ±20% (the dashed red lines) of their Design Behaviour Factor for 12S-3B-6m ... 246
Figure 9-41 q-Value Dispersion (Obtained by 30 IDAs Record) with Respect to ±20% (the dashed red lines) of their Design Behaviour Factor for 8S-3B-6m ... 247
XVIII Figure 9-42 q-Value Dispersion (Obtained by 30 IDAs Record) with Respect to ±20% of their Design Behaviour Factor for 4S-3B-6m ... 248
Figure 9-43 q-Value Dispersion (Obtained by 30 IDAs Record) with Respect to ±20% (the dashed red lines) of their Design Behaviour Factor for 2S-3B-6m ... 248
Figure 9-44 q-Value Dispersion (Obtained by 30 IDAs Record) with Respect to ±20% (the dashed red lines) of their Design Behaviour Factor for 12S-3B-8m ... 249
Figure 9-45 q-Value Dispersion (Obtained by 30 IDAs Record) with Respect to ±20% (the dashed red lines) of their Design Behaviour Factor for 8S-3B-8m ... 250
Figure 9-46 q-Value Dispersion (Obtained by 30 IDAs Record) with Respect to ±20% (the dashed red lines) of their Design Behaviour Factor for 4S-3B-8m ... 251
Figure 9-47 q-Value Dispersion (Obtained by 30 IDAs Record) with Respect to ±20% (the dashed red lines) of their Design Behaviour Factor for 2S-3B-8 ... 251
Figure 9-48 q-Value Dispersion (Obtained by 30 IDAs Record) with Respect to ±20% (the dashed red lines) of their Design Behaviour Factor for 12S-4B-6m ... 252
Figure 9-49 q-Value Dispersion (Obtained by 30 IDAs Record) with Respect to ±20% (the dashed red lines) of their Design Behaviour Factor for 8S-4B-6m ... 253
Figure 9-50 q-Value Dispersion (Obtained by 30 IDAs Record) with Respect to ±20% (the dashed red lines) of their Design Behaviour Factor for 4S-4B-6m ... 254
Figure 9-51 q-Value Dispersion (Obtained by 30 IDAs Record) with Respect to ±20% (the dashed red lines) of their Design Behaviour Factor for 2S-4B-6m ... 254
Figure 9-52 q-Value Dispersion (Obtained by 30 IDAs Record) with Respect to ±20% (the dashed red lines) of their Design Behaviour Factor for 12S-4B-8m ... 255
Figure 9-53 q-Value Dispersion (Obtained by 30 IDAs Record) with Respect to ±20% (the dashed red lines) of their Design Behaviour Factor for 8S-4B-8m ... 256
Figure 9-54 q-Value Dispersion (Obtained by 30 IDAs Record) with Respect to ±20% (the dashed red lines) of their Design Behaviour Factor for 4S-4B-8m ... 257
Figure 9-55 q-Value Dispersion (Obtained by 30 IDAs Record) with Respect to ±20% (the dashed red lines) of their Design Behaviour Factor for 2S-4B-8m ... 257
XIX
List of Tables
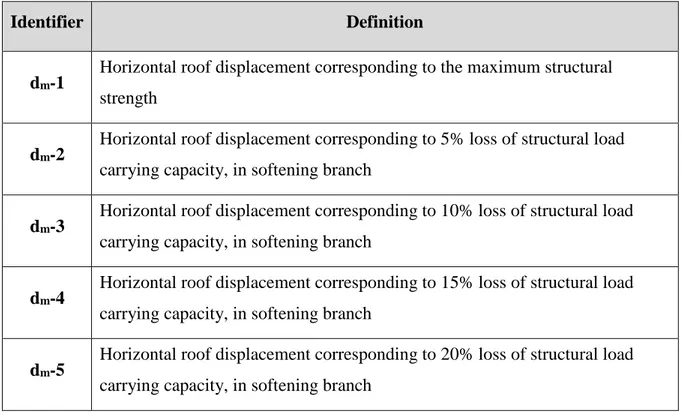
Table 3-1 Possible Definitions for Maximum Horizontal Roof Displacement (dm)
Corresponding to the Maximum Strength or/and in Softening Branch ... 30
Table 3-2 Possible Definitions for Yielding Point (Fy-dy) ... 31
Table 3-3 Possible Definitions for the First Significant Yielding (F1) and d1 ... 32
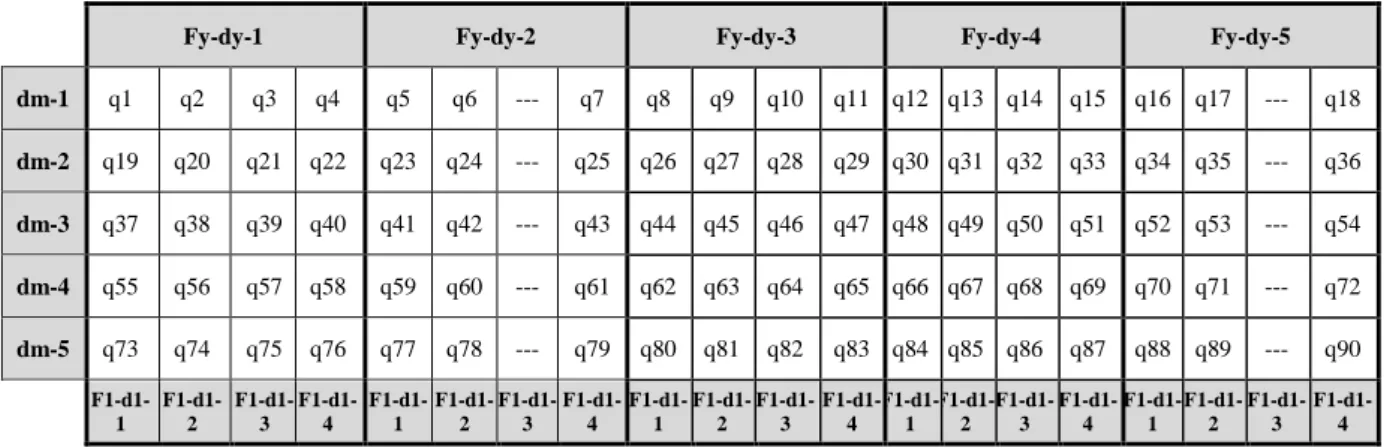
Table 3-4 All Possible q Factor Evaluation Methods ... 33
Table 4-1 Coefficients for Various Load Combinations ... 47
Table 4-2 Structural Height (H) and Width (B) of the Typical 3-Bay MRF Systems ... 49
Table 4-3 Structural Height and Width of the Typical 4-Bay MRF Systems ... 49
Table 4-4 Structural Height and Width for Non-Conventional Structure Having Bolted/Welded Beam Splices ... 52
Table 4-5 Beam Section for all Types of Building Configurations ... 64
Table 4-6 Columns Section for the 8/4 and 2 Storey Buildings ... 65
Table 4-7 Dimension of the Flange Plate of Beam Splices and Their Distribution in Height ... 66
Table 4-8 Dimension of the Web Plate of Beam Splices ... 67
Table 5-1 The Initial Material Costs for 3B-6m (in Thousand Euro) ... 87
Table 5-2 The Initial Material Costs for 3B-8m (in Thousand Euro) ... 87
Table 5-3 The Initial Material Costs for 4B-6m (in Thousand Euro) ... 87
Table 5-4 The Initial Material Costs for 4B-8m (in Thousand Euro) ... 87
Table 5-5 Behaviour Factor Verification via The Limit State and the Mean Annual Frequency Estimation for 12S-3B-6m ... 92
Table 6-1 Behaviour Factor Calculated for 12S-3B-6m, qdes=3, 4 qacc=3.5 ... 97
Table 6-2 Behaviour Factor Acceptance Percentile for All Conventional Structures ... 97
Table 6-3 The Dispersion of the Calculated Behaviour Factor for All Conventional Structures ... 98
Table 6-4 Behaviour Factor Acceptance Percentile for 8/4 and 2-Storey Bolted and Welded Beam Splices ... 100
Table 6-5 The Dispersion of the Calculated Behaviour Factor for 8/4 and 2-Storey Bolted and Welded Beam Splices ... 100
XX Table 9-1 Behaviour Factor’s Values in Different Seismic Codes Provision for MRFS [6]
... 144
Table 9-2 The Set of Thirty Ground Motion Records ... 145
Table 9-3 Columns Section for the 12/8/4/2S-3B-6m (q=2) ... 146
Table 9-4 Columns Section for the 12/8/4/2S-3B-6m (q=3) ... 146
Table 9-5 Columns Section for the 12/8/4/2S-3B-6m (q=4) ... 147
Table 9-6 Columns Section for the 12/8/4/2S-3B-6m (q=5) ... 147
Table 9-7 Columns Section for the 12/8/4/2S-3B-6m (q=6) ... 147
Table 9-8 Columns Section for the 12/8/4/2S-3B-6m (q=7) ... 148
Table 9-9 Columns Section for the 12/8/4/2S-4B-6m (q=2) ... 148
Table 9-10 Columns Section for the 12/8/4/2S-4B-6m (q=3) ... 148
Table 9-11 Columns Section for the 12/8/4/2S-4B-6m (q=4) ... 149
Table 9-12 Columns Section for the 12/8/4/2S-4B-6m (q=5) ... 149
Table 9-13 Columns Section for the 12/8/4/2S-4B-6m (q=6) ... 149
Table 9-14 Columns Section for the 12/8/4/2S-4B-6m (q=7) ... 150
Table 9-15 Columns Section for the 12/8/4/2S-3B-8m (q=2) ... 150
Table 9-16 Columns Section for the 12/8/4/2S-3B-8m (q=3) ... 151
Table 9-17 Columns Section for the 12/8/4/2S-3B-8m (q=4) ... 151
Table 9-18 Columns Section for the 12/8/4/2S-3B-8m (q=5) ... 151
Table 9-19 Columns Section for the 12/8/4/2S-3B-8m (q=6) ... 152
Table 9-20 Columns Section for the 12/8/4/2S-3B-8m (q=7) ... 152
Table 9-21 Columns Section for the 12/8/4/2S-4B-8m (q=2) ... 153
Table 9-22 Columns Section for the 12/8/4/2S-4B-8m (q=3) ... 153
Table 9-23 Columns Section for the 12/8/4/2S-4B-8m (q=4) ... 153
Table 9-24 Columns Section for the 12/8/4/2S-4B-8m (q=5) ... 154
Table 9-25 Columns Section for the 12/8/4/2S-4B-8m (q=6) ... 154
Table 9-26 Columns Section for the 12/8/4/2S-4B-8m (q=7) ... 154
Table 9-27 Period of Vibration and Mass Participation for Buildings Having 3-Bay and 6m Length of the Bay (q=2) ... 155
Table 9-28 Period of Vibration and Mass Participation for Buildings Having 3-Bay and 6m Length of the Bay (q=3, 4) ... 155
Table 9-29 Period of Vibration and Mass Participation for Buildings Having 3-Bay and 6m Length of the Bay (q=5) ... 155
XXI Table 9-30 period of vibration and mass participation for Buildings Having 3-Bay and 6m Length of the Bay (q=6) ... 156
Table 9-31 period of vibration and mass participation for Buildings Having 3-Bay and 6m Length of the Bay (q=7) ... 156
Table 9-32 Period of Vibration and Mass Participation for Buildings Having 3-Bay and 8m Length of the Bay (q=2) ... 156
Table 9-33 Period of Vibration and Mass Participation for Buildings Having 3-Bay and 8m Length of the Bay (q=3) ... 157
Table 9-34 Period of Vibration and Mass Participation for Buildings Having 3-Bay and 8m Length of the Bay (q=4) ... 157
Table 9-35 Period of Vibration and Mass Participation for Buildings Having 3-Bay and 8m Length of the Bay (q=5) ... 157
Table 9-36 Period of Vibration and Mass Participation for Buildings Having 3-Bay and 8m Length of the Bay (q=6) ... 158
Table 9-37 Period of Vibration and Mass Participation for Buildings Having 3-Bay and 8m Length of the Bay (q=7) ... 158
Table 9-38 Period of Vibration and Mass Participation for Buildings Having 4-Bay and 6m Length of the Bay (q=2) ... 158
Table 9-39 Period of Vibration and Mass Participation for Buildings Having 4-Bay and 6m Length of the Bay (q=3) ... 159
Table 9-40 Period of Vibration and Mass Participation for Buildings Having 4-Bay and 6m Length of the Bay (q=4) ... 159
Table 9-41 Period of Vibration and Mass Participation for Buildings Having 4-Bay and 6m Length of the Bay (q=5) ... 159
Table 9-42 Period of Vibration and Mass Participation for Buildings Having 4-Bay and 6m Length of the Bay (q=6) ... 160
Table 9-43 Period of Vibration and Mass Participation for Buildings Having 4-Bay and 6m Length of the Bay (q=7) ... 160
Table 9-44 Period of Vibration and Mass Participation for Buildings Having 4-Bay and 8m Length of the Bay (q=2) ... 160
Table 9-45 Period of Vibration and Mass Participation for Buildings Having 4-Bay and 8m Length of the Bay (q=3, 4) ... 161
Table 9-46 Period of Vibration and Mass Participation for Buildings Having 4-Bay and 8m Length of the Bay (q=5) ... 161
XXII Table 9-47 Period of Vibration and Mass Participation for Buildings Having 4-Bay and 8m Length of the Bay (q=6) ... 161
Table 9-48 Period of Vibration and Mass Participation for Buildings Having 4-Bay and 8m Length of the Bay (q=7) ... 162
Table 9-49 Design Behaviour Factor Verifications via The Limit State and the Mean Annual Frequency Estimation for 12S-3B-6m ... 190
Table 9-50 Design Behaviour Factor Verifications via The Limit State and the Mean Annual Frequency Estimation for 8S-3B-6m ... 191
Table 9-51 Design Behaviour Factor Verifications via The Limit State and the Mean Annual Frequency Estimation for 4S-3B-6m ... 192
Table 9-52 Design Behaviour Factor Verifications via The Limit State and the Mean Annual Frequency Estimation for 2S-3B-6m ... 192
Table 9-53 Design Behaviour Factor Verifications via The Limit State and the Mean Annual Frequency Estimation for 12S-3B-8m ... 193
Table 9-54 Design Behaviour Factor Verifications via The Limit State and the Mean Annual Frequency Estimation for 8S-3B-8m ... 194
Table 9-55 Design Behaviour Factor Verifications via The Limit State and the Mean Annual Frequency Estimation for 4S-3B-8m ... 195
Table 9-56 Design Behaviour Factor Verifications via The Limit State and the Mean Annual Frequency Estimation for 2S-3B-8m ... 195
Table 9-57 Design Behaviour Factor Verifications via The Limit State and the Mean Annual Frequency Estimation for 12S-4B-6m ... 196
Table 9-58 Design Behaviour Factor Verifications via The Limit State and the Mean Annual Frequency Estimation for 8S-4B-6m ... 197
Table 9-59 Design Behaviour Factor Verifications via The Limit State and the Mean Annual Frequency Estimation for 4S-4B-6m ... 198
Table 9-60 Design Behaviour Factor Verifications via The Limit State and the Mean Annual Frequency Estimation for 2S-4B-6m ... 198
Table 9-61 Design Behaviour Factor Verifications via The Limit State and the Mean Annual Frequency Estimation for 12S-4B-8m ... 199
Table 9-62 Design Behaviour Factor Verifications via The Limit State and the Mean Annual Frequency Estimation for 8S-4B-8m ... 200
Table 9-63 Design Behaviour Factor Verifications via The Limit State and the Mean Annual Frequency Estimation for 4S-4B-8m ... 201
XXIII Table 9-64 Design Behaviour Factor Verifications via The Limit State and the Mean Annual Frequency Estimation for 2S-4B-8m ... 201
Table 9-65 Design Behaviour Factor Verifications via The Limit State and the Mean Annual Frequency Estimation for Bolted Beam Splices ... 202
Table 9-66 Design Behaviour Factor Verifications via The Limit State and the Mean Annual Frequency Estimation for Welded Beam Splices ... 203
Table 9-67 Behaviour Factor Calculated for 12-Storey 3Bays and 6m Length of the Bay, q=2, qacc=5 ... 204
Table 9-68 Behaviour Factor Calculated for 12-Storey 3Bays and 6m Length of the Bay, q=3, 4, qacc=3.5 ... 204
Table 9-69 Behaviour Factor Calculated for 12-Storey 3Bays and 6m Length of the Bay, q=5, qacc=5 ... 205
Table 9-70 Behaviour Factor Calculated for 12-Storey 3Bays and 6m Length of the Bay, q=6, qacc=6 ... 205
Table 9-71 Behaviour Factor Calculated for 12-Storey 3Bays and 6m Length of the Bay, q=7, qacc=7 ... 206
Table 9-72 Behaviour Factor Calculated for 8-Storey 3Bays and 6m Length of the Bay, q=2, qacc=6 ... 206
Table 9-73 Behaviour Factor Calculated for 8-Storey 3Bays and 6m Length of the Bay, q=3, qacc=3 ... 207
Table 9-74 Behaviour Factor Calculated for 8-Storey 3Bays and 6m Length of the Bay, q=4, 5 qacc=4.5 ... 207
Table 9-75 Behaviour Factor Calculated for 8-Storey 3Bays and 6m Length of the Bay, q=6, qacc=6 ... 208
Table 9-76 Behaviour Factor Calculated for 8-Storey 3Bays and 6m Length of the Bay, q=7, qacc=7 ... 208
Table 9-77 Behaviour Factor Calculated for 4-Storey 3Bays and 6m Length of the Bay, q=2, qacc=2 ... 209
Table 9-78 Behaviour Factor Calculated for 4-Storey 3Bays and 6m Length of the Bay, q=3, 4, 5, 6, 7, qacc=5 ... 209
Table 9-79 Behaviour Factor Calculated for 2-Storey 3Bays and 6m Length of the Bay, q=2, 3, 4, 5, 6, 7, qacc=4.5 ... 210
Table 9-80 Behaviour Factor Calculated for 12-Storey 3Bays and 8m Length of the Bay, q=2, qacc=6 ... 211
XXIV Table 9-81 Behaviour Factor Calculated for 12-Storey 3Bays and 8m Length of the Bay, q=3, qacc=3 ... 211
Table 9-82 Behaviour Factor Calculated for 12-Storey 3Bays and 8m Length of the Bay, q=4, qacc=4 ... 212
Table 9-83 Behaviour Factor Calculated for 12-Storey 3Bays and 8m Length of the Bay, q=5, qacc=5 ... 212
Table 9-84 Behaviour Factor Calculated for 12-Storey 3Bays and 8m Length of the Bay, q=6, qacc=6 ... 213
Table 9-85 Behaviour Factor Calculated for 12-Storey 3Bays and 8m Length of the Bay, q=7, qacc=7 ... 213
Table 9-86 Behaviour Factor Calculated for 8-Storey 3Bays and 8m Length of the Bay, q=2, qacc=7 ... 214
Table 9-87 Behaviour Factor Calculated for 8-Storey 3Bays and 8m Length of the Bay, q=3, qacc=3 ... 214
Table 9-88 Behaviour Factor Calculated for 8-Storey 3Bays and 8m Length of the Bay, q=4, qacc=4 ... 215
Table 9-89 Behaviour Factor Calculated for 8-Storey 3Bays and 8m Length of the Bay, q=5, qacc=5 ... 215
Table 9-90 Behaviour Factor Calculated for 8-Storey 3Bays and 8m Length of the Bay, q=6, qacc=6 ... 216
Table 9-91 Behaviour Factor Calculated for 8-Storey 3Bays and 8m Length of the Bay, q=7, qacc=7 ... 216
Table 9-92 Behaviour Factor Calculated for 4-Storey 3Bays and 8m Length of the Bay, q=2, qacc=2 ... 217
Table 9-93 Behaviour Factor Calculated for 4-Storey 3Bays and 8m Length of the Bay, q=3, 4, 5, 6, 7, qacc=5 ... 217
Table 9-94 Behaviour Factor Calculated for 2-Storey 3Bays and 8m Length of the Bay, q=2, qacc=2 ... 218
Table 9-95 Behaviour Factor Calculated for 2-Storey 3Bays and 8m Length of the Bay, q=3, 4, 5, 6, 7, qacc=5 ... 218
Table 9-96 Behaviour Factor Calculated for 12-Storey 4Bays and 6m Length of the Bay, q=2, qacc=5 ... 219
Table 9-97 Behaviour Factor Calculated for 12-Storey 4Bays and 6m Length of the Bay, q=3, qacc=3 ... 219
XXV Table 9-98 Behaviour Factor Calculated for 12-Storey 4Bays and 6m Length of the Bay, q=4, qacc=4 ... 220
Table 9-99 Behaviour Factor Calculated for 12-Storey 4Bays and 6m Length of the Bay, q=5, qacc=5 ... 220
Table 9-100 Behaviour Factor Calculated for 12-Storey 4Bays and 6m Length of the Bay, q=6, qacc=6 ... 221
Table 9-101 Behaviour Factor Calculated for 12-Storey 4Bays and 6m Length of the Bay, q=7, qacc=7 ... 221
Table 9-102 Behaviour Factor Calculated for 8-Storey 4Bays and 6m Length of the Bay, q=2, qacc=7 ... 222
Table 9-103 Behaviour Factor Calculated for 8-Storey 4Bays and 6m Length of the Bay, q=3, qacc=3 ... 222
Table 9-104 Behaviour Factor Calculated for 8-Storey 4Bays and 6m Length of the Bay, q=4, 5, qacc=4.5 ... 223
Table 9-105 Behaviour Factor Calculated for 8-Storey 4Bays and 6m Length of the Bay, q=6, qacc=6 ... 223
Table 9-106 Behaviour Factor Calculated for 8-Storey 4Bays and 6m Length of the Bay, q=7, qacc=7 ... 224
Table 9-107 Behaviour Factor Calculated for 4-Storey 4Bays and 6m Length of the Bay, q=2, qacc=2 ... 224
Table 9-108 Behaviour Factor Calculated for 4-Storey 4Bays and 6m Length of the Bay, q=3, 4, 5, 6, 7, qacc=5 ... 225
Table 9-109 Behaviour Factor Calculated for 2-Storey 4Bays and 6m Length of the Bay, q=2, 3, 4, 5, 6, 7, qacc=4.5 ... 225
Table 9-110 Behaviour Factor Calculated for 12-Storey 4Bays and 8m Length of the Bay, q=2, qacc=5 ... 226
Table 9-111 Behaviour Factor Calculated for 12-Storey 4Bays and 8m Length of the Bay, q=3, qacc=3 ... 226
Table 9-112 Behaviour Factor Calculated for 12-Storey 4Bays and 8m Length of the Bay, q=4, qacc=4 ... 227
Table 9-113 Behaviour Factor Calculated for 12-Storey 4Bays and 8m Length of the Bay, q=5, qacc=5 ... 227
Table 9-114 Behaviour Factor Calculated for 12-Storey 4Bays and 8m Length of the Bay, q=6, qacc=6 ... 228
XXVI Table 9-115 Behaviour Factor Calculated for 12-Storey 4Bays and 8m Length of the Bay, q=7, qacc=7 ... 228
Table 9-116 Behaviour Factor Calculated for 8-Storey 4Bays and 8m Length of the Bay, q=2, qacc=7 ... 229
Table 9-117 Behaviour Factor Calculated for 8-Storey 4Bays and 8m Length of the Bay, q=3, qacc=3 ... 229
Table 9-118 Behaviour Factor Calculated for 8-Storey 4Bays and 8m Length of the Bay, q=4, qacc=4 ... 230
Table 9-119 Behaviour Factor Calculated for 8-Storey 4Bays and 8m Length of the Bay, q=5, qacc=5 ... 230
Table 9-120 Behaviour Factor Calculated for 8-Storey 4Bays and 8m Length of the Bay, q=6, qacc=6 ... 231
Table 9-121 Behaviour Factor Calculated for 8-Storey 4Bays and 8m Length of the Bay, q=7, qacc=7 ... 231
Table 9-122 Behaviour Factor Calculated for 4-Storey 4Bays and 8m Length of the Bay, q=2, qacc=2 ... 232
Table 9-123 Behaviour Factor Calculated for 4-Storey 4Bays and 8m Length of the Bay, q=3, 4, 5, 6, 7, qacc=5 ... 232
Table 9-124 Behaviour Factor Calculated for 2-Storey 4Bays and 8m Length of the Bay, q=2, qacc=2 ... 233
Table 9-125 Behaviour Factor Calculated for 2-Storey 4Bays and 8m Length of the Bay, q=3, 4, 5, 6, 7, qacc=5 ... 233
Table 9-126 Behaviour Factor Calculated for 8-Storey Bolted Beam Splices ... 234 Table 9-127 Behaviour Factor Calculated for 8-Storey Welded Beam Splices ... 234 Table 9-128 Behaviour Factor Calculated for 4-Storey Bolted Beam Splices ... 235 Table 9-129 Behaviour Factor Calculated for 4-Storey Welded Beam Splices ... 235 Table 9-130 Behaviour Factor Calculated for 2-Storey Bolted Beam Splices ... 236 Table 9-131 Behaviour Factor Calculated for 2-Storey Welded Beam Splices ... 236 Table 9-132 Behaviour Factor Acceptance Percentile for 12S-3B-6m... 237 Table 9-133 Behaviour Factor Acceptance Percentile for 8S-3B-6m... 237 Table 9-134 Behaviour Factor Acceptance Percentile for 4S-3B-6m... 238 Table 9-135 Behaviour Factor Acceptance Percentile for 12/8/4/2S-3B-6m ... 238 Table 9-136 Behaviour Factor Acceptance Percentile for 12S-3B-8m ... 239 Table 9-137 Behaviour Factor Acceptance Percentile for 8S-3B-8m... 239
XXVII Table 9-138 Behaviour Factor Acceptance Percentile for 4S-3B-8m... 240 Table 9-139 Behaviour Factor Acceptance Percentile for 2S-3B-8m... 240 Table 9-140 Behaviour Factor Acceptance Percentile for 12/8/4/2S-3B-8m ... 241 Table 9-141 Behaviour Factor Acceptance Percentile for 12S-4B-6m... 241 Table 9-142 Behaviour Factor Acceptance Percentile for 8S-4B-6m... 242 Table 9-143 Behaviour Factor Acceptance Percentile for 4S-4B-6m... 242 Table 9-144 Behaviour Factor Acceptance Percentile for 12/8/4/2S-4B-6m ... 243 Table 9-145 Behaviour Factor Acceptance Percentile for 12S-4B-8m... 243 Table 9-146 Behaviour Factor Acceptance Percentile for 8S-4B-8m... 244 Table 9-147 Behaviour Factor Acceptance Percentile for 4S-4B-8m... 244 Table 9-148 Behaviour Factor Acceptance Percentile for 2S-4B-8m ... 245 Table 9-149 Behaviour Factor Acceptance Percentile for 12/8/4/2S-4B-8m ... 245
XXVIII
List of Symbols and Abbreviations
q behaviour factor
qdes design behaviour factor
MRFS moment resisting frame system V seismic design base shear Z seismic zone factor
C building’s natural period of vibration
W building’s weight
S spectral response acceleration F site coefficient
I importance factor
R response modification factor also called force reduction factor T natural period of vibration
EC8 EN 1998-1:2004
FEMA federal emergency management agency
AIJ seismic loading—strong motion prediction and building response qμ ductility factor
qΩ overstrength factor
Fe strength force if the structure remains elastic during the earthquake
F1 significant yield strength
𝑞𝜉 damping dependent factor
𝑑𝑚 displacement corresponding to the maximum strength 𝑑𝑦
displacement corresponding to the knee-point of the idealized bilinear elastic-plastic behavior curve
Fy knee point of the idealized bilinear yield strength
μ system ductility
SDOFS single degree of freedom system MDOFS multiple degree of freedom system 𝑎𝑚𝑎𝑥 maximum peak ground acceleration αd maximum design acceleration 𝐼𝐷𝐿 dynamic linear elastic analysis
XXIX 𝐼𝐷𝑁𝐿 dynamic non-linear analysis
∈𝑃𝑖 plastic deformation
∈𝑦 yield deformation
A area of the cross section
ECCS European convention for constructional steelwork IDA incremental dynamic analysis
ag peak ground acceleration AvgSa average spectral acceleration IM intensity measure
TRi can be selected as linearly spaced within the range of [tl, th]. TL low period near the minimum second mode of the structure
TH high period which is close to 1.5 times of the maximum of the first mode period
Sa spectral acceleration
EDP engineering demand parameter GC global collapse limit state LS life safety limit state
ASCE American society of civil engineers NC near collapse
SD significant damage MAF mean annual frequency
𝐷𝑆𝑙𝑖𝑚
maximum allowable maf limit whose exceedance signals violation of the damage state
Kx standard normal variants associated with a confidence level of x%, kx=φ-1(x)
k local slope of the hazard curve in log-log space βu
total dispersion due to uncertainty, assuming log-normality
𝑢= √𝑇𝐷2 + 𝐷𝑅 2 + 𝐴𝑆 2 + 𝐶 2
βTD test data quality rating βDR design rules quality rating βAS archetype sample size
XXX
m mass of structure
R(T) normalized spectrum 𝑅(𝑇) =(𝑇 𝑇𝑅0
0
⁄ )𝑘
R0, T0 and k parameters that define the design spectrum
α ground acceleration
α1 ground acceleration in which the first yield or plastic mechanism occurs (local plasticization)
CBFs braced frame system H structural height
B structural width
HSFG high strength friction grip NEd normal design force
NRd design values of the resistance to normal forces My,Ed design bending moment in y-axis
My,Rd design values of the resistance to bending moment in y-axis Mz,Ed design bending moment in z-axis
Mz,Rd design values of the resistance to bending moment in z-axis.
Nb,Rd design buckling resistance of the compression member 𝑁𝑏,𝑅𝑑 =𝜒𝐴𝑓 𝑦
𝑀1
𝜒 reduction factor for the relevant buckling mode MEd design value of the moment
Mb,Rd design buckling resistance moment
h storey height
reduction factor which takes into account the lower return period of the
seismic action associated with the damage limitation requirement. dr design inter-storey drift
Ptot total gravity load at and above the storey considered in the seismic design situation
Vtot total seismic storey shear
ΣMRc sum of the design values of the bending resistance of the columns framing the joint
ΣMRb sum of the design values of the bending resistance of the beams framing the joint
XXXI tf flange thickness of the beam splices
L0 free buckling length 𝑀𝑝
elastic moment of the rectangular cross-section of the plate 𝑀𝑝 = 𝑏𝑓∗ 𝑡𝑓
2
4 ∗ 𝑓𝑦 bf width of the flange plate
𝑀𝑅𝑑,𝑓𝑢𝑠𝑒+
sagging resistant moment of the bolted beam splice
𝑓𝑦𝑑 design yield strength of the structural steel according to en1993-1-1 𝑧 distance between the flange plate and the center of gravity of the rebar
layers 𝑧 = ℎ𝑎+ ℎ𝑝+ ℎ2𝑐
ha height of the steel beam hp height composite beam hc height of concrete slab
𝑉𝐸𝑑 total shear force 𝑉𝐸𝑑 = 𝑉𝐸𝑑,𝑀+ 𝑉𝐸𝑑,𝐺
𝑉𝐸𝑑,𝑀 ear force due to moment resistance of the fuse 𝑉𝐸𝑑,𝑀 =𝑀𝑓𝑢𝑠𝑒,𝑅𝑑+ − 𝑀𝑓𝑢𝑠𝑒,𝑅𝑑−
𝑑
𝑉𝐸𝑑,𝐺 shear force due to gravity loads 𝑑 distance between the fuses.
𝐺𝑘,𝑗 gravity load effects in seismic design situation 𝑄𝑘,𝑖 movable load effects in seismic design situation
E effect of the seismic action including accidental torsional effects ABSSUM absolute sum
SRSS square root of sum of squares CQC complete quadratic combination
S soil factor
lower bound factor for the horizontal design spectrum
damping correction factor ULS ultimate limit state
XXXII
Chapter 1
1
1 INTRODUCTION
The research presented in this thesis is motivated by the disparity between the vast volume of academic literature in the field of structural design, especially in the part of the force reduction factor (=behaviour factor or response modification factor) and the modern seismic design provisions in building design practice. The core research objective is therefore to contribute towards reducing the gap between the research and industry. The accompanying central hypothesis is to define a procedure for the assessment of the behaviour factor for steel moment resisting frame systems based on pushover curves which can be successfully and appropriately applied in practice. The research objective is achieved through the investigation of 90 possible definitions of reference parameters to define the behaviour factor based on Static Nonlinear Analysis (Pushover) cross checking with the results of Incremental Dynamic Nonlinear Analysis “IDA” (30 records), all applied to 102 conventional and non-conventional steel moment resisting frame systems. Significant research contributions are made in each of these studies, as stated in section 1.5.
This introductory chapter begins to explore a very short introduction on the behaviour factor, the problem statement, the research goals and the proposed methodology to achieve the research goals. Followed by the structure of the thesis with an overview of each subsequent chapter.
1.1 A Short Introduction on the Behaviour Factor
Design for seismic resistance has been undergoing a critical reappraisal in recent years, with the emphasis changing from “strength” to “performance”. For most of the past 80 years, strength and performance have been considered to be synonymous. However, over the past 30 years there has been a gradual shift from this position with the realization that increasing strength may not enhance safety, nor necessarily reduce damage. For instance, Park and Paulay in 1975 [1] recognised that a frame building would perform better under seismic attack if it could be assured that plastic hinges would occur in beams rather than in columns (weak beam-strong column mechanism), and if the shear strength of members exceeded the shear corresponding to flexural strength. This can be identified as the true start of performance based seismic design, where the overall performance of the building is controlled as a function of the design process.
2 Based on this idea, in the early 80s, a new generation of structural design codes was issued all over the world, considering two alternative methods for structural analysis:
i) Nonlinear dynamic analysis
ii) Linear elastic response spectrum analysis
The use of the first method is motivated by particular cases related to the importance of the building or its functionality, however, its application is unusual in everyday practice because of its complexity. Hence, seismic design codes define a procedure in which the nonlinear behaviour of the structure can be predicted by a linear design procedure (the second method) using a single value called behaviour factor.
According to the modern seismic codes in the design scenario, to avoid explicit inelastic structural analysis, the capacity of the structures to resist the ground motion forces is taken into account by performing an elastic analysis with the use of a seismic design load reduction factor which is the so called behaviour factor “q”. In other words, the behaviour factor modifies the linear elastic spectra to the nonlinear inelastic spectra in order to obtain an approximation of the nonlinear dynamic response of the structure through a linear structural model (see Figure 1-1). The behaviour factor (also called “q-factor” according to the European Standard [2]) can be defined as the ratio of the peak ground acceleration producing collapse of the structure to that at which the first yielding occurs (where the response of any structural members is no longer linear). Hence, the behaviour factor should reflect the capability of the structure to dissipate seismic energy through inelastic behaviour. Thus, the force reduction factor should take into account the actual structural behaviour, the system ductility and the collapse criteria under the earthquake loading. The system ductility could also depend on structural configurations, the ductility of the material, the second order effects and fragile mechanisms [2]–[4]. Further, it may depend moderately on the period of vibration and on the hysteretic model [5], [6].
3
1.2 Problem Statement
A precise estimation of the behaviour factor for a given structure is very complex since it depends on many factors such as: the accelerogram acting at the base of the structure, the structural ductility, the system configuration, degree of redundancy, local and global buckling effects. Therefore, in the 80’s, generic estimates of the q-factor have been provided by extensive research carried out all over the world [3], [4], [15]–[23], [7]–[14]. For example, in Europe the behaviour factor was introduced in the first publication of Eurocode 8 (May 1988). The behaviour factors defined in this edition remain nearly unchanged. A comparison between the two editions of Eurocode 8 is shown in Figure 9-1 in APPENDIX-A [24].
The following statements define the research problem in three stages:
Stage 1
Modern seismic codes present the value of the behaviour factor, without even mentioning how they evaluated them or how to evaluate them, in a table which specifies a number for each structural typology. Interestingly, this value of the behaviour factor varies from code to code as shown in Eurocode [2], FEMA [25] and AIJ [26], with a large discrepancy. Table 9-1 in APPENDIX-A shows the value of the behaviour factor in 27 different seismic codes provision for MRF systems. EC8 [2], for example, defines the q-factor for steel moment resisting frame structures as 4.0 for medium class ductility and 5.5 to 6.5 for high class ductility and to the maximum value of 8.0 when nonlinear analysis is performed. On the contrary, this value, in the world, is felt between a min of 2 for the Philippines and a maximum of 12 for Bangladesh (only 8.0 in UBC [27] and only 4.0 in Japanese seismic code (AIJ) [6], see APPENDIX-A, Table 9-1).
The large scatter of the defined behaviour factor might be arisen from the assumption of the different approaches by the various codes which may not be acceptable from the scientific and practitioners point of view. In other words, different codes define different physical procedures in a different way which results in a wide variety of possible choices by selecting the reference parameters. For instance, EC8 uses the first significant yield strength α1 for overstrength factor (𝛼𝑚𝑎𝑥⁄ ) rather than the design base shear Vdesign employed by US codes. 𝛼1
In particular, the economic implementations related to the fact that the same structure designed by various codes (that in principle should provide the same safety requirements) results in a different weight of the materials, is barely acceptable.
4 Additionally, the number of code-approved structural systems in Eurocode is limited to only four original systems, namely moment resisting frames (MRF), concentric or eccentric braced frames and concrete cores or walls that at best date back to the 1970’s. Hence, newer seismic protection systems, can only be employed by experts and will remain out of reach of most professional scientists and practitioners. Unlike in the US, where the well-received FEMA P-695 [28] standard has settled this debate, Europe (EC8 [2]) has not formulated any standard methodologies to settle this kind of problem, just bearing some recommendations in ECCS [29].
The current stage made an attempt to propose a methodology for the assessment of quantitative values of the behavior factor “q” for steel MRF buildings that can be lead to a close approximation of the actual behaviour factor for any structure.
Stage 2
In general, the usual process for the design of a non-statically determined structure requires three steps as follows; Figure 1-2 shows the general structural design process according to the modern seismic design codes.
Phase 1;
When the engineer, mostly based on his/her experience and/or by “analogy” with other existing structures of similar dimensions and typology, identifies an initial “size” of the structural load-carrying members.
Phase 2;
When the structural analysis is carried out, leading to the assessment of the “demand” (in terms of axial load, bending moments, shear and torsion and of displacements or rotations in the joints) in the various structural members under the external actions.
Phase 3;
When the “capacity” of the load carrying structural members, of their connections and of the building foundations is verified (under the stresses induced by the internal actions derived from the structural analysis in phase 2) both in terms of “strength” and “ductility”. The latter is extremely important and desirable, especially when designing a structure in an earthquake prone area, as it allows the structure to dissipate the energy through the development of plastic deformations in specific zones.
5
Figure 1-2 General Structural Design Process
In order to verify the global and local capacity of the structure in terms of ductility, the easiest way allowed by the modern software tools is to perform a push-over analysis. However, this doesn’t assure that the “actual” behaviour factor (= the actual ductility of the structure) verified by the pushover analysis will coincide with the “assumed” one (= behaviour factor given by the codes). Indeed, several case studies analysing the ductility of the structures designed with a certain q-factor show that the real ductility is far from the assumed value. Of course, for an optimal design these two values should more or less coincide.
Design engineers, however, never tend to optimize their design using more advanced procedures, due to their complexity. Even if an engineer would like to use the current advanced design procedures (such as nonlinear pushover analysis), without “reliable” information on the nonlinear response of each single component of his/her structure, he/she cannot achieve “reliable” results.
In the same way, academic community agrees on the weakness of the available linear force-based design code procedures, and have been working on the more complicated procedures to provide tools for the optimized design of structures (such as displacement and performance-based design). As regards, apparently, there are not yet available tools that convince the design engineers to use such methods.
The author believes that the current linear seismic design procedure requires additional activities (additional step) so that the above problems can be overcome by performing a pushover analysis after phase 1, and assessing the capacity (in terms of strength and ductility) of the preliminary designed structure as well as its “actual” q-factor based on the results of such analysis. Subsequently, phase 2 and 3 can be performed, but in this case “assumed” and “actual” ductility are more or less coincident, and hence the design is optimized. Figure 1-3 shows the schematic view of the proposed new design procedure with augmented efficiency.
In order to do so, a standard re-analysis procedure of the results of the pushover analysis should be identified. Presently, only FEMA P-695 [28] provides a procedure for the definition of the q-factor (in [25], [27], [28] referenced to as “response modification factor”) by
re-Assume the
Initial Structural
Sizes
Assessment of
Structural
Demand
Verification of
the Assumed
Structural Sizes
6 analysis of the push over curve. In Europe, such a method is not yet proposed by EC8 and only ECCS [29] provides some recommendations. In any case, in order to re-analyse the push-over curve, the main parameters adopted by both FEMA and ECCS are defined in different ways which affects the assessment of the factor and hence, results in a different value of the q-factor (see Stage 1).
Figure 1-3 New Design Procedure with Augmented Efficiency
Stage 3
The optimization of the structural design remains a paramount issue for the structural designers to achieve sustainable building with a low construction cost and minimum maintenance costs during the structure’s life. Since the initial construction cost (cost of the material such as columns, beams, etc.) of a building is always an important parameter, the
Perform Preliminary Design
Perform Nonlinear Static Analysis (Pushover)
Obtain the Behaviour Factor
Perform the Seismic Analysis Based on Obtained Behaviour Factor
Verification of the Assumed Structural Sizes
7 design optimization objective is to minimize the initial structural weight (or initial structural cost of the material) in a fully stressed state so that it fulfills the desired component reliability levels. The design of steel-based-structures in seismic areas is highly influenced by the seismic loads due to their considerable flexibility under the lateral loads. According to the code requirements, the capacity of the structures to resist the ground motion forces can be verified by performing an elastic analysis with the use of a seismic design load reduction factor which is so called behaviour factor “q”. It is evident that the lower the actions in a structure, the less need for materials required for a strength/force-based design of the structure. In other words, when increasing the q factor, the global forces decrease, hence, a reduction of structural weight is expected. But, it is not always so, because of other factors, such as the limits imposed by the codes (allowable inter-storey drift, drift sensitivity “θ” and lower bound factor “”), which will prevent reduction of member’s sizes and both local and global structural stiffness. The current stage will present a novel strategy for an optimal design of steel structures in high seismic zones through balancing the initial cost and the lifetime seismic damage. The investigation will be performed in order to explore the relationship between the expected initial material cost and the design behaviour factor.
1.3 The Research Goals
The main aim of this research is to establish a consistent procedure for the assessment of the behaviour factor for MRF buildings.
The research goals can be identified as follows:
1) To propose a methodology for the assessment of quantitative values of the behavior factor “q” for steel MRF buildings that can be easily applied in everyday design practice, and can lead to a close approximation of the actual behaviour factor for each specific structure being analysed.
2) To show the generality of the proposed methodology by applying it to innovative structural systems such as building having dissipative elements that are more complex than the conventional structures, in order to show the ability of the method to provide a reasonable assessment of the behaviour factor for any newer innovative structures.
![Figure 3-6 displays the concept of performance assessment for a given damage state [79]](https://thumb-eu.123doks.com/thumbv2/123dokorg/7501035.104498/73.892.113.773.365.528/figure-displays-concept-performance-assessment-given-damage-state.webp)